Download as PDF, PPTX


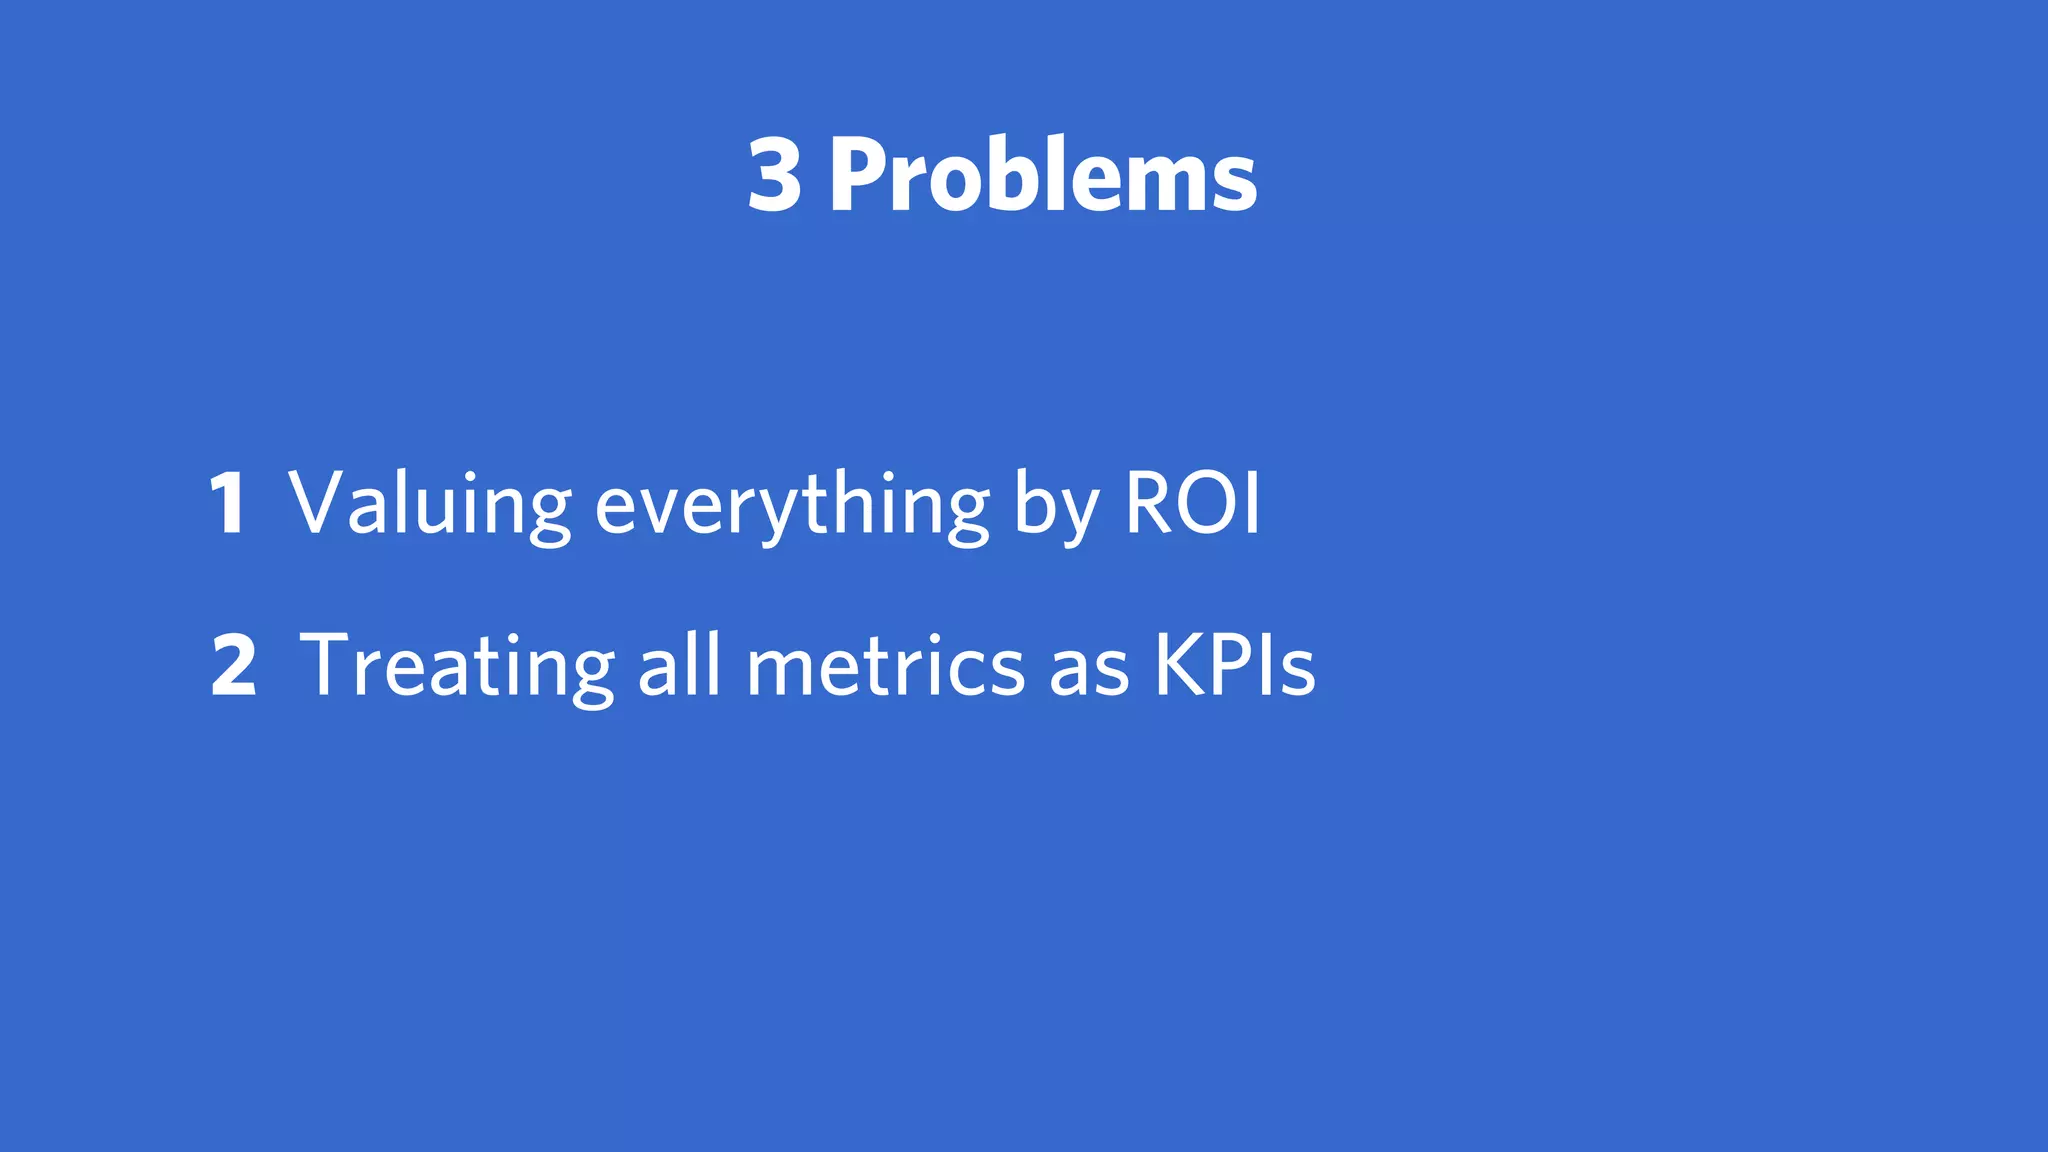
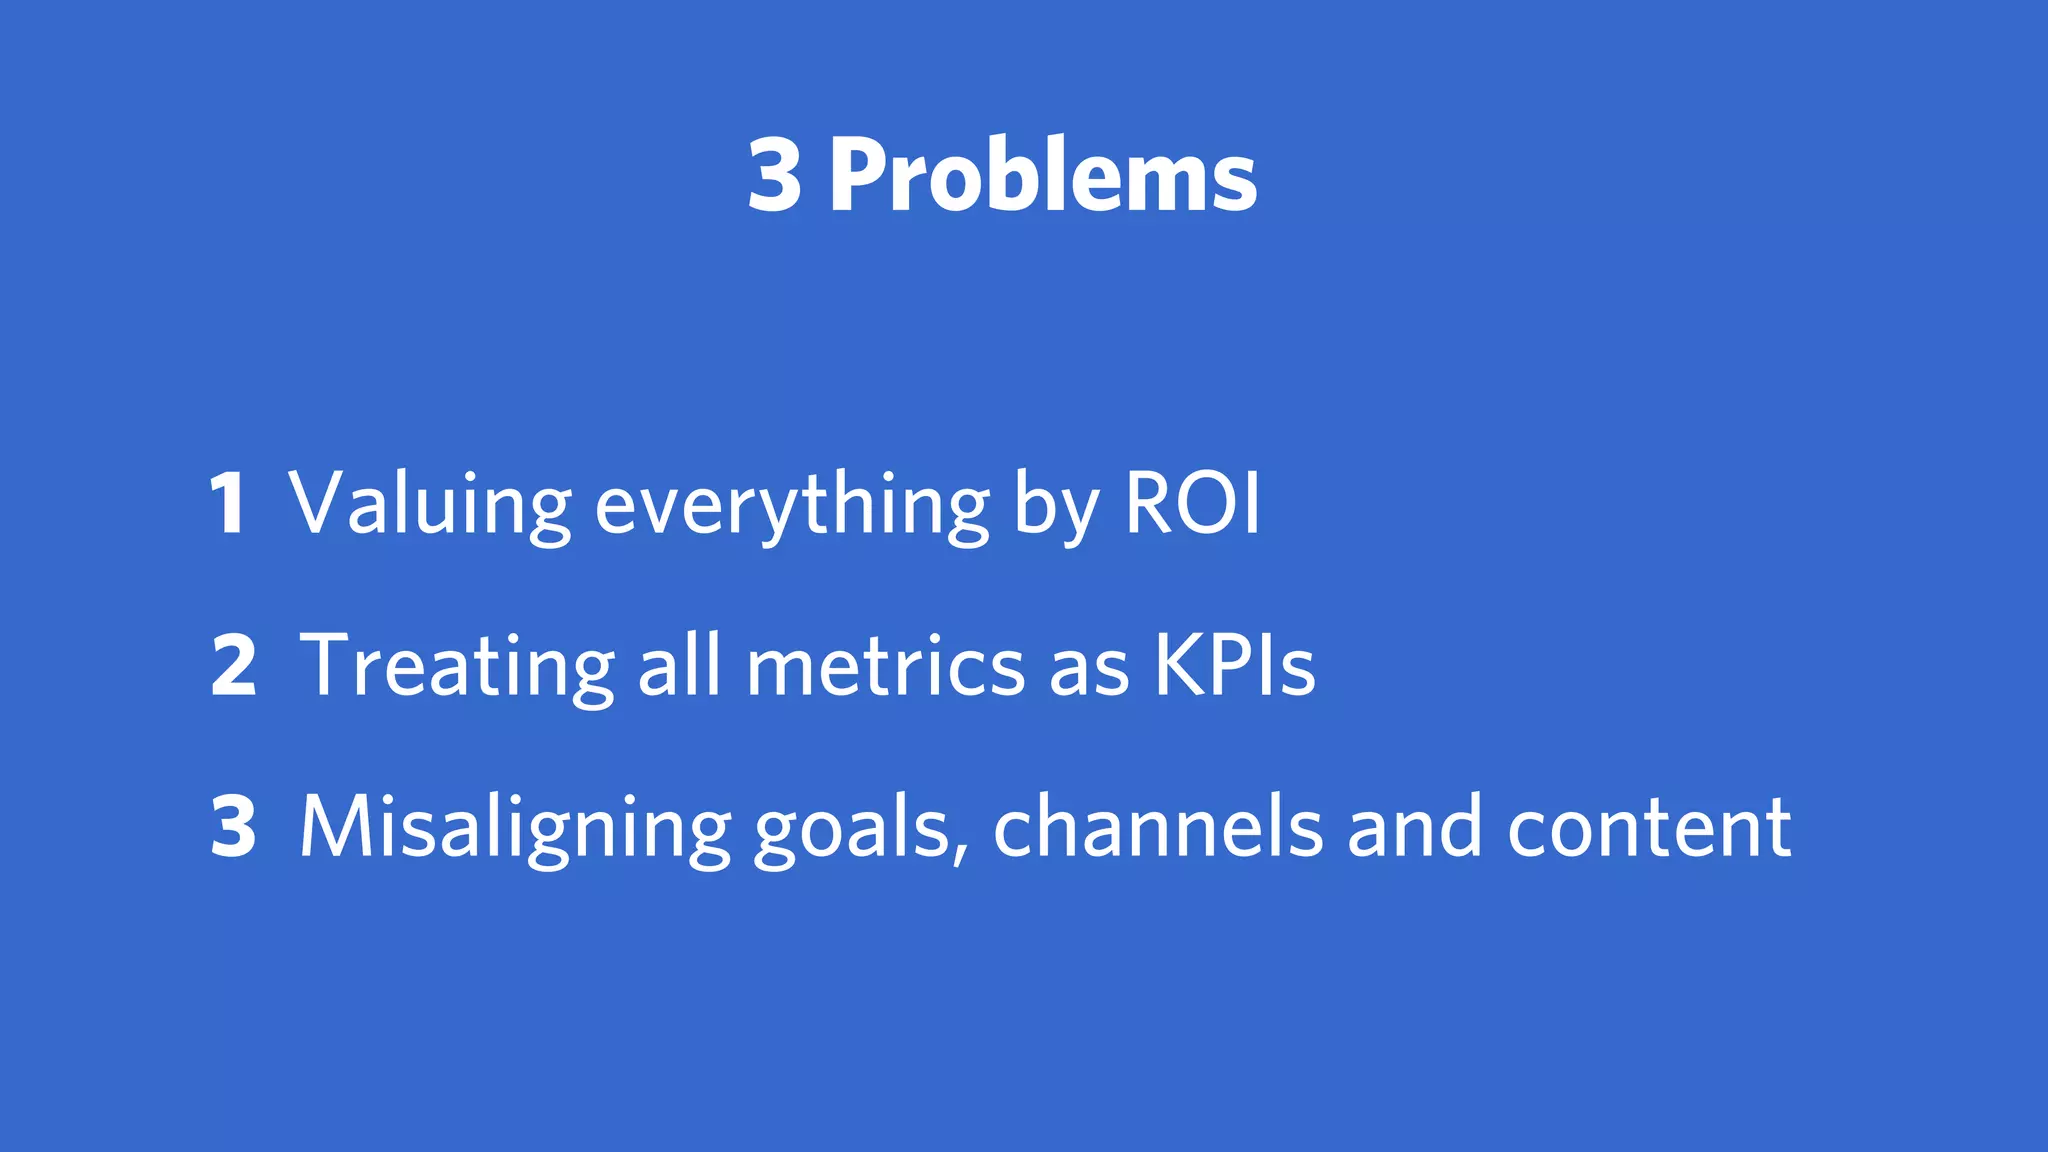

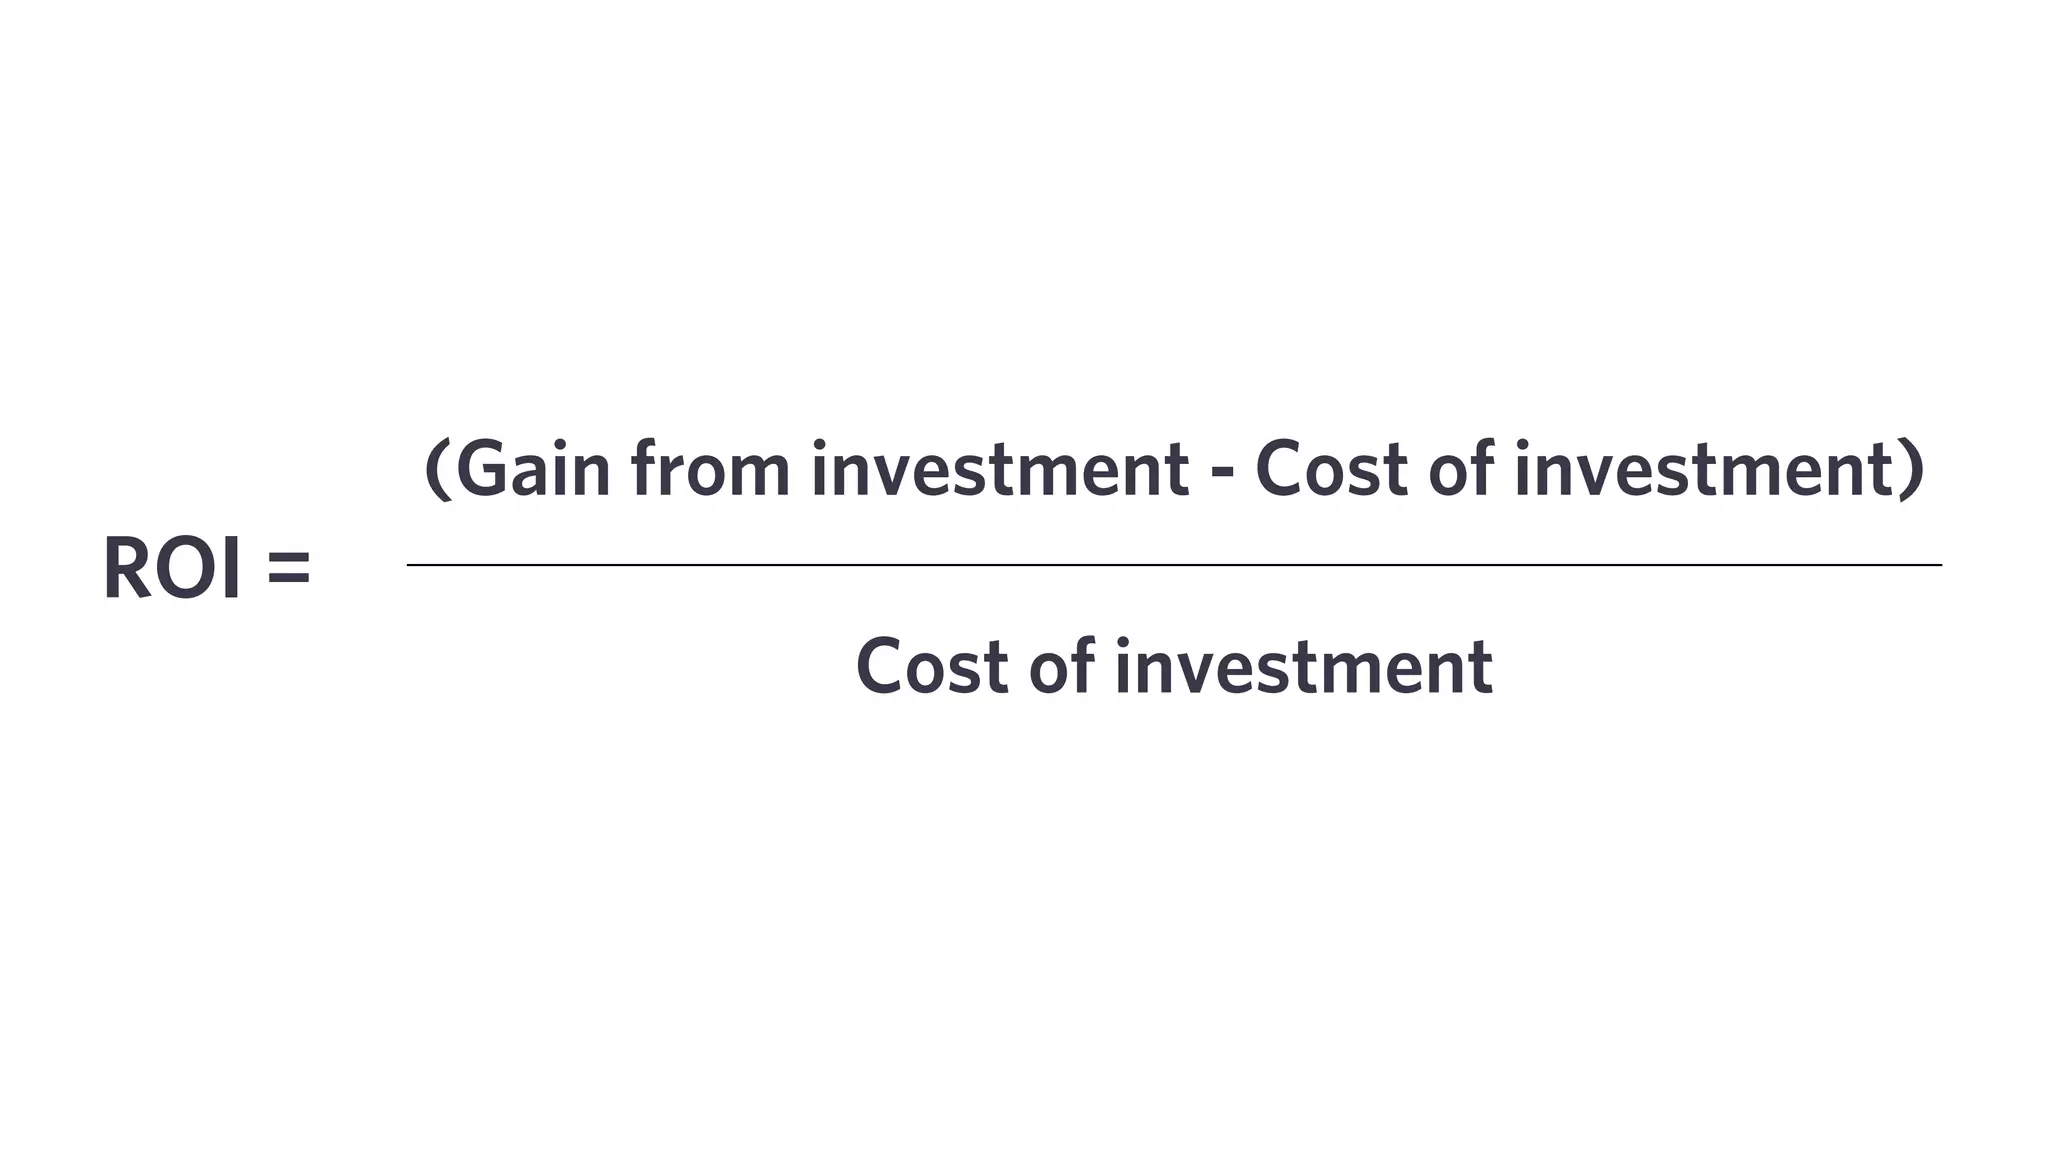


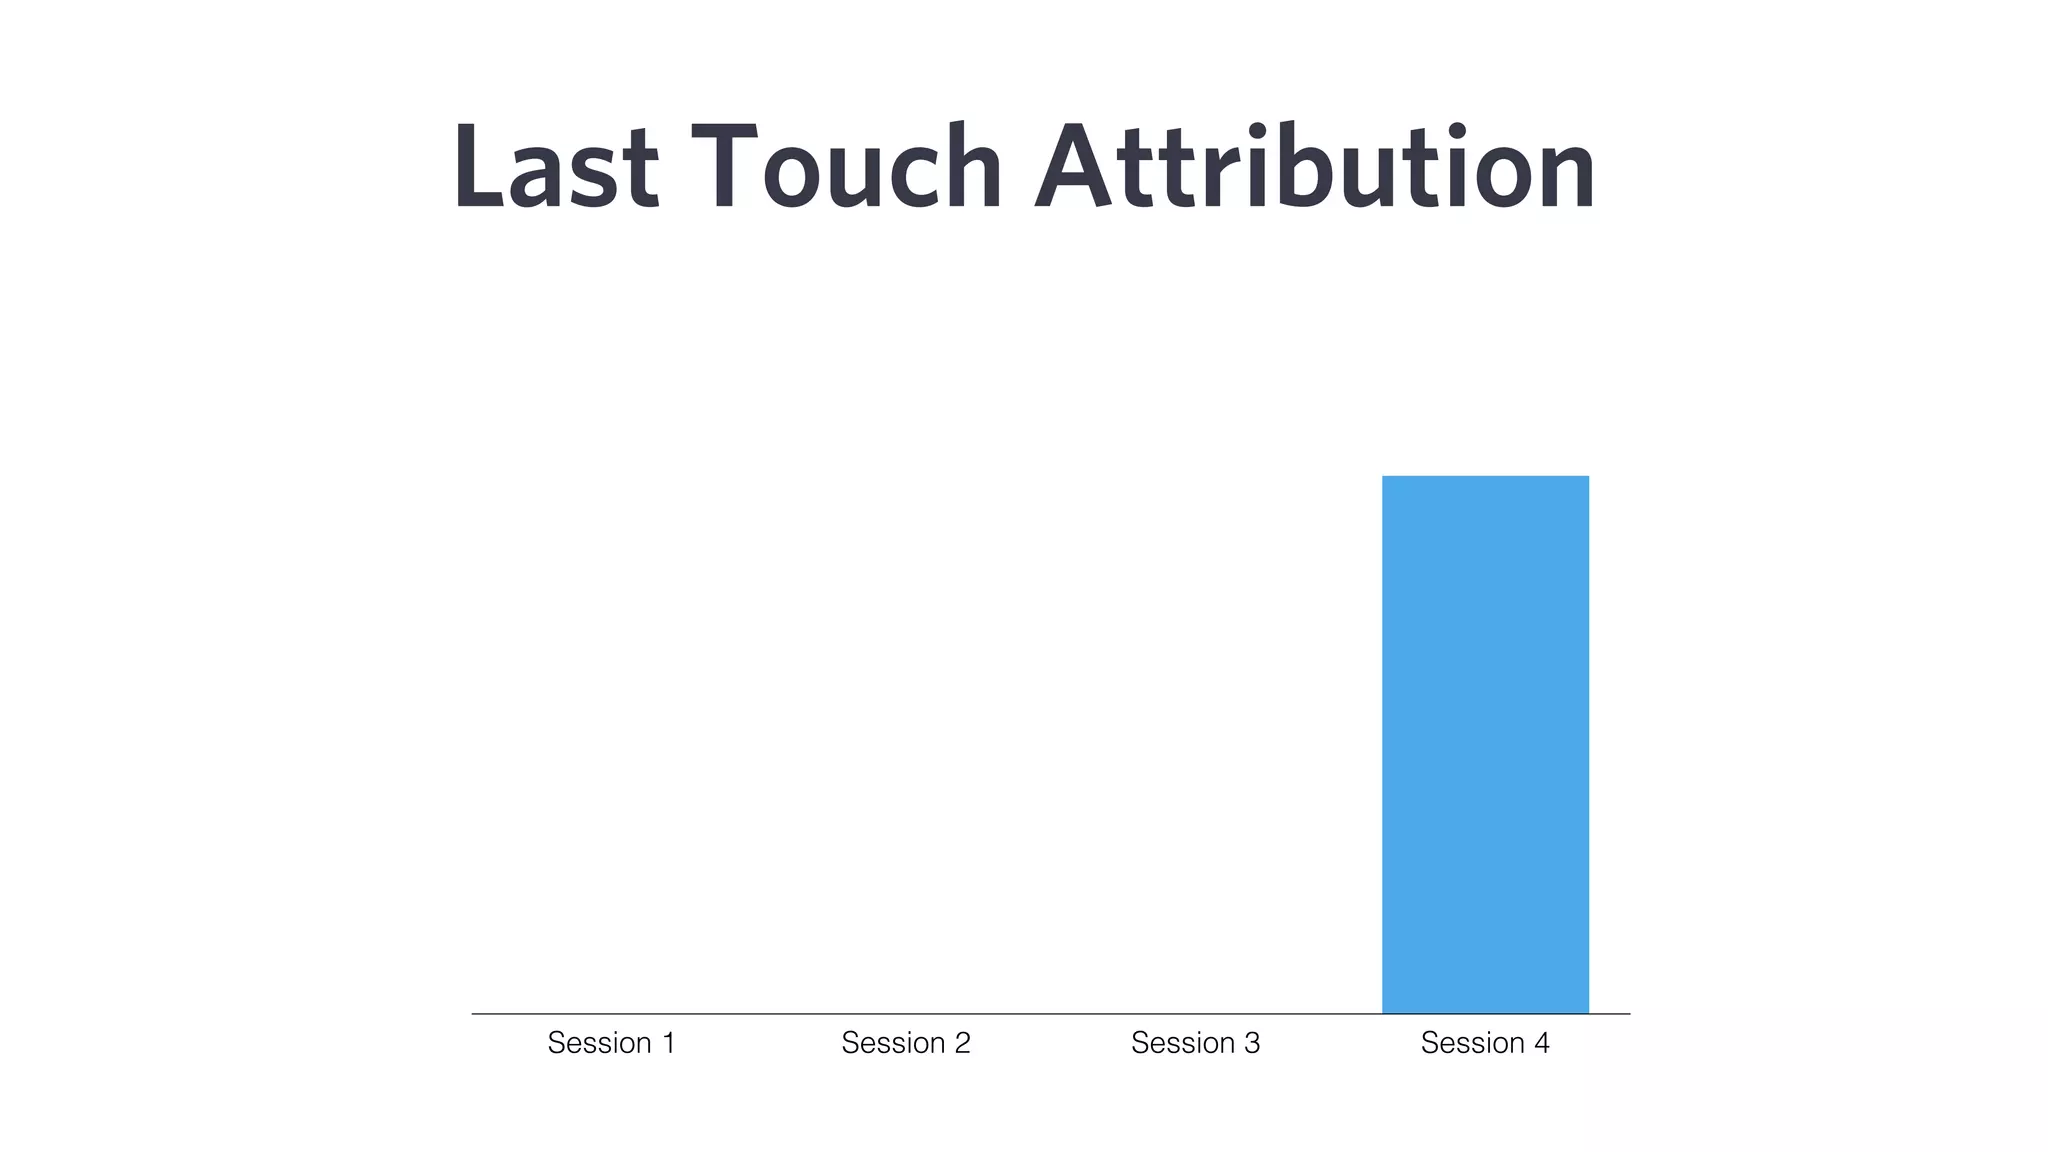


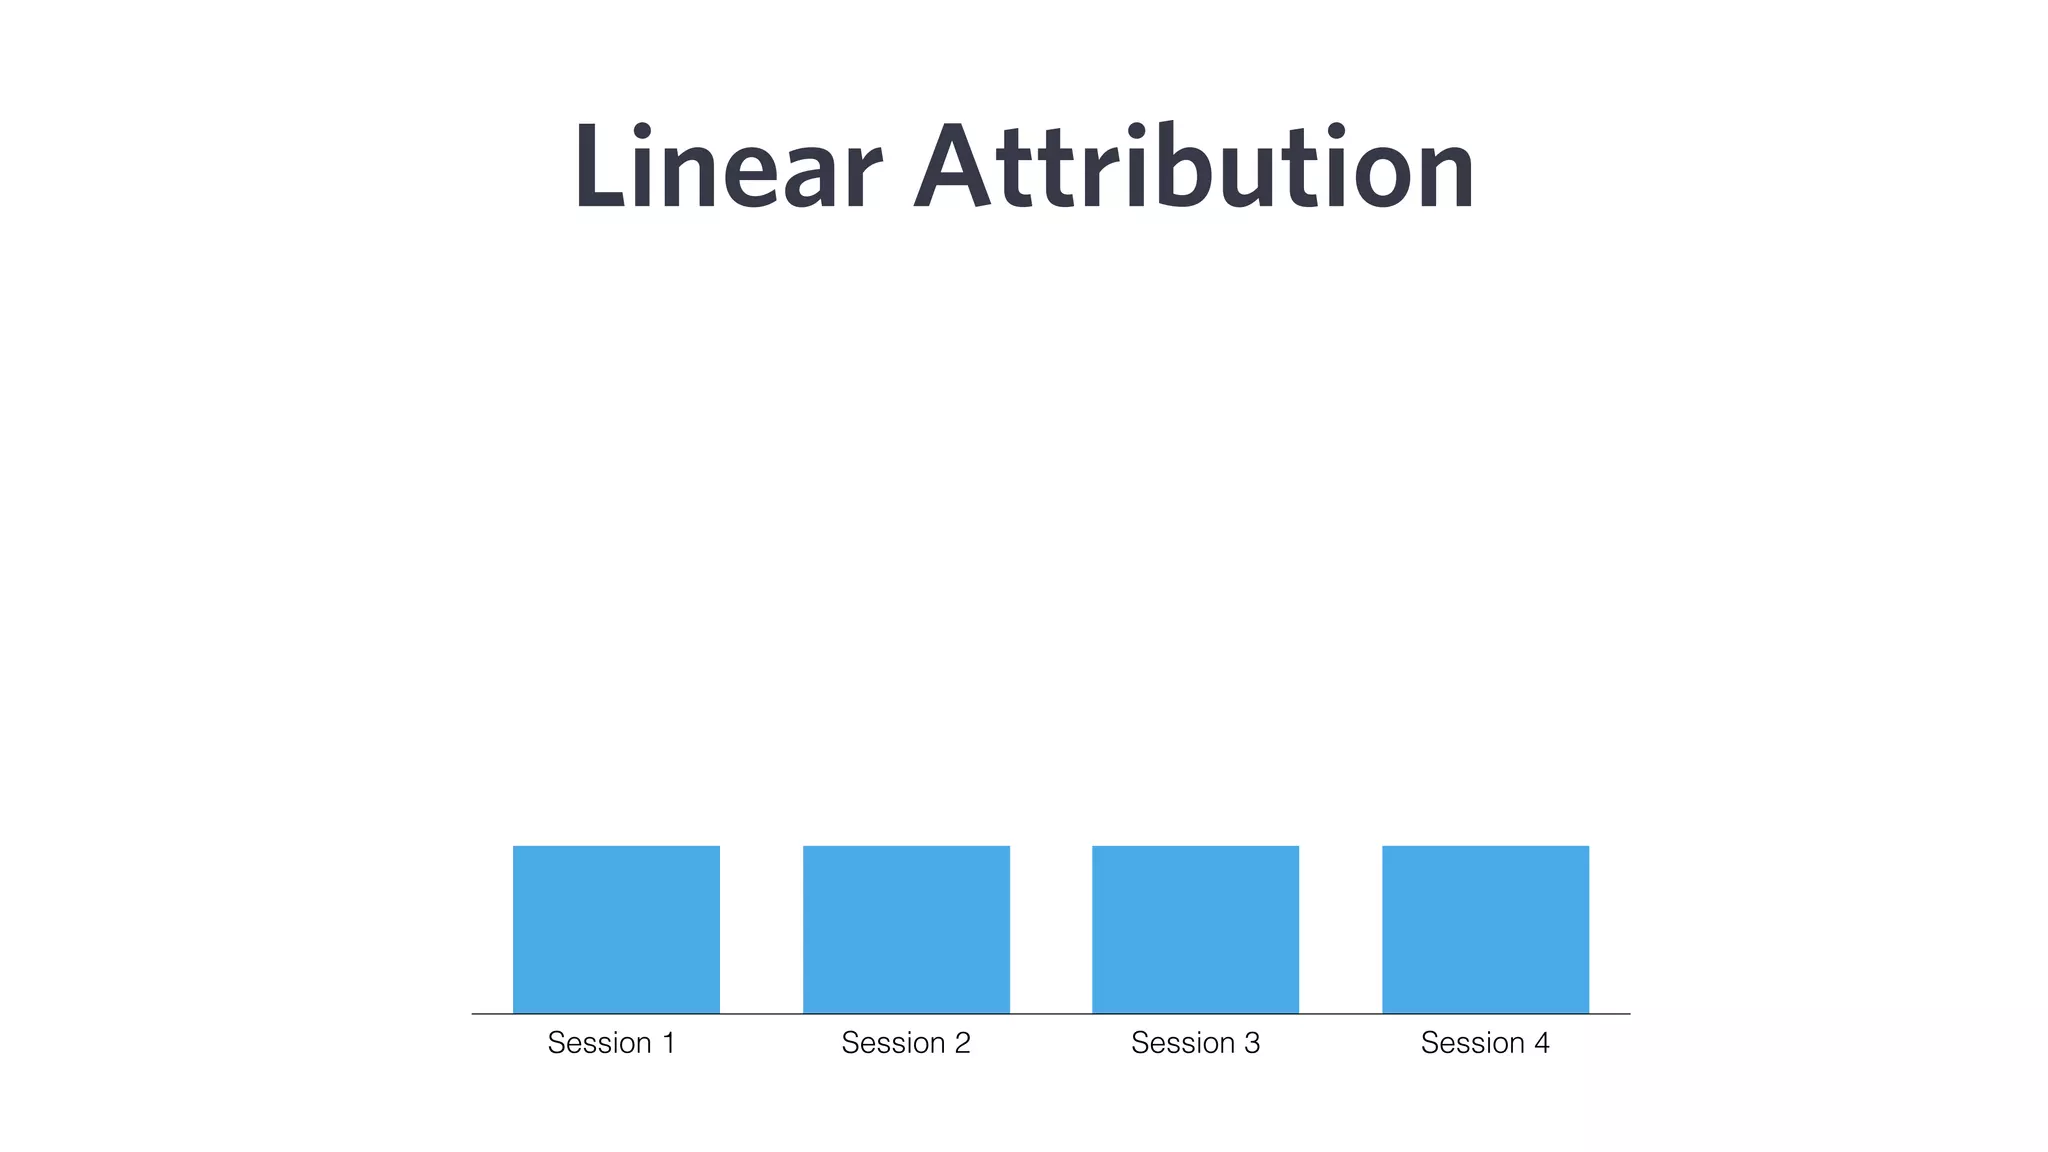


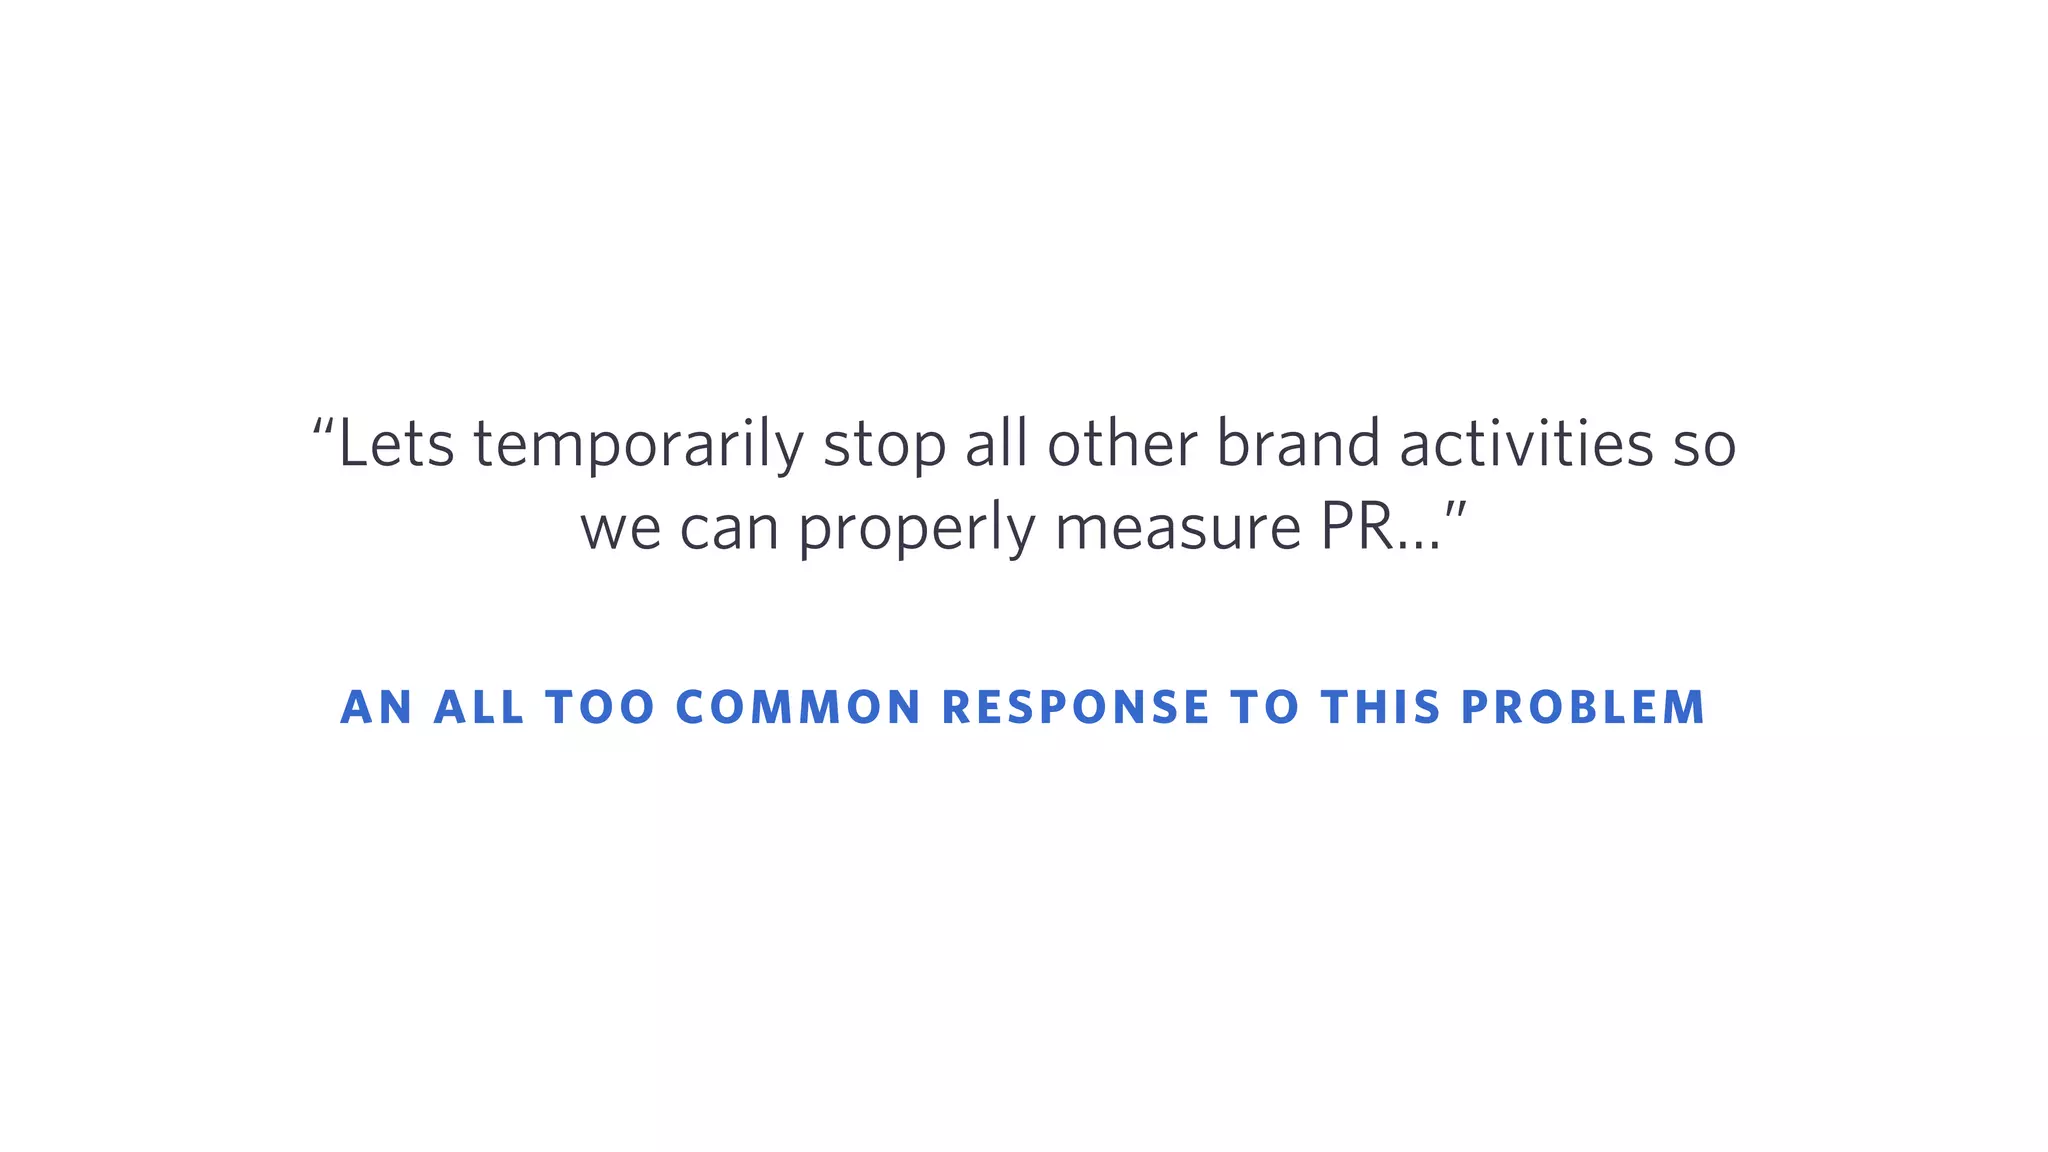


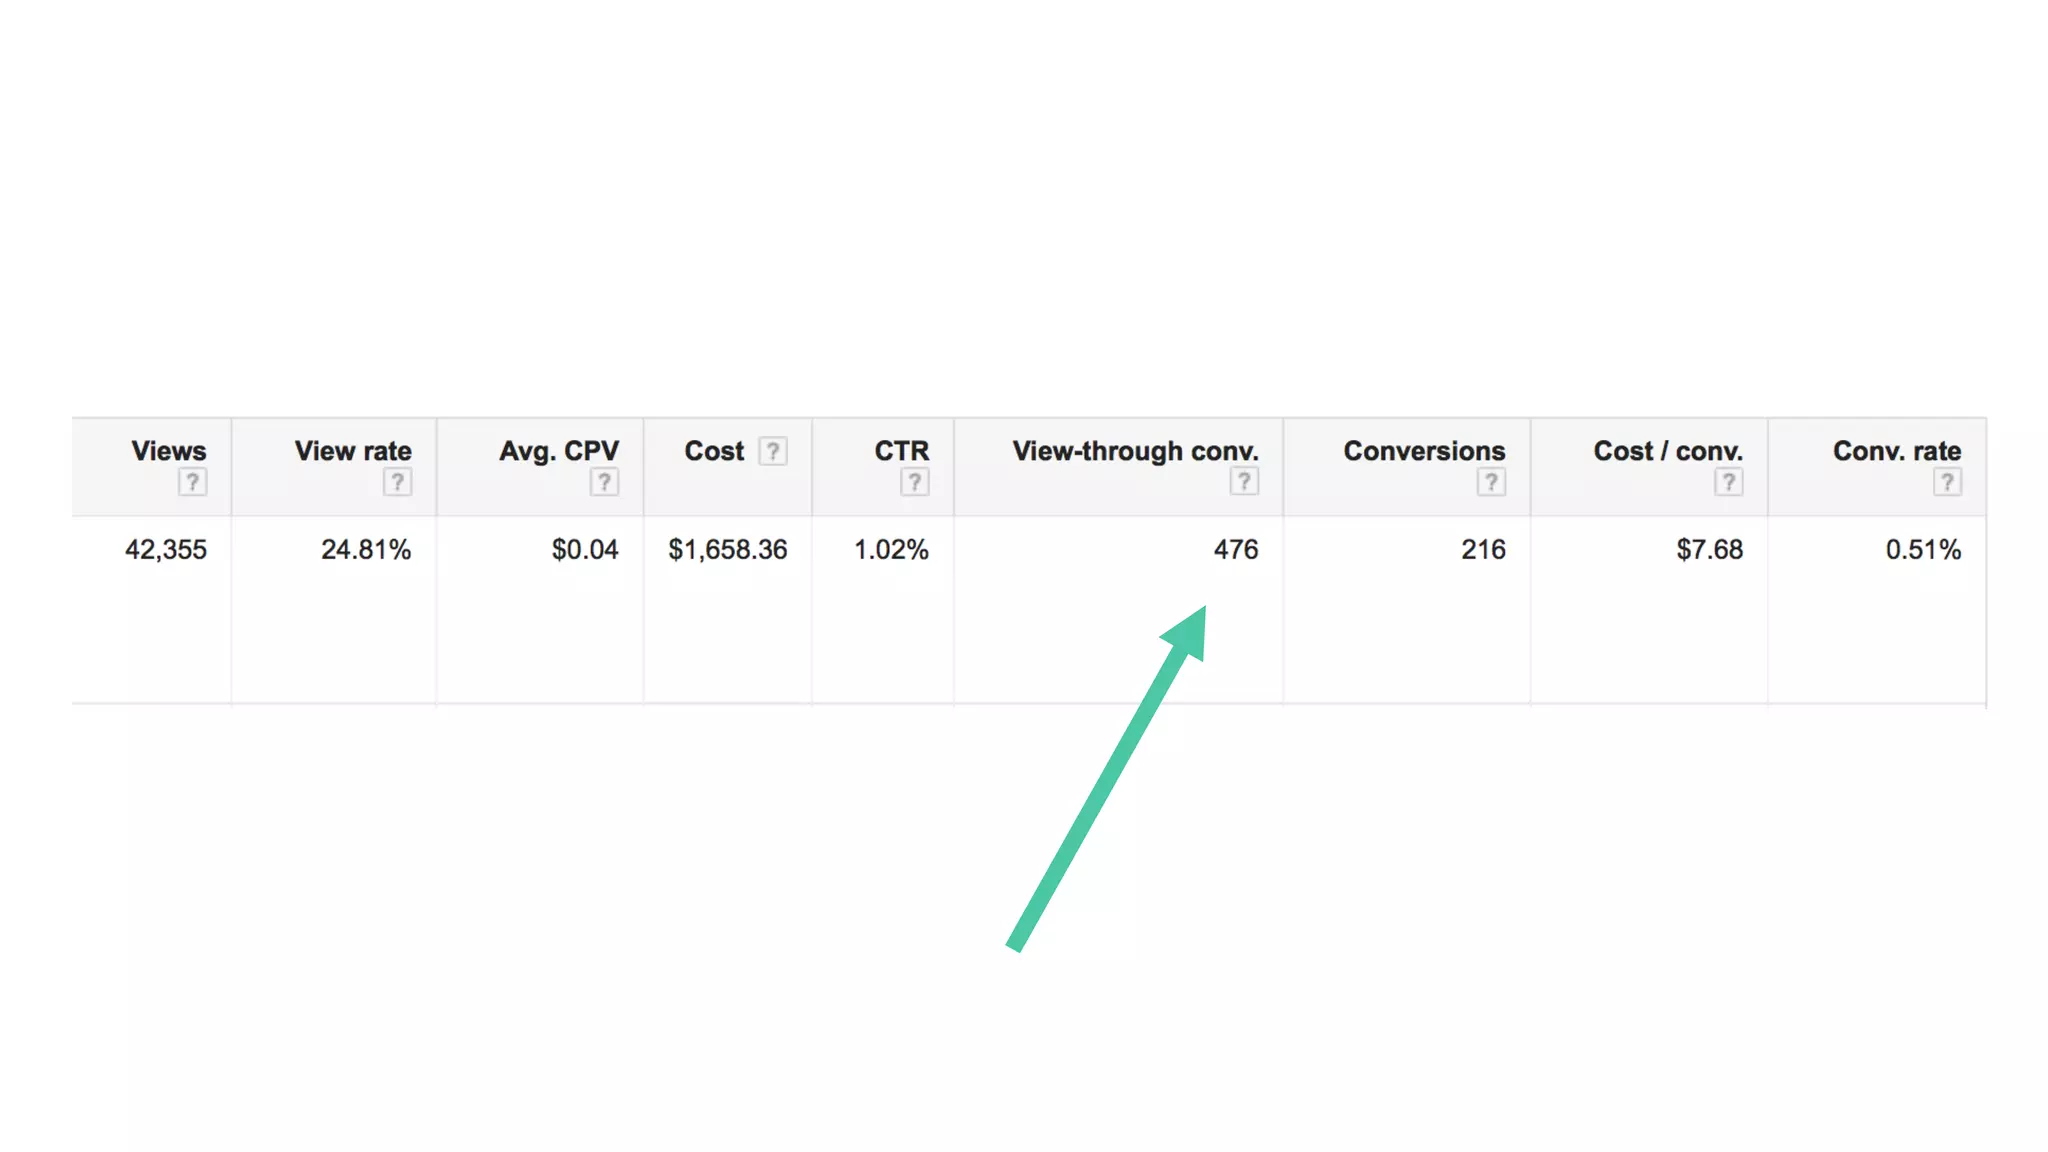


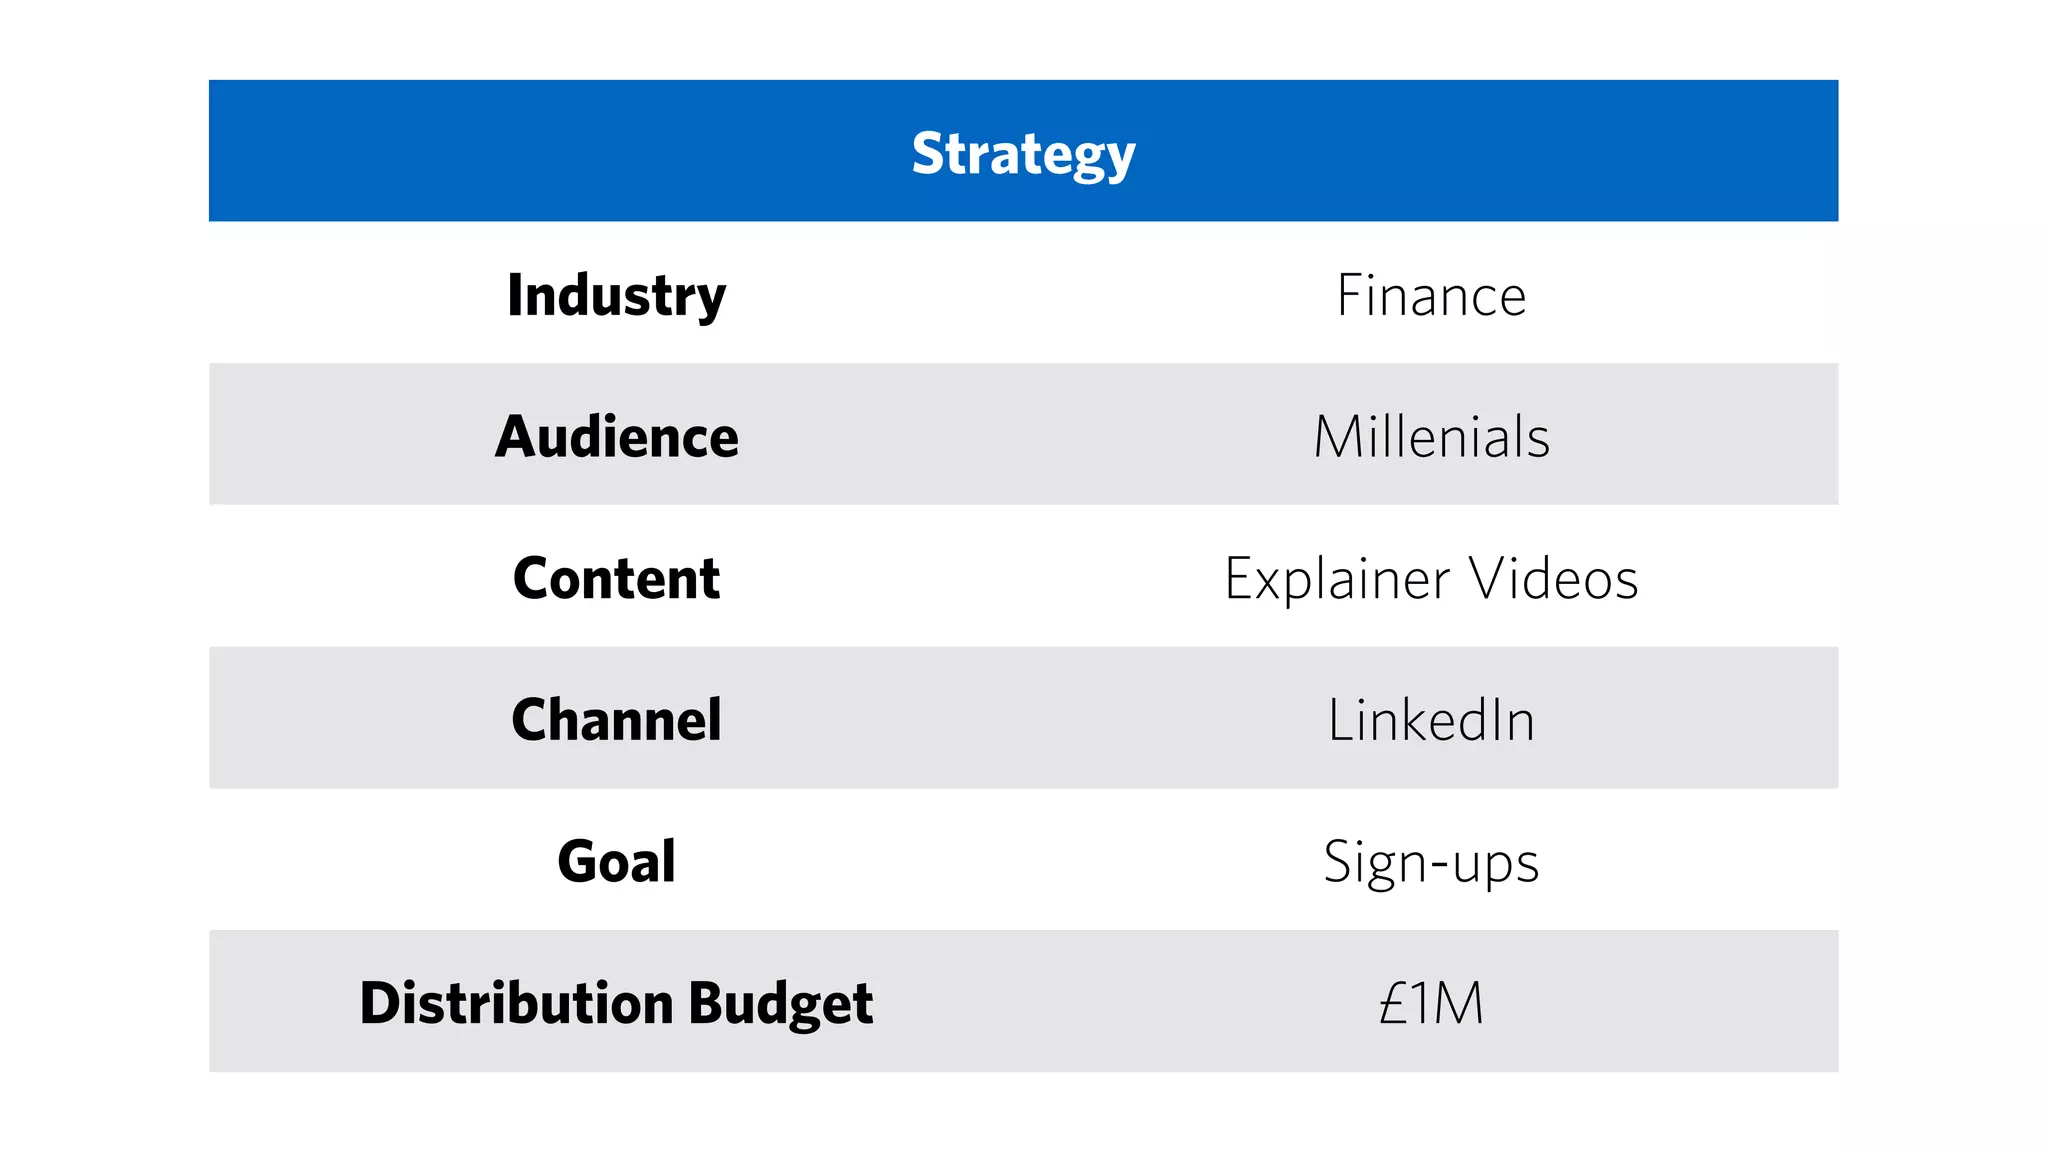


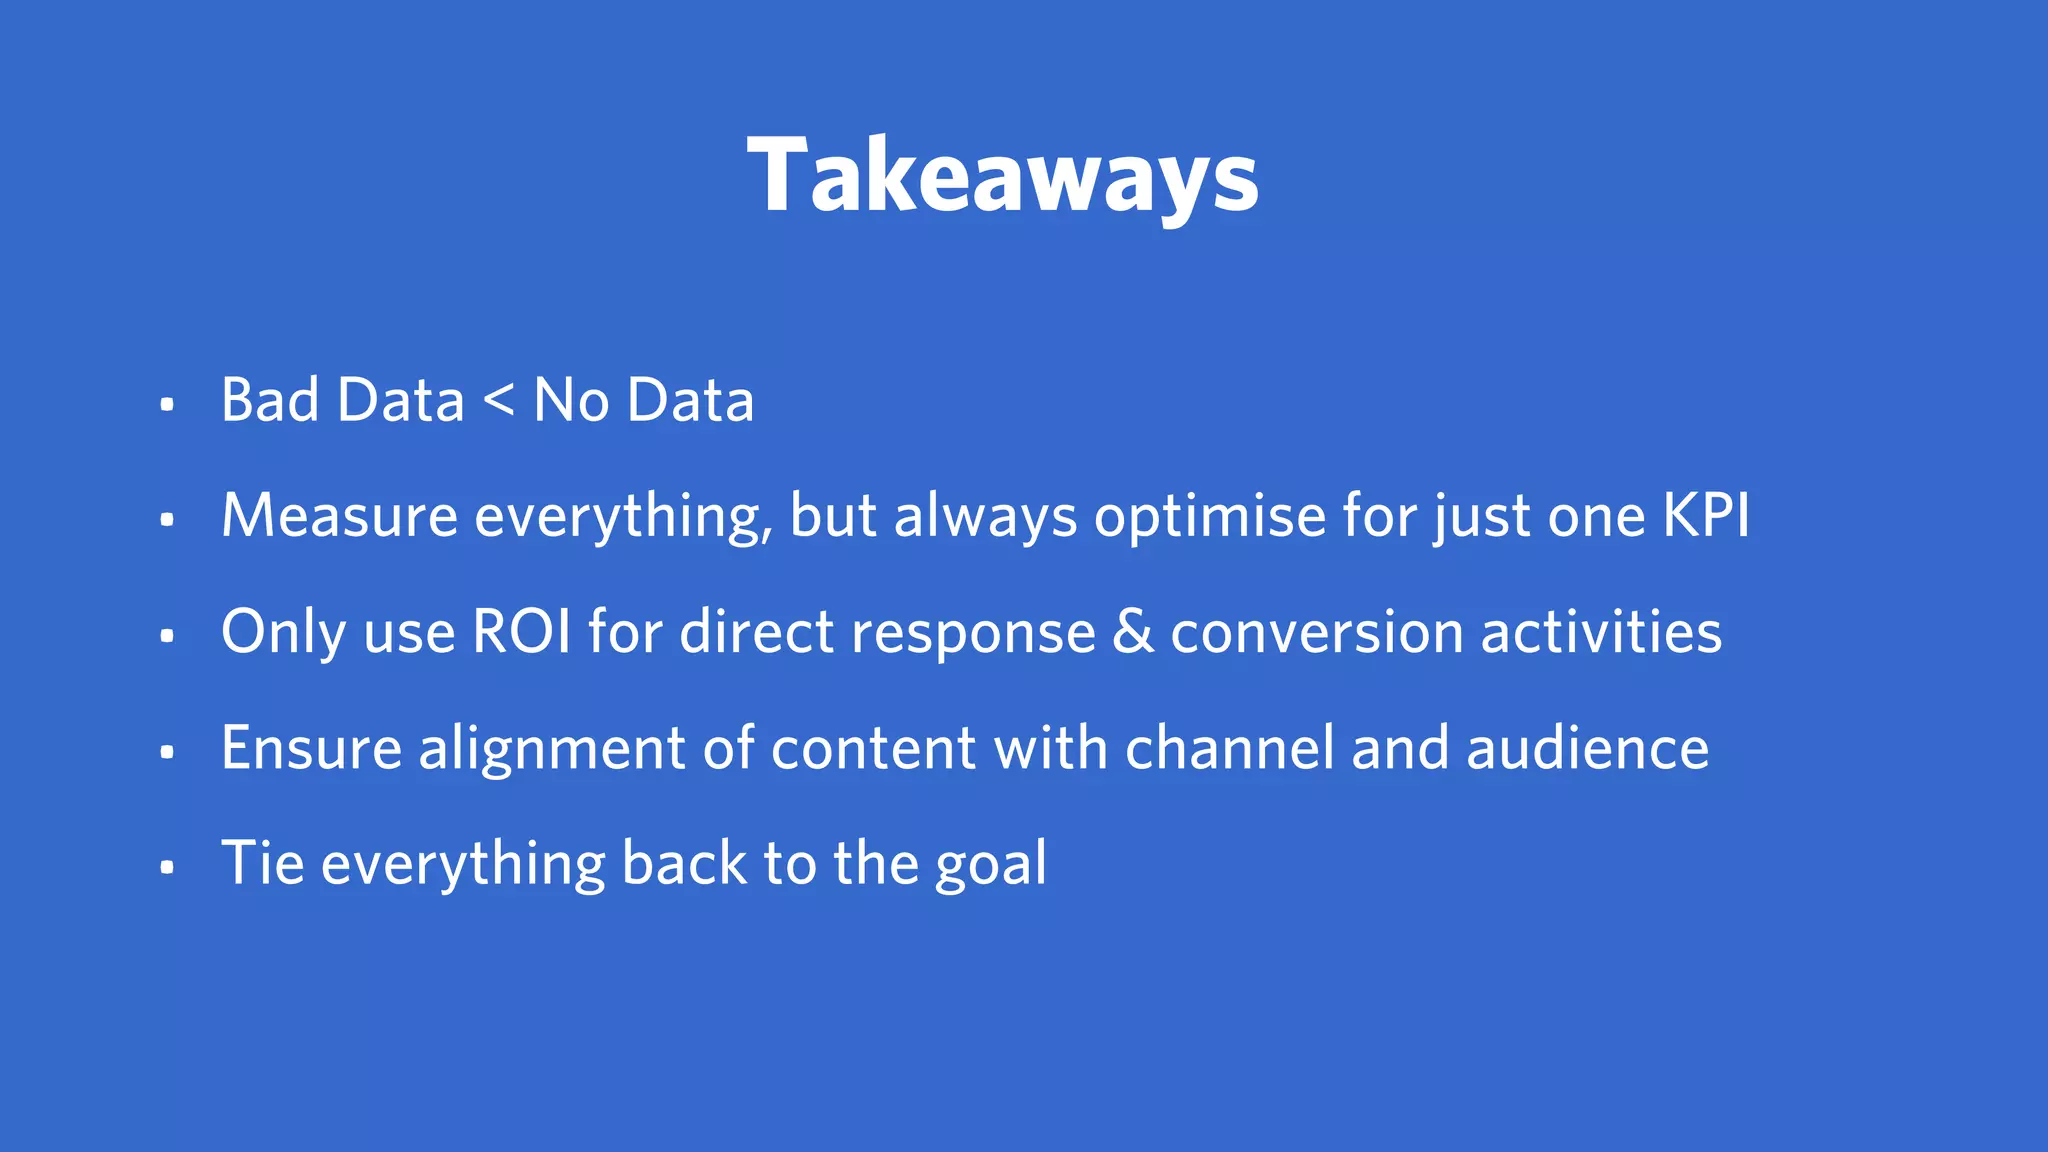


The document discusses the pitfalls of improper data interpretation in urban planning and digital marketing, highlighting how data-driven decisions can misalign with actual needs, particularly in measuring return on investment (ROI) inaccurately. It critiques the reliance on last-touch attribution and advocates for a more nuanced approach to metrics that aligns with specific goals, channels, and audiences. The author emphasizes that correct measurement practices are essential for effective marketing strategy and genuine understanding of content value.


