Background:
Anne Schippel, business banker, is analyzing Dry Supply\'s financial statements. When
calclating ratios, many commercial lenders use a ratio summary. Figure 8.5 summarizes the key
ratios as they might appear on her spreadsheet.
In reviewing the Ratio Summary and Comparative Data for Dry Supply for 12/31/20xx through
12/31/20xz, Anne Schippel has developed some questions and observations regarding the ratios.
It is now your turn to do the same.
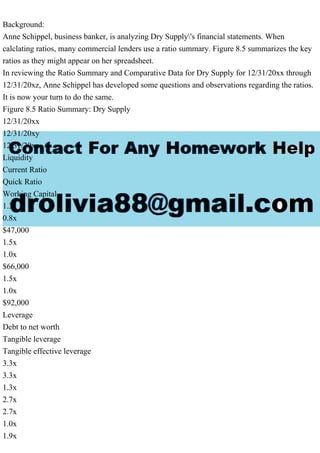
Figure 8.5 Ratio Summary: Dry Supply
12/31/20xx
12/31/20xy
12/31/20xz
Liquidity
Current Ratio
Quick Ratio
Working Capital
1.3x
0.8x
$47,000
1.5x
1.0x
$66,000
1.5x
1.0x
$92,000
Leverage
Debt to net worth
Tangible leverage
Tangible effective leverage
3.3x
3.3x
1.3x
2.7x
2.7x
1.0x
1.9x
1.9x
0.7x
Profitability
Gross profit margin
Operating profit margin
Pretax profit margin
Net Profit margin
Return-on-assets
Return-on-equity
27.9%
2.3%
2.2%
1.0%
8.2%
35.1%
28.8%
3.0%
2.8%
1.5%
10.0%
36.6%
31.3%
5.0%
4.4%
2.5%
14.8%
42.6%
Efficiency
Accounts receivable turnover
Inventory turnover
Accounts payable turnover
Sales to total assets
44.5d
41.3d
17.9d
3.4x
44.0d
39.4d
17.9d
3.4x
44.5d
38.8d
17.9d
3.4x
Coverage
Tradition cash flow coverage
Interest Coverage
Fixed charge coverage
Dividend payout ratio
n/a
4.3x
4.5x
0.0%
n/a
4.7x
4.7x
0.0%
n/a
4.6x
4.3x
0.0%
Figure 8.6 Wholesale Dry-Cleaning Equipment Industry Quartiles 20xz
Ration
Higher
Median
Lower
Current
Quick
Tangible Leverage
Pretax profit margin
Return-on-assets
Interest coverage
2.4x
1.2x
0.9x
n/a
10.7x
5.5x
1.5x
0.8x
2.5x
2.1x
3.2x
2.1x
1.2x
0.5x
5.1x
n/a
(0.3x)
1.0x
Part 1
For each of the ratios listed below, perform your own ratio analysis by stating your observation
and develop any necessary questions you would ask Dry Supply to complete your analysis.
A. Liquidity Ratios
B. Financial Leverage Ratios
C. Profitability Ratios
D. Efficiency Ratios
E. Coverage Ratios
Part 2
Using the commercial lending decision tree, Schippel deteremined that Dry Supply, as a
wholesaler, would likely show certain financial characteristics when she began to analyze the
financial statements. What are some examples of these characteristics within the ratios for 20xx
through 20 xz?
Figure 8.5 Ratio Summary: Dry Supply
12/31/20xx
12/31/20xy
12/31/20xz
Liquidity
Current Ratio
Quick Ratio
Working Capital
1.3x
0.8x
$47,000
1.5x
1.0x
$66,000
1.5x
1.0x
$92,000
Leverage
Debt to net worth
Tangible leverage
Tangible effective leverage
3.3x
3.3x
1.3x
2.7x
2.7x
1.0x
1.9x
1.9x
0.7x
Profitability
Gross profit margin
Operating profit margin
Pretax profit margin
Net Profit margin
Return-on-assets
Return-on-equity
27.9%
2.3%
2.2%
1.0%
8.2%
35.1%
28.8%
3.0%
2.8%
1.5%
10.0%
36.6%
31.3%
5.0%
4.4%
2.5%
14.8%
42.6%
Efficiency
Accounts receivable turnover
Inventory turnover
Accounts payable turnover
Sales to total assets
44.5d
41.3d
17.9d
3.4x
44.0d
39.4d
17.9d
3.4x
44.5d
38.8d
17.9d
3.4x
Coverage
Tradition cash flow coverage
Interest Coverage
Fixed charge coverage
Dividend payout ratio
n/.
BackgroundAnne Schippel, business banker, is analyzing Dry Supply.pdf
1. Background:
Anne Schippel, business banker, is analyzing Dry Supply's financial statements. When
calclating ratios, many commercial lenders use a ratio summary. Figure 8.5 summarizes the key
ratios as they might appear on her spreadsheet.
In reviewing the Ratio Summary and Comparative Data for Dry Supply for 12/31/20xx through
12/31/20xz, Anne Schippel has developed some questions and observations regarding the ratios.
It is now your turn to do the same.
Figure 8.5 Ratio Summary: Dry Supply
12/31/20xx
12/31/20xy
12/31/20xz
Liquidity
Current Ratio
Quick Ratio
Working Capital
1.3x
0.8x
$47,000
1.5x
1.0x
$66,000
1.5x
1.0x
$92,000
Leverage
Debt to net worth
Tangible leverage
Tangible effective leverage
3.3x
3.3x
1.3x
2.7x
2.7x
1.0x
1.9x
4. 2.4x
1.2x
0.9x
n/a
10.7x
5.5x
1.5x
0.8x
2.5x
2.1x
3.2x
2.1x
1.2x
0.5x
5.1x
n/a
(0.3x)
1.0x
Part 1
For each of the ratios listed below, perform your own ratio analysis by stating your observation
and develop any necessary questions you would ask Dry Supply to complete your analysis.
A. Liquidity Ratios
B. Financial Leverage Ratios
C. Profitability Ratios
D. Efficiency Ratios
E. Coverage Ratios
Part 2
Using the commercial lending decision tree, Schippel deteremined that Dry Supply, as a
wholesaler, would likely show certain financial characteristics when she began to analyze the
financial statements. What are some examples of these characteristics within the ratios for 20xx
through 20 xz?
Figure 8.5 Ratio Summary: Dry Supply
12/31/20xx
12/31/20xy
12/31/20xz
Liquidity
5. Current Ratio
Quick Ratio
Working Capital
1.3x
0.8x
$47,000
1.5x
1.0x
$66,000
1.5x
1.0x
$92,000
Leverage
Debt to net worth
Tangible leverage
Tangible effective leverage
3.3x
3.3x
1.3x
2.7x
2.7x
1.0x
1.9x
1.9x
0.7x
Profitability
Gross profit margin
Operating profit margin
Pretax profit margin
Net Profit margin
Return-on-assets
Return-on-equity
27.9%
2.3%
2.2%
1.0%
7. n/a
4.3x
4.5x
0.0%
n/a
4.7x
4.7x
0.0%
n/a
4.6x
4.3x
0.0%
Solution
A. Liquidity ratios have improved from 20xx to 20xy which means Dry Supply had increased
Current Assets1 (mainly cash and receivables) as can be seen in the Quick ratio2 improvement.
This means that either the current liabilities decreased or current assets increased. Since working
capital has increased it is safe to say that current assets increased. But ratios remained same in
20xz which indicate that current liabilities also increased.
1Current Assets = cash, bank, stock, investments, sundry debtors (net), bills receivable and
prepaid exps
2Quick ratio = {Current assets - (Stock and prepaid exps)} / Current Liabilities. Basically liquid
assets are those which can be converted to cash immediately.
---------------------------------
B. Leverage ratios assess how much capital is derived from debts of the business. for example; A
healthy debt ratio is 2:1 which means the business capital comprises of $200 of debt and $100 of
equity.
Dry supply leverage ratios have reduced over the 3 years indicating debt has reduced and equity
increased in their capital structure.
---------------------------
C. Profitability ratios simply indicate the how well the business is earning in terms of profits.
Here it can be easily determined that Net profit and gross profits have increased implying the
business revenue increased and/or costs reduced.
-----------------------------
D. Efficiency ratios indicate how well the debtors and creditors are being managed. If debt
8. collection is good and fast then the days will decrease and vice versa for payables where ideally
business hould aim to pay out as late as possible without adversely affecting relations or paying
interest. Here all ratios have been the same except for Inventory turnover.
Here the ratio indicates that average inventory was sold every 38.8 days in 20xz which is a slight
improvement from 41.3 days in 20xx.