SlideShare a Scribd company logo
1 of 9
Download to read offline
Building permits, January 2020
Released at 8:30 a.m. Eastern time in The Daily, Monday, March 9, 2020
The total value of building permits issued by Canadian municipalities increased 4.0% to $9.2 billion in January.
Increases were reported in six provinces, led by British Columbia (+52.1% to $2.2 billion).
For more information on housing, please visit the Housing Statistics Portal.
Chart 1
Total value of building permits
billions of dollars
5.0
5.5
6.0
6.5
7.0
7.5
8.0
8.5
9.0
9.5
10.0
10.5
11.0
Jan.
2015 2016 2017 2018 2019
Jan.
2020
Seasonally adjusted Trend-cycle
Note(s): The higher variability associated with the trend-cycle estimates is indicated with a dotted line on the chart for the current reference month and the three
previous months. For more information, see the note to readers.
Source(s): Table 34-10-0066-01.
The Daily, Monday, March 9, 2020
Component of Statistics Canada catalogue no. 11-001-X2
Chart 2
Value of building permits for the residential and non-residential sectors
billions of dollars
1.0
1.5
2.0
2.5
3.0
3.5
4.0
4.5
5.0
5.5
6.0
6.5
Jan.
2015 2016 2017 2018 2019
Jan.
2020
Residential, seasonally adjusted Residential, trend-cycle
Non-residential, seasonally adjusted Non-residential, trend-cycle
Note(s): The higher variability associated with the trend-cycle estimates is indicated with a dotted line on the chart for the current reference month and the three
previous months. For more information, see the note to readers.
Source(s): Table 34-10-0066-01.
The Daily, Monday, March 9, 2020
Component of Statistics Canada catalogue no. 11-001-X 3
Infographic 1 –  Building permits, January 2020
The Daily, Monday, March 9, 2020
Component of Statistics Canada catalogue no. 11-001-X4
Change in Vancouver's development costs drives growth in British Columbia and
nationally
The majority of January's national increase in the value of building permits was in British Columbia (+$751 million),
largely due to the census metropolitan area (CMA) of Vancouver. The value of permits increased in the CMA of
Vancouver by 81.8%, prior to increases in development fees, which came into effect on January 15. Meanwhile,
Quebec (-$366 million) and Ontario (-$161 million) reported the largest provincial declines after strong activity in
December 2019.
Chart 3
Month-to-month change in the value of residential building permits
Canada
Newfoundland and Labrador
Prince Edward Island
Nova Scotia
New Brunswick
Quebec
Ontario
Manitoba
Saskatchewan
Alberta
British Columbia
Yukon
Northwest Territories
Nunavut
-200 0 200 400 600 800
millions of dollars
Single-family dwellings Multi-family dwellings
Source(s): Table 34-10-0066-01.
Value of residential permits up for multi- and single-family dwellings
The residential sector reported strong gains in January, increasing 12.7% from December 2019 to $5.8 billion.
Permits for multi-family dwellings were up 17.1% to $3.4 billion in January, largely due to multiple projects in the
CMA of Vancouver.
The total value of permits for single-family dwellings increased 7.0% to $2.4 billion, mainly due to housing
developments in Ontario (+$105 million) and Quebec (+$48 million). The CMA of Brantford reported the largest
increase in the value of permits for single-family dwellings (+340.9% to $41 million), a record high for the CMA.
The Daily, Monday, March 9, 2020
Component of Statistics Canada catalogue no. 11-001-X 5
Chart 4
Month-to-month change in the value of non-residential building permits
Canada
Newfoundland and Labrador
Prince Edward Island
Nova Scotia
New Brunswick
Quebec
Ontario
Manitoba
Saskatchewan
Alberta
British Columbia
Yukon
Northwest Territories
Nunavut
-600 -400 -200 0 200 400
millions of dollars
Industrial Commercial
Institutional
Source(s): Table 34-10-0066-01.
Non-residential sector down due to institutional permits
The value of non-residential permits was down 7.8% to $3.5 billion in January. This decrease was largely due to a
decline in the total value of institutional permits (-30.5% to $732 million) following strong gains in December 2019.
Despite increases in seven provinces, the value of commercial permits decreased 0.8% to $2.1 billion, with Quebec
reporting the largest decline (-$249 million).
The value of industrial permits offset some of the non-residential decline, rising 6.8% to $682 million, led by Ontario
(+$90 million).
The Daily, Monday, March 9, 2020
Component of Statistics Canada catalogue no. 11-001-X6
Note to readers
Unless otherwise stated, this release presents seasonally adjusted data, which facilitate month-to-month comparisons by removing the
effects of seasonal variations. For information on seasonal adjustment, see Seasonally adjusted data – Frequently asked questions.
The Building Permits Survey covers over 2,400 municipalities, representing 95% of the Canadian population. The communities
representing the other 5% of the population are very small, and their levels of building activity have little impact on the total for the entire
population.
Building permit data are used as a leading indicator of activity in the construction industry.
The value of planned construction activities presented in this release excludes engineering projects (such as waterworks, sewers or
culverts) and land.
For the purposes of this release, the census metropolitan area of Ottawa–Gatineau (Ontario and Quebec) is divided into two areas: the
Ottawa part and the Gatineau part.
Unless otherwise specified, the highlights refer to seasonally adjusted current dollars and are ranked in terms of dollar change rather than
percentage change.
Building components
Single-family dwellings: Residential buildings containing only one dwelling unit (for example, single-detached house, bungalow, linked
home [linked at the foundation]).
Multi-family dwellings: Residential buildings containing multiple dwelling units (for example, apartment, apartment condominium, row
house, semi-detached).
Industrial buildings: Buildings used in the processing or production of goods, or related to transportation and communication.
Commercial buildings: Buildings used in the trade or distribution of goods and services.
Institutional and government buildings: Buildings used to house public and semi-public services, such as those related to health and
welfare, education, or public administration, as well as buildings used for religious services.
Revision
Unadjusted data for the current reference month are subject to revision based on late responses. Data for the previous month have been
revised. Seasonally adjusted data for the previous two months have also been revised.
Trend-cycle estimates have been added to the charts as a complement to the seasonally adjusted series. Both seasonally adjusted data
and trend-cycle estimates are subject to revision as additional observations become available. These revisions could be large and could
even lead to a reversal of movement, especially at the end of the series. The higher variability associated with trend-cycle estimates is
indicated with a dotted line on the chart.
For information on trend-cycle data, see the StatCan Blog and Trend-cycle estimates – Frequently asked questions.
Next release
Data on building permits for February will be released on April 8.
The Daily, Monday, March 9, 2020
Component of Statistics Canada catalogue no. 11-001-X 7
Table 1
Dwelling units, value of residential and non-residential building permits, Canada – Seasonally
adjusted
January
2019
November
2019r
December
2019r
January
2020p
December
2019 to
January 2020
January 2019
to January
2020
millions of dollars % change
Total 8,318.1 8,087.3 8,887.7 9,245.7 4.0 11.2
Residential 5,329.3 4,749.4 5,128.2 5,780.1 12.7 8.5
Single1 2,068.2 2,246.2 2,214.4 2,369.5 7.0 14.6
Multiple 3,261.2 2,503.2 2,913.8 3,410.6 17.1 4.6
Non-residential 2,988.8 3,337.9 3,759.5 3,465.6 -7.8 16.0
Industrial 593.1 738.7 638.5 682.0 6.8 15.0
Commercial 1,793.6 1,695.1 2,066.9 2,051.4 -0.8 14.4
Institutional 602.1 904.0 1,054.1 732.2 -30.5 21.6
number of units % change
Total dwellings 21,025 18,410 19,037 22,143 16.3 5.3
Single1 4,455 4,958 4,825 5,437 12.7 22.0
Multiple 16,570 13,451 14,211 16,707 17.6 0.8
r revised
p preliminary
1. Included in this category are the following types of dwellings: single-detached, mobile home and cottage.
Note(s): Data may not add up to totals as a result of rounding.
Source(s): Table 34-10-0066-01.
The Daily, Monday, March 9, 2020
Component of Statistics Canada catalogue no. 11-001-X8
Table 2
Value of building permits, by province and territory – Seasonally adjusted
January
2019
November
2019r
December
2019r
January
2020p
December
2019 to
January 2020
January 2019
to January
2020
millions of dollars % change
Canada 8,318.1 8,087.3 8,887.7 9,245.7 4.0 11.2
Residential 5,329.3 4,749.4 5,128.2 5,780.1 12.7 8.5
Non-residential 2,988.8 3,337.9 3,759.5 3,465.6 -7.8 16.0
Newfoundland and Labrador 39.8 56.9 48.8 76.9 57.6 93.0
Residential 18.2 19.9 17.8 17.0 -4.7 -6.5
Non-residential 21.7 37.0 31.0 59.9 93.4 1,137.9
Prince Edward Island 19.7 33.2 24.4 22.3 -8.5 13.2
Residential 17.8 26.6 20.3 17.9 -11.9 0.1
Non-residential 1.9 6.5 4.1 4.5 8.4 136.1
Nova Scotia 174.4 135.5 114.6 132.7 15.9 -23.9
Residential 145.5 90.3 81.9 92.8 13.3 -36.2
Non-residential 28.8 45.2 32.6 39.9 22.3 38.4
New Brunswick 98.4 73.9 90.8 63.3 -30.3 -35.7
Residential 38.7 31.3 39.9 38.2 -4.3 -1.3
Non-residential 59.7 42.6 50.9 25.1 -50.7 -58.0
Quebec 1,629.7 1,905.4 2,233.0 1,866.9 -16.4 14.6
Residential 930.2 916.3 1,150.2 1,138.3 -1.0 22.4
Non-residential 699.5 989.1 1,082.8 728.6 -32.7 4.2
Ontario 3,387.3 3,113.1 3,595.0 3,433.5 -4.5 1.4
Residential 2,211.0 1,951.4 1,931.2 2,024.3 4.8 -8.4
Non-residential 1,176.3 1,161.6 1,663.8 1,409.2 -15.3 19.8
Manitoba 265.5 286.2 219.2 270.9 23.6 2.1
Residential 144.0 145.8 92.6 108.9 17.6 -24.4
Non-residential 121.4 140.3 126.5 162.0 28.1 33.4
Saskatchewan 167.5 122.1 104.3 133.7 28.2 -20.2
Residential 90.6 47.0 54.7 62.7 14.7 -30.8
Non-residential 76.9 75.1 49.6 71.0 43.2 -7.7
Alberta 942.7 1,005.7 1,010.8 1,035.3 2.4 9.8
Residential 562.6 605.1 616.5 607.4 -1.5 8.0
Non-residential 380.0 400.6 394.3 427.8 8.5 12.6
British Columbia 1,566.7 1,329.8 1,440.1 2,190.7 52.1 39.8
Residential 1,147.9 901.1 1,117.1 1,668.5 49.4 45.4
Non-residential 418.8 428.6 323.0 522.2 61.7 24.7
Yukon 4.2 3.9 3.2 17.9 453.9 324.4
Residential 3.2 3.3 2.8 2.7 -4.6 -15.8
Non-residential 1.1 0.6 0.4 15.3 ... ...
Northwest Territories 1.1 5.6 3.3 1.2 -64.0 12.3
Residential 0.9 3.5 2.9 1.1 -61.9 28.8
Non-residential 0.2 2.1 0.4 0.1 -81.4 -63.8
Nunavut F 16.0 0.2 F F F
Residential F 7.7 0.2 F F F
Non-residential F 8.3 0.0 0.0 ... F
r revised
p preliminary
... not applicable
F too unreliable to be published
Note(s): Data may not add up to totals as a result of rounding.
Source(s): Table 34-10-0066-01.
The Daily, Monday, March 9, 2020
Component of Statistics Canada catalogue no. 11-001-X 9
Table 3
Value of building permits, by census metropolitan area – Seasonally adjusted1
January
2019
November
2019r
December
2019r
January
2020p
December
2019 to
January 2020
January 2019
to January
2020
millions of dollars % change
Total, census metropolitan areas 6,384.6 5,948.2 7,018.9 6,979.6 -0.6 9.3
St. John's 16.9 45.8 39.5 16.2 -59.0 -4.4
Halifax 123.2 74.8 69.6 87.9 26.3 -28.7
Moncton 23.4 28.8 27.7 21.4 -22.7 -8.6
Saint John 14.2 13.3 12.1 12.4 2.6 -12.4
Saguenay 16.8 20.0 106.6 22.5 -78.9 34.0
Québec 170.0 246.0 148.2 195.9 32.2 15.3
Sherbrooke 33.1 51.7 61.9 126.2 103.8 281.1
Trois-Rivières 34.3 18.8 25.5 22.9 -10.3 -33.2
Montréal 858.8 973.2 1,320.7 934.6 -29.2 8.8
Ottawa–Gatineau, Ontario and Quebec 362.2 390.7 345.6 384.8 11.3 6.2
Gatineau part 90.7 112.4 59.1 46.2 -21.7 -49.0
Ottawa part 271.4 278.4 286.5 338.5 18.2 24.7
Kingston 17.6 14.9 10.9 26.4 141.4 50.2
Belleville 11.0 16.7 8.0 11.8 47.0 7.3
Peterborough 18.8 2.8 35.6 41.7 1,062.7 121.1
Oshawa 43.7 57.0 34.8 94.0 170.0 115.1
Toronto 1,763.9 1,283.1 1,929.6 1,524.3 -21.0 -13.6
Hamilton 165.2 105.6 191.0 118.4 -38.0 -28.3
St. Catharines–Niagara 61.5 94.5 114.7 69.5 -39.4 13.2
Kitchener–Cambridge–Waterloo 170.5 218.6 98.8 150.1 51.8 -12.0
Brantford 19.1 30.9 14.5 51.3 254.3 168.7
Guelph 66.9 25.0 65.2 22.3 -65.8 -66.7
London 74.6 140.7 126.0 107.2 -14.9 43.7
Windsor 34.3 91.8 57.1 63.4 11.1 84.6
Barrie 19.3 25.5 18.9 69.4 266.5 260.6
Greater Sudbury 28.2 20.4 17.6 24.2 37.7 -14.1
Thunder Bay 5.3 8.1 4.3 9.7 123.0 81.6
Winnipeg 192.4 218.3 160.7 174.9 8.9 -9.1
Regina 32.9 45.8 30.7 44.8 46.1 36.3
Saskatoon 73.3 51.5 45.9 61.3 33.7 -16.3
Lethbridge 21.4 17.4 26.0 23.8 -8.4 11.1
Calgary 413.3 455.2 477.1 450.7 -5.5 9.0
Edmonton 278.1 274.5 345.8 332.4 -3.9 19.5
Kelowna 80.0 84.2 88.3 82.5 -6.6 3.1
Abbotsford–Mission 36.7 70.9 34.6 25.6 -26.0 -30.2
Vancouver 1,000.0 641.9 811.2 1,475.2 81.8 47.5
Victoria 103.5 89.8 114.2 99.8 -12.7 -3.7
r revised
p preliminary
1. Go online to view the census subdivisions that make up the census metropolitan areas.
Note(s): Data may not add up to totals as a result of rounding.
Source(s): Table 34-10-0066-01.
Available tables: table 34-10-0066-01.
Definitions, data sources and methods: survey number 2802.
For more information, or to enquire about the concepts, methods or data quality of this release, contact us
(toll-free 1-800-263-1136; 514-283-8300; STATCAN.infostats-infostats.STATCAN@canada.ca) or Media
Relations (613-951-4636; STATCAN.mediahotline-ligneinfomedias.STATCAN@canada.ca).

More Related Content

What's hot

energyfutureholdings TXUQ102Pack
energyfutureholdings TXUQ102Packenergyfutureholdings TXUQ102Pack
energyfutureholdings TXUQ102Pack
finance29
 
southern 2003 1st
southern 2003 1stsouthern 2003 1st
southern 2003 1st
finance17
 
Houston Economy at a Glance
Houston Economy at a GlanceHouston Economy at a Glance
Houston Economy at a Glance
Dan Hutchins
 
9 7 12weekly
9 7 12weekly9 7 12weekly
9 7 12weekly
bobsanto
 

What's hot (20)

EY Price Point: Global oil and gas market outlook - 1Q19
EY Price Point: Global oil and gas market outlook - 1Q19EY Price Point: Global oil and gas market outlook - 1Q19
EY Price Point: Global oil and gas market outlook - 1Q19
 
energyfutureholdings TXUQ102Pack
energyfutureholdings TXUQ102Packenergyfutureholdings TXUQ102Pack
energyfutureholdings TXUQ102Pack
 
Economy and equity markets: are they disconnected?
Economy and equity markets: are they disconnected?Economy and equity markets: are they disconnected?
Economy and equity markets: are they disconnected?
 
southern 2003 1st
southern 2003 1stsouthern 2003 1st
southern 2003 1st
 
Impacts and implications_of_covid-19_for_the_energy_industry
Impacts and implications_of_covid-19_for_the_energy_industryImpacts and implications_of_covid-19_for_the_energy_industry
Impacts and implications_of_covid-19_for_the_energy_industry
 
איגוד התעשיות לאנרגיה סולארית האמריקאי - נתוני רבעון ראשון 2011
איגוד התעשיות לאנרגיה סולארית האמריקאי - נתוני רבעון ראשון 2011  איגוד התעשיות לאנרגיה סולארית האמריקאי - נתוני רבעון ראשון 2011
איגוד התעשיות לאנרגיה סולארית האמריקאי - נתוני רבעון ראשון 2011
 
Global and-spanish economic perspectives Q3 2021 Quarterly Report December 2021
Global and-spanish economic perspectives Q3 2021 Quarterly Report December 2021Global and-spanish economic perspectives Q3 2021 Quarterly Report December 2021
Global and-spanish economic perspectives Q3 2021 Quarterly Report December 2021
 
2019 Energy Outlook
2019 Energy Outlook2019 Energy Outlook
2019 Energy Outlook
 
Macroeconomic Developments Report. September 2021
Macroeconomic Developments Report. September 2021Macroeconomic Developments Report. September 2021
Macroeconomic Developments Report. September 2021
 
Inflation for 2020 was the lowest in 16 years and the second lowest in 51 years
Inflation for 2020 was the lowest in 16 years and the second lowest in 51 yearsInflation for 2020 was the lowest in 16 years and the second lowest in 51 years
Inflation for 2020 was the lowest in 16 years and the second lowest in 51 years
 
Global and Spanish economic perspectives Q2 2021
Global and Spanish economic perspectives Q2 2021Global and Spanish economic perspectives Q2 2021
Global and Spanish economic perspectives Q2 2021
 
Aerospace and electronics cost index July 2010
Aerospace and electronics cost index July 2010Aerospace and electronics cost index July 2010
Aerospace and electronics cost index July 2010
 
Economy... at a glance May 2020
Economy... at a glance May 2020Economy... at a glance May 2020
Economy... at a glance May 2020
 
2019 Santa Clara County Construction Forecast
2019 Santa Clara County Construction Forecast2019 Santa Clara County Construction Forecast
2019 Santa Clara County Construction Forecast
 
Así está the economy jun 2017 Círculo de Empresarios
Así está the economy jun 2017 Círculo de EmpresariosAsí está the economy jun 2017 Círculo de Empresarios
Así está the economy jun 2017 Círculo de Empresarios
 
Economy... at a glance September 2019
Economy... at a glance September 2019Economy... at a glance September 2019
Economy... at a glance September 2019
 
St. Louis Office Outlook Q2 2016
St. Louis Office Outlook Q2 2016St. Louis Office Outlook Q2 2016
St. Louis Office Outlook Q2 2016
 
Outlook for Energy and Minerals Markets - for the 116th Congress
Outlook for Energy and Minerals Markets - for the 116th CongressOutlook for Energy and Minerals Markets - for the 116th Congress
Outlook for Energy and Minerals Markets - for the 116th Congress
 
Houston Economy at a Glance
Houston Economy at a GlanceHouston Economy at a Glance
Houston Economy at a Glance
 
9 7 12weekly
9 7 12weekly9 7 12weekly
9 7 12weekly
 

Similar to Building Permits and Construction - Canada - January 2020

Similar to Building Permits and Construction - Canada - January 2020 (20)

Business transition - the big picture
Business transition - the big pictureBusiness transition - the big picture
Business transition - the big picture
 
Simplify Markets Q1 2020
Simplify Markets Q1 2020Simplify Markets Q1 2020
Simplify Markets Q1 2020
 
Key Macro and Micro Indicators| Canada and USA| August 2020 and September 2020
Key Macro and Micro Indicators| Canada and USA| August 2020 and September 2020 Key Macro and Micro Indicators| Canada and USA| August 2020 and September 2020
Key Macro and Micro Indicators| Canada and USA| August 2020 and September 2020
 
Power transactions and trends Q1 2019
Power transactions and trends Q1 2019Power transactions and trends Q1 2019
Power transactions and trends Q1 2019
 
May Business Lunch
May Business LunchMay Business Lunch
May Business Lunch
 
Country Report > Aumento de la insolvencia en la zona NAFTA
Country Report > Aumento de la insolvencia en la zona NAFTACountry Report > Aumento de la insolvencia en la zona NAFTA
Country Report > Aumento de la insolvencia en la zona NAFTA
 
Canada GDP – August 2016
Canada GDP – August 2016Canada GDP – August 2016
Canada GDP – August 2016
 
Ontario economy – June 2017
Ontario economy – June 2017Ontario economy – June 2017
Ontario economy – June 2017
 
LBS Economic Research and Strategy - Canada Real GDP Q2-2017
LBS Economic Research and Strategy - Canada Real GDP Q2-2017LBS Economic Research and Strategy - Canada Real GDP Q2-2017
LBS Economic Research and Strategy - Canada Real GDP Q2-2017
 
EY Power transactions and trends: Q2 2018
EY Power transactions and trends: Q2 2018EY Power transactions and trends: Q2 2018
EY Power transactions and trends: Q2 2018
 
Cost trends - Construction Strategies
Cost trends - Construction StrategiesCost trends - Construction Strategies
Cost trends - Construction Strategies
 
September 2016 Gross Domestic Product (gdp) - Canada
September 2016 Gross Domestic Product (gdp) - Canada September 2016 Gross Domestic Product (gdp) - Canada
September 2016 Gross Domestic Product (gdp) - Canada
 
North American Commercial Real Estate Report
North American Commercial Real Estate ReportNorth American Commercial Real Estate Report
North American Commercial Real Estate Report
 
2015 2Q North American Office Market Report
2015 2Q North American Office Market Report2015 2Q North American Office Market Report
2015 2Q North American Office Market Report
 
Arbor US Economic Overview 2018 q2
Arbor US Economic Overview 2018 q2Arbor US Economic Overview 2018 q2
Arbor US Economic Overview 2018 q2
 
Whitepaper: Latin America: Room for growth
Whitepaper: Latin America: Room for growthWhitepaper: Latin America: Room for growth
Whitepaper: Latin America: Room for growth
 
Real Estate - Canada - January 2018
Real Estate -  Canada - January 2018Real Estate -  Canada - January 2018
Real Estate - Canada - January 2018
 
Laurentian Bank Securities - Economic Research and Strategy
Laurentian Bank Securities - Economic Research and Strategy Laurentian Bank Securities - Economic Research and Strategy
Laurentian Bank Securities - Economic Research and Strategy
 
LBS Economic Research and Strategy
LBS   Economic Research and StrategyLBS   Economic Research and Strategy
LBS Economic Research and Strategy
 
LBS - Economic Research and Strategy
LBS - Economic Research and StrategyLBS - Economic Research and Strategy
LBS - Economic Research and Strategy
 

More from paul young cpa, cga

Global Housing Market Analysis and Commentary- September 2023.pptx
Global Housing Market Analysis and Commentary- September 2023.pptxGlobal Housing Market Analysis and Commentary- September 2023.pptx
Global Housing Market Analysis and Commentary- September 2023.pptx
paul young cpa, cga
 
What is next for the Mining Sector.pptx
What is next for the Mining Sector.pptxWhat is next for the Mining Sector.pptx
What is next for the Mining Sector.pptx
paul young cpa, cga
 
Manufacturing Sector – United States – August 2023.pptx
Manufacturing Sector – United States – August 2023.pptxManufacturing Sector – United States – August 2023.pptx
Manufacturing Sector – United States – August 2023.pptx
paul young cpa, cga
 
Stock Market Analysis and Commentary for WE September 15 2023.pptx
Stock Market Analysis and Commentary for WE September 15 2023.pptxStock Market Analysis and Commentary for WE September 15 2023.pptx
Stock Market Analysis and Commentary for WE September 15 2023.pptx
paul young cpa, cga
 
Electricity Analysis - Canada and the OECD - June 2023.pptx
Electricity Analysis - Canada and the OECD - June 2023.pptxElectricity Analysis - Canada and the OECD - June 2023.pptx
Electricity Analysis - Canada and the OECD - June 2023.pptx
paul young cpa, cga
 
World Merchandise Trade – September 2023.pptx
World Merchandise Trade – September 2023.pptxWorld Merchandise Trade – September 2023.pptx
World Merchandise Trade – September 2023.pptx
paul young cpa, cga
 

More from paul young cpa, cga (20)

Retail Sales and Consumer Spending Analysis and Commentary - July 2023.pptx
Retail Sales and Consumer Spending Analysis and Commentary - July 2023.pptxRetail Sales and Consumer Spending Analysis and Commentary - July 2023.pptx
Retail Sales and Consumer Spending Analysis and Commentary - July 2023.pptx
 
Addressing issues with the Public Sector Governance Model.pptx
Addressing issues with the Public Sector Governance Model.pptxAddressing issues with the Public Sector Governance Model.pptx
Addressing issues with the Public Sector Governance Model.pptx
 
Global Housing Market Analysis and Commentary- September 2023.pptx
Global Housing Market Analysis and Commentary- September 2023.pptxGlobal Housing Market Analysis and Commentary- September 2023.pptx
Global Housing Market Analysis and Commentary- September 2023.pptx
 
What is next for the Mining Sector.pptx
What is next for the Mining Sector.pptxWhat is next for the Mining Sector.pptx
What is next for the Mining Sector.pptx
 
Manufacturing Sector – United States – August 2023.pptx
Manufacturing Sector – United States – August 2023.pptxManufacturing Sector – United States – August 2023.pptx
Manufacturing Sector – United States – August 2023.pptx
 
Stock Market Analysis and Commentary for WE September 15 2023.pptx
Stock Market Analysis and Commentary for WE September 15 2023.pptxStock Market Analysis and Commentary for WE September 15 2023.pptx
Stock Market Analysis and Commentary for WE September 15 2023.pptx
 
Manufacturing Sector – Canada – September 2023.pptx
Manufacturing Sector – Canada – September 2023.pptxManufacturing Sector – Canada – September 2023.pptx
Manufacturing Sector – Canada – September 2023.pptx
 
Electricity Analysis - Canada and the OECD - June 2023.pptx
Electricity Analysis - Canada and the OECD - June 2023.pptxElectricity Analysis - Canada and the OECD - June 2023.pptx
Electricity Analysis - Canada and the OECD - June 2023.pptx
 
Logistics Warehousing Transportation and Distrbution Analysis and Commentary ...
Logistics Warehousing Transportation and Distrbution Analysis and Commentary ...Logistics Warehousing Transportation and Distrbution Analysis and Commentary ...
Logistics Warehousing Transportation and Distrbution Analysis and Commentary ...
 
Retail Sales and Consumer Spending Analysis and Commentary - United States - ...
Retail Sales and Consumer Spending Analysis and Commentary - United States - ...Retail Sales and Consumer Spending Analysis and Commentary - United States - ...
Retail Sales and Consumer Spending Analysis and Commentary - United States - ...
 
How to improve the Governance Model for the Public Sector - United States - S...
How to improve the Governance Model for the Public Sector - United States - S...How to improve the Governance Model for the Public Sector - United States - S...
How to improve the Governance Model for the Public Sector - United States - S...
 
What is next for Agriculture Sector - August 2023.pptx
What is next for Agriculture Sector - August 2023.pptxWhat is next for Agriculture Sector - August 2023.pptx
What is next for Agriculture Sector - August 2023.pptx
 
Biotech Pharmaceutical Medical Equipment and Supplies - Analysis - September ...
Biotech Pharmaceutical Medical Equipment and Supplies - Analysis - September ...Biotech Pharmaceutical Medical Equipment and Supplies - Analysis - September ...
Biotech Pharmaceutical Medical Equipment and Supplies - Analysis - September ...
 
Better Public Safety Management using Analytics - September 2023.pptx
Better Public Safety Management using Analytics - September 2023.pptxBetter Public Safety Management using Analytics - September 2023.pptx
Better Public Safety Management using Analytics - September 2023.pptx
 
Stock Market Analysis and Commentary for WE September 9 2023.pptx
Stock Market Analysis and Commentary for WE September 9 2023.pptxStock Market Analysis and Commentary for WE September 9 2023.pptx
Stock Market Analysis and Commentary for WE September 9 2023.pptx
 
Workforce Planning and Employment Analysis - August 2023.pptx
Workforce Planning and Employment Analysis - August 2023.pptxWorkforce Planning and Employment Analysis - August 2023.pptx
Workforce Planning and Employment Analysis - August 2023.pptx
 
Global Automotive - Analysis and Commentary - August 2023.pptx
Global Automotive - Analysis and Commentary - August 2023.pptxGlobal Automotive - Analysis and Commentary - August 2023.pptx
Global Automotive - Analysis and Commentary - August 2023.pptx
 
Global (Mining Oil and Gas Forestry and Agriculture) Analysis and Commentary ...
Global (Mining Oil and Gas Forestry and Agriculture) Analysis and Commentary ...Global (Mining Oil and Gas Forestry and Agriculture) Analysis and Commentary ...
Global (Mining Oil and Gas Forestry and Agriculture) Analysis and Commentary ...
 
World Merchandise Trade – September 2023.pptx
World Merchandise Trade – September 2023.pptxWorld Merchandise Trade – September 2023.pptx
World Merchandise Trade – September 2023.pptx
 
What is next for the Forestry Sector and Lumber Production - September 2023.pptx
What is next for the Forestry Sector and Lumber Production - September 2023.pptxWhat is next for the Forestry Sector and Lumber Production - September 2023.pptx
What is next for the Forestry Sector and Lumber Production - September 2023.pptx
 

Recently uploaded

call girls in Sant Nagar (DELHI) 🔝 >༒9953056974 🔝 genuine Escort Service 🔝✔️✔️
call girls in Sant Nagar (DELHI) 🔝 >༒9953056974 🔝 genuine Escort Service 🔝✔️✔️call girls in Sant Nagar (DELHI) 🔝 >༒9953056974 🔝 genuine Escort Service 🔝✔️✔️
call girls in Sant Nagar (DELHI) 🔝 >༒9953056974 🔝 genuine Escort Service 🔝✔️✔️
9953056974 Low Rate Call Girls In Saket, Delhi NCR
 
Best VIP Call Girls Morni Hills Just Click Me 6367492432
Best VIP Call Girls Morni Hills Just Click Me 6367492432Best VIP Call Girls Morni Hills Just Click Me 6367492432
Best VIP Call Girls Morni Hills Just Click Me 6367492432
motiram463
 
( Jasmin ) Top VIP Escorts Service Dindigul 💧 7737669865 💧 by Dindigul Call G...
( Jasmin ) Top VIP Escorts Service Dindigul 💧 7737669865 💧 by Dindigul Call G...( Jasmin ) Top VIP Escorts Service Dindigul 💧 7737669865 💧 by Dindigul Call G...
( Jasmin ) Top VIP Escorts Service Dindigul 💧 7737669865 💧 by Dindigul Call G...
dipikadinghjn ( Why You Choose Us? ) Escorts
 
VIP Call Girl in Mumbai 💧 9920725232 ( Call Me ) Get A New Crush Everyday Wit...
VIP Call Girl in Mumbai 💧 9920725232 ( Call Me ) Get A New Crush Everyday Wit...VIP Call Girl in Mumbai 💧 9920725232 ( Call Me ) Get A New Crush Everyday Wit...
VIP Call Girl in Mumbai 💧 9920725232 ( Call Me ) Get A New Crush Everyday Wit...
dipikadinghjn ( Why You Choose Us? ) Escorts
 
From Luxury Escort Service Kamathipura : 9352852248 Make on-demand Arrangemen...
From Luxury Escort Service Kamathipura : 9352852248 Make on-demand Arrangemen...From Luxury Escort Service Kamathipura : 9352852248 Make on-demand Arrangemen...
From Luxury Escort Service Kamathipura : 9352852248 Make on-demand Arrangemen...
From Luxury Escort : 9352852248 Make on-demand Arrangements Near yOU
 
VIP Call Girl Service Andheri West ⚡ 9920725232 What It Takes To Be The Best ...
VIP Call Girl Service Andheri West ⚡ 9920725232 What It Takes To Be The Best ...VIP Call Girl Service Andheri West ⚡ 9920725232 What It Takes To Be The Best ...
VIP Call Girl Service Andheri West ⚡ 9920725232 What It Takes To Be The Best ...
dipikadinghjn ( Why You Choose Us? ) Escorts
 
Call Girls in New Ashok Nagar, (delhi) call me [9953056974] escort service 24X7
Call Girls in New Ashok Nagar, (delhi) call me [9953056974] escort service 24X7Call Girls in New Ashok Nagar, (delhi) call me [9953056974] escort service 24X7
Call Girls in New Ashok Nagar, (delhi) call me [9953056974] escort service 24X7
9953056974 Low Rate Call Girls In Saket, Delhi NCR
 

Recently uploaded (20)

Booking open Available Pune Call Girls Shivane 6297143586 Call Hot Indian Gi...
Booking open Available Pune Call Girls Shivane  6297143586 Call Hot Indian Gi...Booking open Available Pune Call Girls Shivane  6297143586 Call Hot Indian Gi...
Booking open Available Pune Call Girls Shivane 6297143586 Call Hot Indian Gi...
 
Vasai-Virar Fantastic Call Girls-9833754194-Call Girls MUmbai
Vasai-Virar Fantastic Call Girls-9833754194-Call Girls MUmbaiVasai-Virar Fantastic Call Girls-9833754194-Call Girls MUmbai
Vasai-Virar Fantastic Call Girls-9833754194-Call Girls MUmbai
 
call girls in Sant Nagar (DELHI) 🔝 >༒9953056974 🔝 genuine Escort Service 🔝✔️✔️
call girls in Sant Nagar (DELHI) 🔝 >༒9953056974 🔝 genuine Escort Service 🔝✔️✔️call girls in Sant Nagar (DELHI) 🔝 >༒9953056974 🔝 genuine Escort Service 🔝✔️✔️
call girls in Sant Nagar (DELHI) 🔝 >༒9953056974 🔝 genuine Escort Service 🔝✔️✔️
 
Best VIP Call Girls Morni Hills Just Click Me 6367492432
Best VIP Call Girls Morni Hills Just Click Me 6367492432Best VIP Call Girls Morni Hills Just Click Me 6367492432
Best VIP Call Girls Morni Hills Just Click Me 6367492432
 
Top Rated Pune Call Girls Shikrapur ⟟ 6297143586 ⟟ Call Me For Genuine Sex S...
Top Rated  Pune Call Girls Shikrapur ⟟ 6297143586 ⟟ Call Me For Genuine Sex S...Top Rated  Pune Call Girls Shikrapur ⟟ 6297143586 ⟟ Call Me For Genuine Sex S...
Top Rated Pune Call Girls Shikrapur ⟟ 6297143586 ⟟ Call Me For Genuine Sex S...
 
Call Girls Service Pune ₹7.5k Pick Up & Drop With Cash Payment 9352852248 Cal...
Call Girls Service Pune ₹7.5k Pick Up & Drop With Cash Payment 9352852248 Cal...Call Girls Service Pune ₹7.5k Pick Up & Drop With Cash Payment 9352852248 Cal...
Call Girls Service Pune ₹7.5k Pick Up & Drop With Cash Payment 9352852248 Cal...
 
( Jasmin ) Top VIP Escorts Service Dindigul 💧 7737669865 💧 by Dindigul Call G...
( Jasmin ) Top VIP Escorts Service Dindigul 💧 7737669865 💧 by Dindigul Call G...( Jasmin ) Top VIP Escorts Service Dindigul 💧 7737669865 💧 by Dindigul Call G...
( Jasmin ) Top VIP Escorts Service Dindigul 💧 7737669865 💧 by Dindigul Call G...
 
8377087607, Door Step Call Girls In Kalkaji (Locanto) 24/7 Available
8377087607, Door Step Call Girls In Kalkaji (Locanto) 24/7 Available8377087607, Door Step Call Girls In Kalkaji (Locanto) 24/7 Available
8377087607, Door Step Call Girls In Kalkaji (Locanto) 24/7 Available
 
Booking open Available Pune Call Girls Talegaon Dabhade 6297143586 Call Hot ...
Booking open Available Pune Call Girls Talegaon Dabhade  6297143586 Call Hot ...Booking open Available Pune Call Girls Talegaon Dabhade  6297143586 Call Hot ...
Booking open Available Pune Call Girls Talegaon Dabhade 6297143586 Call Hot ...
 
Kopar Khairane Russian Call Girls Number-9833754194-Navi Mumbai Fantastic Unl...
Kopar Khairane Russian Call Girls Number-9833754194-Navi Mumbai Fantastic Unl...Kopar Khairane Russian Call Girls Number-9833754194-Navi Mumbai Fantastic Unl...
Kopar Khairane Russian Call Girls Number-9833754194-Navi Mumbai Fantastic Unl...
 
Diva-Thane European Call Girls Number-9833754194-Diva Busty Professional Call...
Diva-Thane European Call Girls Number-9833754194-Diva Busty Professional Call...Diva-Thane European Call Girls Number-9833754194-Diva Busty Professional Call...
Diva-Thane European Call Girls Number-9833754194-Diva Busty Professional Call...
 
Business Principles, Tools, and Techniques in Participating in Various Types...
Business Principles, Tools, and Techniques  in Participating in Various Types...Business Principles, Tools, and Techniques  in Participating in Various Types...
Business Principles, Tools, and Techniques in Participating in Various Types...
 
(Sexy Sheela) Call Girl Mumbai Call Now 👉9920725232👈 Mumbai Escorts 24x7
(Sexy Sheela) Call Girl Mumbai Call Now 👉9920725232👈 Mumbai Escorts 24x7(Sexy Sheela) Call Girl Mumbai Call Now 👉9920725232👈 Mumbai Escorts 24x7
(Sexy Sheela) Call Girl Mumbai Call Now 👉9920725232👈 Mumbai Escorts 24x7
 
VIP Call Girl in Mumbai 💧 9920725232 ( Call Me ) Get A New Crush Everyday Wit...
VIP Call Girl in Mumbai 💧 9920725232 ( Call Me ) Get A New Crush Everyday Wit...VIP Call Girl in Mumbai 💧 9920725232 ( Call Me ) Get A New Crush Everyday Wit...
VIP Call Girl in Mumbai 💧 9920725232 ( Call Me ) Get A New Crush Everyday Wit...
 
Navi Mumbai Cooperetive Housewife Call Girls-9833754194-Natural Panvel Enjoye...
Navi Mumbai Cooperetive Housewife Call Girls-9833754194-Natural Panvel Enjoye...Navi Mumbai Cooperetive Housewife Call Girls-9833754194-Natural Panvel Enjoye...
Navi Mumbai Cooperetive Housewife Call Girls-9833754194-Natural Panvel Enjoye...
 
From Luxury Escort Service Kamathipura : 9352852248 Make on-demand Arrangemen...
From Luxury Escort Service Kamathipura : 9352852248 Make on-demand Arrangemen...From Luxury Escort Service Kamathipura : 9352852248 Make on-demand Arrangemen...
From Luxury Escort Service Kamathipura : 9352852248 Make on-demand Arrangemen...
 
Kharghar Blowjob Housewife Call Girls NUmber-9833754194-CBD Belapur Internati...
Kharghar Blowjob Housewife Call Girls NUmber-9833754194-CBD Belapur Internati...Kharghar Blowjob Housewife Call Girls NUmber-9833754194-CBD Belapur Internati...
Kharghar Blowjob Housewife Call Girls NUmber-9833754194-CBD Belapur Internati...
 
VIP Call Girl Service Andheri West ⚡ 9920725232 What It Takes To Be The Best ...
VIP Call Girl Service Andheri West ⚡ 9920725232 What It Takes To Be The Best ...VIP Call Girl Service Andheri West ⚡ 9920725232 What It Takes To Be The Best ...
VIP Call Girl Service Andheri West ⚡ 9920725232 What It Takes To Be The Best ...
 
Bandra High Profile Sexy Call Girls,9833754194-Khar Road Speciality Call Girl...
Bandra High Profile Sexy Call Girls,9833754194-Khar Road Speciality Call Girl...Bandra High Profile Sexy Call Girls,9833754194-Khar Road Speciality Call Girl...
Bandra High Profile Sexy Call Girls,9833754194-Khar Road Speciality Call Girl...
 
Call Girls in New Ashok Nagar, (delhi) call me [9953056974] escort service 24X7
Call Girls in New Ashok Nagar, (delhi) call me [9953056974] escort service 24X7Call Girls in New Ashok Nagar, (delhi) call me [9953056974] escort service 24X7
Call Girls in New Ashok Nagar, (delhi) call me [9953056974] escort service 24X7
 

Building Permits and Construction - Canada - January 2020

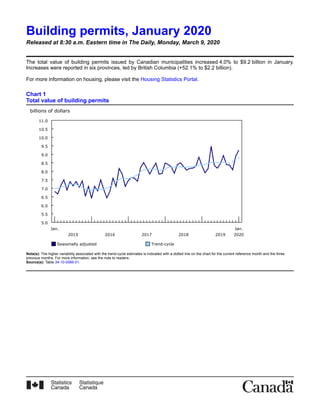
  • 1. Building permits, January 2020 Released at 8:30 a.m. Eastern time in The Daily, Monday, March 9, 2020 The total value of building permits issued by Canadian municipalities increased 4.0% to $9.2 billion in January. Increases were reported in six provinces, led by British Columbia (+52.1% to $2.2 billion). For more information on housing, please visit the Housing Statistics Portal. Chart 1 Total value of building permits billions of dollars 5.0 5.5 6.0 6.5 7.0 7.5 8.0 8.5 9.0 9.5 10.0 10.5 11.0 Jan. 2015 2016 2017 2018 2019 Jan. 2020 Seasonally adjusted Trend-cycle Note(s): The higher variability associated with the trend-cycle estimates is indicated with a dotted line on the chart for the current reference month and the three previous months. For more information, see the note to readers. Source(s): Table 34-10-0066-01.
  • 2. The Daily, Monday, March 9, 2020 Component of Statistics Canada catalogue no. 11-001-X2 Chart 2 Value of building permits for the residential and non-residential sectors billions of dollars 1.0 1.5 2.0 2.5 3.0 3.5 4.0 4.5 5.0 5.5 6.0 6.5 Jan. 2015 2016 2017 2018 2019 Jan. 2020 Residential, seasonally adjusted Residential, trend-cycle Non-residential, seasonally adjusted Non-residential, trend-cycle Note(s): The higher variability associated with the trend-cycle estimates is indicated with a dotted line on the chart for the current reference month and the three previous months. For more information, see the note to readers. Source(s): Table 34-10-0066-01.
  • 3. The Daily, Monday, March 9, 2020 Component of Statistics Canada catalogue no. 11-001-X 3 Infographic 1 –  Building permits, January 2020
  • 4. The Daily, Monday, March 9, 2020 Component of Statistics Canada catalogue no. 11-001-X4 Change in Vancouver's development costs drives growth in British Columbia and nationally The majority of January's national increase in the value of building permits was in British Columbia (+$751 million), largely due to the census metropolitan area (CMA) of Vancouver. The value of permits increased in the CMA of Vancouver by 81.8%, prior to increases in development fees, which came into effect on January 15. Meanwhile, Quebec (-$366 million) and Ontario (-$161 million) reported the largest provincial declines after strong activity in December 2019. Chart 3 Month-to-month change in the value of residential building permits Canada Newfoundland and Labrador Prince Edward Island Nova Scotia New Brunswick Quebec Ontario Manitoba Saskatchewan Alberta British Columbia Yukon Northwest Territories Nunavut -200 0 200 400 600 800 millions of dollars Single-family dwellings Multi-family dwellings Source(s): Table 34-10-0066-01. Value of residential permits up for multi- and single-family dwellings The residential sector reported strong gains in January, increasing 12.7% from December 2019 to $5.8 billion. Permits for multi-family dwellings were up 17.1% to $3.4 billion in January, largely due to multiple projects in the CMA of Vancouver. The total value of permits for single-family dwellings increased 7.0% to $2.4 billion, mainly due to housing developments in Ontario (+$105 million) and Quebec (+$48 million). The CMA of Brantford reported the largest increase in the value of permits for single-family dwellings (+340.9% to $41 million), a record high for the CMA.
  • 5. The Daily, Monday, March 9, 2020 Component of Statistics Canada catalogue no. 11-001-X 5 Chart 4 Month-to-month change in the value of non-residential building permits Canada Newfoundland and Labrador Prince Edward Island Nova Scotia New Brunswick Quebec Ontario Manitoba Saskatchewan Alberta British Columbia Yukon Northwest Territories Nunavut -600 -400 -200 0 200 400 millions of dollars Industrial Commercial Institutional Source(s): Table 34-10-0066-01. Non-residential sector down due to institutional permits The value of non-residential permits was down 7.8% to $3.5 billion in January. This decrease was largely due to a decline in the total value of institutional permits (-30.5% to $732 million) following strong gains in December 2019. Despite increases in seven provinces, the value of commercial permits decreased 0.8% to $2.1 billion, with Quebec reporting the largest decline (-$249 million). The value of industrial permits offset some of the non-residential decline, rising 6.8% to $682 million, led by Ontario (+$90 million).
  • 6. The Daily, Monday, March 9, 2020 Component of Statistics Canada catalogue no. 11-001-X6 Note to readers Unless otherwise stated, this release presents seasonally adjusted data, which facilitate month-to-month comparisons by removing the effects of seasonal variations. For information on seasonal adjustment, see Seasonally adjusted data – Frequently asked questions. The Building Permits Survey covers over 2,400 municipalities, representing 95% of the Canadian population. The communities representing the other 5% of the population are very small, and their levels of building activity have little impact on the total for the entire population. Building permit data are used as a leading indicator of activity in the construction industry. The value of planned construction activities presented in this release excludes engineering projects (such as waterworks, sewers or culverts) and land. For the purposes of this release, the census metropolitan area of Ottawa–Gatineau (Ontario and Quebec) is divided into two areas: the Ottawa part and the Gatineau part. Unless otherwise specified, the highlights refer to seasonally adjusted current dollars and are ranked in terms of dollar change rather than percentage change. Building components Single-family dwellings: Residential buildings containing only one dwelling unit (for example, single-detached house, bungalow, linked home [linked at the foundation]). Multi-family dwellings: Residential buildings containing multiple dwelling units (for example, apartment, apartment condominium, row house, semi-detached). Industrial buildings: Buildings used in the processing or production of goods, or related to transportation and communication. Commercial buildings: Buildings used in the trade or distribution of goods and services. Institutional and government buildings: Buildings used to house public and semi-public services, such as those related to health and welfare, education, or public administration, as well as buildings used for religious services. Revision Unadjusted data for the current reference month are subject to revision based on late responses. Data for the previous month have been revised. Seasonally adjusted data for the previous two months have also been revised. Trend-cycle estimates have been added to the charts as a complement to the seasonally adjusted series. Both seasonally adjusted data and trend-cycle estimates are subject to revision as additional observations become available. These revisions could be large and could even lead to a reversal of movement, especially at the end of the series. The higher variability associated with trend-cycle estimates is indicated with a dotted line on the chart. For information on trend-cycle data, see the StatCan Blog and Trend-cycle estimates – Frequently asked questions. Next release Data on building permits for February will be released on April 8.
  • 7. The Daily, Monday, March 9, 2020 Component of Statistics Canada catalogue no. 11-001-X 7 Table 1 Dwelling units, value of residential and non-residential building permits, Canada – Seasonally adjusted January 2019 November 2019r December 2019r January 2020p December 2019 to January 2020 January 2019 to January 2020 millions of dollars % change Total 8,318.1 8,087.3 8,887.7 9,245.7 4.0 11.2 Residential 5,329.3 4,749.4 5,128.2 5,780.1 12.7 8.5 Single1 2,068.2 2,246.2 2,214.4 2,369.5 7.0 14.6 Multiple 3,261.2 2,503.2 2,913.8 3,410.6 17.1 4.6 Non-residential 2,988.8 3,337.9 3,759.5 3,465.6 -7.8 16.0 Industrial 593.1 738.7 638.5 682.0 6.8 15.0 Commercial 1,793.6 1,695.1 2,066.9 2,051.4 -0.8 14.4 Institutional 602.1 904.0 1,054.1 732.2 -30.5 21.6 number of units % change Total dwellings 21,025 18,410 19,037 22,143 16.3 5.3 Single1 4,455 4,958 4,825 5,437 12.7 22.0 Multiple 16,570 13,451 14,211 16,707 17.6 0.8 r revised p preliminary 1. Included in this category are the following types of dwellings: single-detached, mobile home and cottage. Note(s): Data may not add up to totals as a result of rounding. Source(s): Table 34-10-0066-01.
  • 8. The Daily, Monday, March 9, 2020 Component of Statistics Canada catalogue no. 11-001-X8 Table 2 Value of building permits, by province and territory – Seasonally adjusted January 2019 November 2019r December 2019r January 2020p December 2019 to January 2020 January 2019 to January 2020 millions of dollars % change Canada 8,318.1 8,087.3 8,887.7 9,245.7 4.0 11.2 Residential 5,329.3 4,749.4 5,128.2 5,780.1 12.7 8.5 Non-residential 2,988.8 3,337.9 3,759.5 3,465.6 -7.8 16.0 Newfoundland and Labrador 39.8 56.9 48.8 76.9 57.6 93.0 Residential 18.2 19.9 17.8 17.0 -4.7 -6.5 Non-residential 21.7 37.0 31.0 59.9 93.4 1,137.9 Prince Edward Island 19.7 33.2 24.4 22.3 -8.5 13.2 Residential 17.8 26.6 20.3 17.9 -11.9 0.1 Non-residential 1.9 6.5 4.1 4.5 8.4 136.1 Nova Scotia 174.4 135.5 114.6 132.7 15.9 -23.9 Residential 145.5 90.3 81.9 92.8 13.3 -36.2 Non-residential 28.8 45.2 32.6 39.9 22.3 38.4 New Brunswick 98.4 73.9 90.8 63.3 -30.3 -35.7 Residential 38.7 31.3 39.9 38.2 -4.3 -1.3 Non-residential 59.7 42.6 50.9 25.1 -50.7 -58.0 Quebec 1,629.7 1,905.4 2,233.0 1,866.9 -16.4 14.6 Residential 930.2 916.3 1,150.2 1,138.3 -1.0 22.4 Non-residential 699.5 989.1 1,082.8 728.6 -32.7 4.2 Ontario 3,387.3 3,113.1 3,595.0 3,433.5 -4.5 1.4 Residential 2,211.0 1,951.4 1,931.2 2,024.3 4.8 -8.4 Non-residential 1,176.3 1,161.6 1,663.8 1,409.2 -15.3 19.8 Manitoba 265.5 286.2 219.2 270.9 23.6 2.1 Residential 144.0 145.8 92.6 108.9 17.6 -24.4 Non-residential 121.4 140.3 126.5 162.0 28.1 33.4 Saskatchewan 167.5 122.1 104.3 133.7 28.2 -20.2 Residential 90.6 47.0 54.7 62.7 14.7 -30.8 Non-residential 76.9 75.1 49.6 71.0 43.2 -7.7 Alberta 942.7 1,005.7 1,010.8 1,035.3 2.4 9.8 Residential 562.6 605.1 616.5 607.4 -1.5 8.0 Non-residential 380.0 400.6 394.3 427.8 8.5 12.6 British Columbia 1,566.7 1,329.8 1,440.1 2,190.7 52.1 39.8 Residential 1,147.9 901.1 1,117.1 1,668.5 49.4 45.4 Non-residential 418.8 428.6 323.0 522.2 61.7 24.7 Yukon 4.2 3.9 3.2 17.9 453.9 324.4 Residential 3.2 3.3 2.8 2.7 -4.6 -15.8 Non-residential 1.1 0.6 0.4 15.3 ... ... Northwest Territories 1.1 5.6 3.3 1.2 -64.0 12.3 Residential 0.9 3.5 2.9 1.1 -61.9 28.8 Non-residential 0.2 2.1 0.4 0.1 -81.4 -63.8 Nunavut F 16.0 0.2 F F F Residential F 7.7 0.2 F F F Non-residential F 8.3 0.0 0.0 ... F r revised p preliminary ... not applicable F too unreliable to be published Note(s): Data may not add up to totals as a result of rounding. Source(s): Table 34-10-0066-01.
  • 9. The Daily, Monday, March 9, 2020 Component of Statistics Canada catalogue no. 11-001-X 9 Table 3 Value of building permits, by census metropolitan area – Seasonally adjusted1 January 2019 November 2019r December 2019r January 2020p December 2019 to January 2020 January 2019 to January 2020 millions of dollars % change Total, census metropolitan areas 6,384.6 5,948.2 7,018.9 6,979.6 -0.6 9.3 St. John's 16.9 45.8 39.5 16.2 -59.0 -4.4 Halifax 123.2 74.8 69.6 87.9 26.3 -28.7 Moncton 23.4 28.8 27.7 21.4 -22.7 -8.6 Saint John 14.2 13.3 12.1 12.4 2.6 -12.4 Saguenay 16.8 20.0 106.6 22.5 -78.9 34.0 Québec 170.0 246.0 148.2 195.9 32.2 15.3 Sherbrooke 33.1 51.7 61.9 126.2 103.8 281.1 Trois-Rivières 34.3 18.8 25.5 22.9 -10.3 -33.2 Montréal 858.8 973.2 1,320.7 934.6 -29.2 8.8 Ottawa–Gatineau, Ontario and Quebec 362.2 390.7 345.6 384.8 11.3 6.2 Gatineau part 90.7 112.4 59.1 46.2 -21.7 -49.0 Ottawa part 271.4 278.4 286.5 338.5 18.2 24.7 Kingston 17.6 14.9 10.9 26.4 141.4 50.2 Belleville 11.0 16.7 8.0 11.8 47.0 7.3 Peterborough 18.8 2.8 35.6 41.7 1,062.7 121.1 Oshawa 43.7 57.0 34.8 94.0 170.0 115.1 Toronto 1,763.9 1,283.1 1,929.6 1,524.3 -21.0 -13.6 Hamilton 165.2 105.6 191.0 118.4 -38.0 -28.3 St. Catharines–Niagara 61.5 94.5 114.7 69.5 -39.4 13.2 Kitchener–Cambridge–Waterloo 170.5 218.6 98.8 150.1 51.8 -12.0 Brantford 19.1 30.9 14.5 51.3 254.3 168.7 Guelph 66.9 25.0 65.2 22.3 -65.8 -66.7 London 74.6 140.7 126.0 107.2 -14.9 43.7 Windsor 34.3 91.8 57.1 63.4 11.1 84.6 Barrie 19.3 25.5 18.9 69.4 266.5 260.6 Greater Sudbury 28.2 20.4 17.6 24.2 37.7 -14.1 Thunder Bay 5.3 8.1 4.3 9.7 123.0 81.6 Winnipeg 192.4 218.3 160.7 174.9 8.9 -9.1 Regina 32.9 45.8 30.7 44.8 46.1 36.3 Saskatoon 73.3 51.5 45.9 61.3 33.7 -16.3 Lethbridge 21.4 17.4 26.0 23.8 -8.4 11.1 Calgary 413.3 455.2 477.1 450.7 -5.5 9.0 Edmonton 278.1 274.5 345.8 332.4 -3.9 19.5 Kelowna 80.0 84.2 88.3 82.5 -6.6 3.1 Abbotsford–Mission 36.7 70.9 34.6 25.6 -26.0 -30.2 Vancouver 1,000.0 641.9 811.2 1,475.2 81.8 47.5 Victoria 103.5 89.8 114.2 99.8 -12.7 -3.7 r revised p preliminary 1. Go online to view the census subdivisions that make up the census metropolitan areas. Note(s): Data may not add up to totals as a result of rounding. Source(s): Table 34-10-0066-01. Available tables: table 34-10-0066-01. Definitions, data sources and methods: survey number 2802. For more information, or to enquire about the concepts, methods or data quality of this release, contact us (toll-free 1-800-263-1136; 514-283-8300; STATCAN.infostats-infostats.STATCAN@canada.ca) or Media Relations (613-951-4636; STATCAN.mediahotline-ligneinfomedias.STATCAN@canada.ca).