Significant AI Trends for the Financial Industry in 2024 and How to Utilize Them
Economic forecasts for Spain European Commission
1. Economic forecasts for Spain
European Commission
ECONOMY
The data
PUBLIC DEBT
2021
119.6%
of GDP, 4 tenths less than in
2020 and 25.2 pp more than the
EU average
The economy will be conditioned by the pandemic in
2021 and 2022
THE HEALTH CONCERN WILL REMAIN AND COULD LEAD TO THE IMPLEMENTATION OF NEW RESTRICTIONS TO CONTROL IT
Source: Círculo de Empresarios based on
European Commission, 2021.
ANNUAL GDP INCREASE
2021
5.9%
1.7 pp more than the EU
average
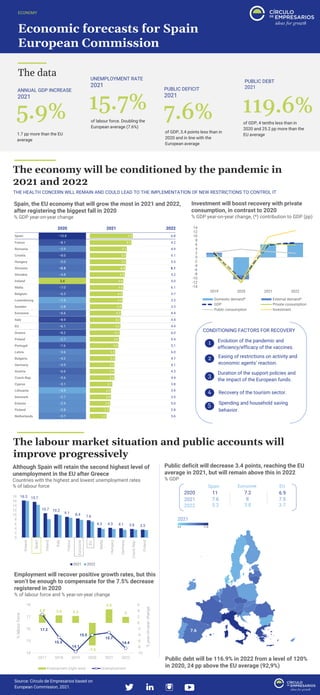
Spain, the EU economy that will grow the most in 2021 and 2022,
after registering the biggest fall in 2020
% GDP year-on-year change
UNEMPLOYMENT RATE
2021
15.7%
of labour force. Doubling the
European average (7.6%)
7.6%
PUBLIC DEFICIT
2021
of GDP, 3.4 points less than in
2020 and in line with the
European average
The labour market situation and public accounts will
improve progressively
Public deficit will decrease 3.4 points, reaching the EU
average in 2021, but will remain above this in 2022
% GDP
11
Spain
2020
2021
2022 5.2
7.6
Eurozone EU
7.2
3.8
8
Public debt will be 116.9% in 2022 from a level of 120%
in 2020, 24 pp above the EU average (92,9%)
6.9
3.7
7.5
Investment will boost recovery with private
consumption, in contrast to 2020
% GDP year-on-year change, (*) contribution to GDP (pp)
-14
-12
-10
-8
-6
-4
-2
0
2
4
6
8
10
12
14
2019 2020 2021 2022
Domestic demand* External demand*
GDP Private consumption
Public consumption Investment
CONDITIONING FACTORS FOR RECOVERY
1 Evolution of the pandemic and
efficiency/efficacy of the vaccines.
Duration of the support policies and
the impact of the European funds.
Recovery of the tourism sector.
Easing of restrictions on activity and
economic agents’ reaction.
Spending and household saving
behavior.
2
3
4
5
Although Spain will retain the second highest level of
unemployment in the EU after Greece
Countries with the highest and lowest unemployment rates
% of labour force
16.3 15.7
10.7 10.2
9.1 8.4 7.6
4.3 4.3 4.1 3.8 3.5
0
2
4
6
8
10
12
14
16
18
Greece
Spain
Ireland
Italy
France
Eurozone
EU
Malta
Hungary
Germany
Czech
Rep.
Poland
2021 2022
2.8 2.5 2.3
-7.5
4.5
2
17.2
15.3
14.1
15.5
15.7
14.4
-10
-8
-6
-4
-2
0
2
4
6
14
15
16
17
18
2017 2018 2019 2020 2021 2022
%
year-on-year
change
%
labour
force
Employment (right axis) Unemployment
Employment will recover positive growth rates, but this
won’t be enough to compensate for the 7.5% decrease
registered in 2020
% of labour force and % year-on-year change
2021