SlideShare a Scribd company logo
1 of 114
The knock on most business leaders is that they don’t take the
long view—that they’re fixated on achieving short-term goals
to lift their pay. So which global CEOs actually delivered solid
results over the long run? The 2013 version of the CEO
Scorecard
provides an objective answer.
by Morten T. Hansen, Herminia Ibarra, and Urs Peyer
100
The Best-Performing
CEOs in the World
hBr.Org
January–February 2013 harvard Business review 81
The BesT-Performing Ceos in The World
I
t’s no accident that chief executives so
often focus on short-term financial re-
sults at the expense of longer-term per-
formance. They have every incentive to
do so. If they don’t make their quarterly
or annual numbers, their compensa-
tion drops and their jobs are in jeopardy.
Stock analysts, shareholders, and often
their own boards judge them harshly if
they miss near-term goals. And without
equally strong pressure to manage for a future that
stretches beyond 90 or 180 days, CEOs’ behavior is
unlikely to change. Developing a simple yet rigorous
way to gauge long-term performance is crucial; after
all, in business, leaders default to managing what’s
measured.
Five years ago we launched a global project to ad-
dress that challenge. But we wanted to do more than
just devise the right metrics. Our goal was to imple-
ment a scorecard that would not only get people
talking about long-term performance but also alter
the way that boards, executives, consultants, and
management scholars thought about and assessed
CEOs. We wanted this innovation to shine a spotlight
on the CEOs worldwide who had created long-term
value for their companies, and we wanted to give ex-
ecutives around the world critical benchmarks they
could aim for.
Three years ago, in the January–February 2010 is-
sue of HBR, we introduced such a scorecard. It evalu-
ated chief executives on their entire tenure in office.
We used it to rank the performance of nearly 2,000
CEOs. This month we are publishing a new version of
that analysis. We have expanded it along two impor-
tant new dimensions—making the group of CEOs we
studied truly global, and examining which CEOs and
companies were able to do well not only financially
but also in terms of corporate social performance.
Judging Ceo Performance
For the most part, we used the same methodology
that we did three years ago. (See the sidebar “How
We Created the Scorecard,” page 92.) We wanted to
accomplish three things:
Assess the long-term performance of each
CEO, from the first day on the job to the last.
(Or for CEOs still in office, until August 31, 2012, our
last day of data collection.) To do this, we looked at
how much total shareholder returns had changed
over that time period (adjusting for country and in-
dustry effects), plus the overall increase in market
capitalization.
Reflect the global nature of business. In 2010
we drew candidates from the S&P Global 1200 and
BRIC 40 lists; this year we worked with three other
emerging-market indexes as well. The pool of CEOs
studied increased by roughly one-third, from 1,999
in 2010 to 3,143 this year.
Be objective. Other rankings use reputation
and surveys, which tap into popularity and ce-
lebrity status, to score CEOs. Instead, we use only
performance data—notably, total shareholder per-
formance. Other metrics, such as sales, profitability,
and innovation rates, are useful, too, but they differ
by industry, which makes comparisons difficult.
Granted, one downside of using truly objective
measures is that our ranking may not exclude CEOs
who have disappointed stakeholders on dimensions
where performance is more subjective. This can be
especially challenging with CEOs from emerging
markets where rules are still being established. But
even though CEOs are held accountable in areas that
shareholder performance cannot capture, it remains
the principal standard by which they are judged.
Who’s Up, Who’s down
The top 100 CEOs on our list performed exception-
ally well. On average, they delivered a total share-
holder return of 1,385% during their tenures and
increased their firms’ market value by $40.2 billion
(adjusted for inflation, dividends, share repurchases,
and share issues). The contrast between their results
and those of the bottom 100 CEOs was striking: On
average, the bottom 100 produced a total share-
holder return of -57% and presided over a loss of
$13.6 billion in market value.
It comes as no surprise that the best-performing
CEO over the past 17 years was Steve Jobs of Apple,
who was #1 on our 2010 list as well. From 1997 to
2011, Apple’s market value increased by $359 bil-
lion, and its shareholder return experienced aver-
age compound annual growth of 35%. That remark-
82 Harvard Business Review January–february 2013
1
Steve Jobs
Company
Apple
Industry
Information Technology
tEnurE
1997–2011
InsIdEr
total sharEholdEr rEturn
Country Adjusted Industry Adjusted
markEt CapItalIzatIon ChangE
($ bIllIons)
+359
mBa
unItEd statEs
6,682% 6,621%
ovErall rank
3
Yun Jong-Yong
Company
Samsung Electronics
Industry
Information Technology
tEnurE
1996–2008
InsIdEr
total sharEholdEr rEturn
Country Adjusted Industry Adjusted
markEt CapItalIzatIon ChangE
($ bIllIons)
+128
mBa
south korEa
1,559% 1,437%
ovErall rank
2
ovErall rank
Jeffrey P. Bezos
Company
Amazon.com
Industry
Online Retail
tEnurE
1996–
InsIdEr
total sharEholdEr rEturn
Country Adjusted Industry Adjusted
markEt CapItalIzatIon ChangE
($ bIllIons)
+111
mBa
unItEd statEs
12,431% 12,266%
Continued on PAGe 84
Jeff Bezos’s focus on consumers above share-
holders has at times vexed Wall Street. But
smart investors have stayed with his company.
In 16 years as CEO of Amazon, the online retail
giant he created, Bezos has delivered industry-
adjusted shareholder returns of 12,266%,
and the value of the company has grown by
$111 billion.
Bezos took time to speak with HBR’s editor
in chief, Adi Ignatius, last November 26—Cyber
Monday, which set an all-time record for online
sales, a category Amazon practically invented.
Edited excerpts from the interview follow.
“ You Have to Be Willing to
Be Misunderstood”
4
Roger Agnelli
Company
Vale
Industry
Materials
tEnurE
2001–2011
InsIdEr
total sharEholdEr rEturn
Country Adjusted Industry Adjusted
markEt CapItalIzatIon ChangE
($ bIllIons)
+157
mBa
BrazIl
934% 1,773%
ovErall rank
BE
zO
S
Ph
O
TO
g
R
A
Ph
Y:
K
A
R
En
M
O
SK
O
w
IT
z
hBR.ORg
January–February 2013 harvard Business Review 83
The BesT-Performing Ceos in The World
2
Continued
Jeffrey P. Bezos
hBr: When Amazon went public, in 1997, you
wrote a letter to shareholders that said, “It’s all
about the long term.” Did you feel you were chal-
lenging orthodoxy?
Bezos: We were trying to make sure we were cor-
rectly advertising the event. Warren Buffett once
said, “You can hold a rock concert or you can hold a
ballet. Just don’t hold a rock concert and advertise it
as a ballet.” A public company has to be clear about
whether it’s holding a rock concert or a ballet, and
then investors can decide if they want to opt in.
What does it mean from the perspective of a CEO
to think long-term?
If you’re long-term oriented, customer interests
and shareholder interests are aligned. In the short
term, that’s not always the case. We have other
stakeholders, too—our employees, our vendors.
We take it as an article of faith that if we put cus-
tomers first, other stakeholders will also benefit, as
long as they’re willing to take the long-term view.
And a long-term approach is essential for invention,
because you’re going to have a lot of failures along
the way.
You’ve said that you like to plant seeds that may
take seven years to bear fruit. Doesn’t that mean
you’ll lose some battles to companies that have a
more conventional, two- or three-year outlook?
Maybe so, but if we had always needed to see sig-
nificant financial results in two or three years, then
some of the most meaningful things we’ve done
would never have been started—like Kindle, Ama-
zon Web Services, Amazon Prime.
How much do you care about your share price?
I care very much about our shareowners, so I care
very much about our long-term share price. I do
not follow the stock on a daily basis, because I don’t
think there’s any information in it. The economist
Benjamin Graham once said, “In the short term, the
stock market is a voting machine. In the long term,
it’s a weighing machine.” We try to build a company
that wants to be weighed, not voted on.
Does it make sense for Amazon to stay in the
hardware business, which is a low-margin, low-
profit area for you?
Our approach is to sell our hardware—our Kindle de-
vices—at near breakeven. Then we have an ongoing
relationship with customers who buy content from
us: digital books, music, movies, TV shows, games,
apps. We aren’t trying to make $100 every time we
sell a Kindle Fire, so we don’t have to get you on the
upgrade treadmill.
You have said that you would be interested, if you
had the right concept and approach, in creating a
physical Amazon retail experience. Why even con-
sider that?
We like to build innovative things, but only if we can
put our own unique twist on them. If we could find
something differentiated that we thought customers
would like, it would be superfun.
Would developing a phone fall into that innovative
category?
Yeah, absolutely.
Who do you fear is your biggest challenger?
We don’t get up every morning wondering, “Who are
the top three companies that are going to try to kill
us?” I know of companies that do that in their annual
planning processes, and the competitive zeal moti-
vates them. We do pay attention, but it’s not where
we get our energy from.
Disruption is a rough business. Do you have any
personal regrets about the pain your success has
caused traditional retailers?
I’m as sentimental as the next person. I have lots of
childhood memories of physical books and things
like that. But our job at Amazon is to build the best
customer experience we can and let customers
choose where they shop.
At what point will the goal change from lowering
margins and building market share to making a big-
ger profit?
Percentage margins are not something we seek to
optimize. We want to maximize the absolute-dollar
free cash flow per share. If we can do that by lowering
margins, we will. Free cash flow is something inves-
tors can spend. They can’t spend percentage margins.
Amazon has done a great job of self-cannibalizing
its revenue streams—going from Amazon Store to
84 Harvard Business Review January–february 2013
able accomplishment is likely to go unbeaten for a
long time.
Jeff Bezos of Amazon.com has now climbed
to the #2 spot, up from #7 in our 2010 list. Under
his leadership, the company delivered industry-
adjusted shareholder returns of 12,266% and saw
its value increase by $111 billion. In recent years the
online retailer has expanded aggressively into new
segments such as cloud-based computing services,
while working to get the most out of the markets it
already occupies. Its revenue growth shows no signs
of slowing: Sales increased by 40% in 2011.
The highest-ranked woman on the list is Meg
Whitman, currently the CEO of beleaguered HP,
whose performance as the CEO of eBay from 1998 to
2008 earned her the #9 spot. Overall, only 1.9% of all
the CEOs we studied were women.
There was considerable turnover in the top
100—this year about half (43) of the CEOs are new
to that list since 2010. The change happened largely
because in creating the 2013 ranking, we examined
a bigger, more international sample of CEOs. To
make the top 100 in 2010, CEOs had to rank in the
top 5% of the executives in the study; this year they
had to land in the top 3.2%. The majority of new-
comers to the top 100 are from emerging markets,
not surprisingly, but eight U.S. CEOs made the cut
for the first time.
One notable new name is Lars Sørensen, the CEO
of Novo Nordisk, a company that made its name
selling insulin for diabetics. He shot up from #233 in
2010 to #20 in our current ranking. After Sørensen
took over the company, in 2000, he spent 10 years
and $500 million expanding the sales force to make
it truly global. When all his competitors were invest-
ing in diabetes pills, Sørensen shut down Novo’s pill
research and instead focused the company on its
core competency—insulin and other injected dia-
betes medications, notably prefilled insulin “pens”
that eliminate the hassle of using a vial and syringe.
His bet that sales would continue to grow in the
wake of a worldwide diabetes epidemic has clearly
paid off.
Even industries that have gone through tough
times in recent years have seen some exceptional
results. Airlines, for example, have not been do-
ing well, but Air China, under the leadership of Li
Jiaxiang (#17 on our list), bucked that trend. During
his tenure, from 2004 to 2008, the company’s to-
tal shareholder return was 1,022 percentage points
higher than the average for its industry peers, while
Amazon Marketplace, from print to e-books, and
so on. In most companies, moves like those would
be hard to execute without organizational turmoil.
How have you managed the transitions?
When things get complicated, we simplify them by
asking, “What’s best for the customer?” We believe
that if we do that, things will work out in the long
term. We can never prove that. In fact, sometimes we
do price-elasticity studies, and the answer is always
that we should raise prices. But we don’t, because we
believe that by keeping our prices very low, we earn
trust with customers, and that this will maximize
free cash flow over the long term.
What have you learned about leadership from run-
ning what has become a very big company?
If you’re inventing and pioneering, you have to be
willing to be misunderstood for long periods of time.
One early example is customer reviews. A book pub-
lisher told me, “You don’t understand your business.
You make money when you sell things. Why do you
allow negative reviews?” And I thought, “We don’t
make money when we sell things; we make money
when we help customers make purchase decisions.”
How do you institutionalize the ability to come up
with these good, misunderstood ideas?
First, there are stories we tell ourselves internally
about persistence and patience, long-term think-
ing, staying focused on the customer. Second, we
select people who, when they wake up in the morn-
ing, are thinking about how to invent on behalf of the
customer. If you like a more competitively focused
culture, you might find us dull. We find our culture
intensely fun. We have an explorer mentality, not a
conqueror mentality.
You’ve generated a lot of attention recently. Is all
the publicity good for you and for Amazon?
I have to be choosy—I do very little. But I do inter-
views because I want customers to understand what
makes us tick, how we operate, what our principles
are. I think customers want to know who they’re do-
ing business with.
And if you don’t talk, how in the world can we mis-
understand you?
Oh, believe me, that wouldn’t stop it.
hbr.org
January–February 2013 harvard business review 85
THE BEST-PERFORMING CEOS IN THE WORLD
A truly stringent standard of excellence takes into account
not only what results CEOs deliver over the long term but
whether they’ve positioned their companies to succeed after
they’ve left the helm. Here are the CEOs whose companies
did very well over their entire tenure (in the top 10% of
our 3,143 CEOs) and also during the three years after their
departure. Many CEOs are not eligible for this list, of course,
because they are still in offi ce or because three years haven’t
passed since they left.
At the top of this ranking we fi nd Tim Koogle, who was the
CEO of Yahoo from 1995 to 2001. His successor, Terry Semel,
increased the company’s market value by $24 billion from
2001 to 2004.
The Legacy Litmus Test
its market capitalization rose by $37 billion. With
his guidance, Air China obtained a 50% share of the
market in major Beijing airports and joined the larg-
est airline alliance in the world.
The World of CEOs Is Not Flat
With a truly global sample to study, we can do a bet-
ter job of comparing countries and regions. This is
a signi� cant advance; for decades most analysis of
CEO performance has been U.S.-centric. Now we’re
able to examine data country by country—and we
� nd real di� erences when we do.
China has been the growth miracle of the past de-
cade, so you might expect CEOs there to have done
very well. We � nd that the opposite is true: Among
the 3,143 CEOs we analyzed, the average rank of
Chinese executives was 176 places lower than the
average rank of U.S. executives. Only three Chinese
companies’ CEOs made the top 100, though 17%
of all the executives studied were from China. The
Chinese leaders we asked about this discrepancy
theorized that as the country’s companies become
more innovation-focused, their performance will
improve.
Likewise, the average rank of Japanese CEOs was
562 places lower than that of their U.S. counterparts,
although this is not a big surprise, since Japan’s econ-
omy has struggled for many years. On the whole, U.S.
CEOs did not shine either, despite holding six of
the top 10 slots. Their average rank was 215 places
lower than Latin American CEOs’, 140 places lower
than Indian CEOs’, and 137 places lower than British
CEOs’. Continental European and U.S. CEOs ranked
about the same. U.S. CEOs have not been as competi-
tive on a global scale as one might think.
One bright spot is Brazil, whose CEOs make up
only 4.5% of the total sample but 9% of the top 100.
They include Roger Agnelli of Vale (#4) and Em-
braer’s Maurício Botelho (#11). Botelho took over
the state-owned company in 1995, when it was
reporting losses of around $300 million a year, and
over the next 12 years, built it into a world-class
competitor. (Interestingly, Brazil is also overrepre-
sented in the bottom 100, suggesting that compa-
nies from that country play a high-risk, high-reward
game.) Another standout is Mexico, whose aver-
age CEO ranked 108 places higher than the average
U.S. CEO.
The national and regional differences get even
more interesting as we turn to the question of why
some CEOs got better results than others.
1 TIM KOOGLE
COMPANY Yahoo
United States
INDUSTRY Information Technology
TENURE 1995–2001
COUNTRY-ADJUSTED TSR
TENURE 566% POST-TENURE 1,041%
INDUSTRY-ADJUSTED TSR
TENURE 559% POST-TENURE 1,076%
MARKET CAP CHANGE
TENURE +14B POST-TENURE +24B
2 V.S. JAIN
COMPANY Steel Authority of India
India
INDUSTRY Materials
TENURE 2002–2006
COUNTRY-ADJUSTED TSR
TENURE 788% POST-TENURE 1,759%
INDUSTRY-ADJUSTED TSR
TENURE 843% POST-TENURE 1,925%
MARKET CAP CHANGE
TENURE +10B POST-TENURE +13B
3 PANGAL JAYENDRA NAYAK
COMPANY Axis Bank
India
INDUSTRY Financial Services
TENURE 2000–2009
COUNTRY-ADJUSTED TSR
TENURE 2,149% POST-TENURE 3,217%
INDUSTRY-ADJUSTED TSR
TENURE 1,984% POST-TENURE 2,674%
MARKET CAP CHANGE
TENURE +4B POST-TENURE +4B
4 JOSÉ EDUARDO
DE BARROS DUTRA
COMPANY Petrobras
Brazil
INDUSTRY Energy
TENURE 2003–2005
COUNTRY-ADJUSTED TSR
TENURE 58% POST-TENURE 243%
INDUSTRY-ADJUSTED TSR
TENURE 201% POST-TENURE 1,329%
MARKET CAP CHANGE
TENURE +67B POST-TENURE +183B
5 MÁRCIO ARTUR
LAURELLI CYPRIANO
COMPANY Bradesco
Brazil
INDUSTRY Financial Services
TENURE 1999–2009
COUNTRY-ADJUSTED TSR
TENURE 36% POST-TENURE 268%
INDUSTRY-ADJUSTED TSR
TENURE 645% POST-TENURE 1,206%
MARKET CAP CHANGE
TENURE +41B POST-TENURE +29B
6 YUN JONG-YONG
COMPANY Samsung Electronics
South Korea
INDUSTRY Information Technology
TENURE 1996–2008
COUNTRY-ADJUSTED TSR
TENURE 1,559% POST-TENURE 471%
INDUSTRY-ADJUSTED TSR
TENURE 1,437% POST-TENURE 380%
MARKET CAP CHANGE
TENURE +128B POST-TENURE +17B
7 DAVID THOMPSON
COMPANY Teck Cominco
Canada
INDUSTRY Materials
TENURE 2001–2005
COUNTRY-ADJUSTED TSR
TENURE 235% POST-TENURE 423%
INDUSTRY-ADJUSTED TSR
TENURE 244% POST-TENURE 422%
MARKET CAP CHANGE
TENURE +8B POST-TENURE +14B
8 CHEE ONN LIM
COMPANY Keppel Corporation
Singapore
INDUSTRY Industrials
TENURE 2000–2008
COUNTRY-ADJUSTED TSR
TENURE 237% POST-TENURE 511%
INDUSTRY-ADJUSTED TSR
TENURE 324% POST-TENURE 756%
MARKET CAP CHANGE
TENURE +5B POST-TENURE +9B
9 JOSÉ SIDNEI
COLOMBO MARTINI
COMPANY CTEEP
Brazil
INDUSTRY Utilities
TENURE 1999–2009
COUNTRY-ADJUSTED TSR
TENURE 2,288% POST-TENURE 2,205%
INDUSTRY-ADJUSTED TSR
TENURE 2,001% POST-TENURE 3,484%
MARKET CAP CHANGE
TENURE +6B POST-TENURE +2B
10 SUBIR RAHA
COMPANY Oil & Natural Gas
India
INDUSTRY Energy
TENURE 2001–2006
COUNTRY-ADJUSTED TSR
TENURE 729% POST-TENURE 394%
INDUSTRY-ADJUSTED TSR
TENURE 915% POST-TENURE 512%
MARKET CAP CHANGE
TENURE +57B POST-TENURE +13B
86 Harvard Business Review January–February 2013
6
Chung Mong-Koo
Company
Hyundai Motor Company
Industry
Automobile
tEnurE
1999–
InsIdEr
total sharEholdEr rEturn
Country Adjusted Industry Adjusted
markEt CapItalIzatIon ChangE
($ bIllIons)
+48
mBa
south korEa
2,024% 2,548%
ovErall rank
7
Y.C. Deveshwar
Company
ITC
Industry
Consumer Goods
tEnurE
1996–
InsIdEr
total sharEholdEr rEturn
Country Adjusted Industry Adjusted
markEt CapItalIzatIon ChangE
($ bIllIons)
+45
mBa
IndIa
3,308% 1,574%
ovErall rank
mBa
11
Maurício Novis
Botelho
Company
Embraer
Industry
Industrials
tEnurE
1995–2007
InsIdEr
total sharEholdEr rEturn
Country Adjusted Industry Adjusted
markEt CapItalIzatIon ChangE
($ bIllIons)
+23
BrazIl
5,881% 2,895%
ovErall rank
12
William J. Doyle
Company
PotashCorp
Industry
Materials
tEnurE
1999–
InsIdEr
total sharEholdEr rEturn
Country Adjusted Industry Adjusted
markEt CapItalIzatIon ChangE
($ bIllIons)
+38
mBa
Canada
862% 1,343%
ovErall rank
16
Graham Mackay
Company
SABMiller
Industry
Consumer Goods
tEnurE
1997–
InsIdEr
total sharEholdEr rEturn
Country Adjusted Industry Adjusted
markEt CapItalIzatIon ChangE
($ bIllIons)
+70
mBa
unItEd kIngdom
758% 626%
ovErall rank
top 5
FEmalE
CEos
1
margarEt C.
WhItman
Company eBay
United States
Industry
Information Technology
tEnurE 1998–2008
total sharEholdEr rEturn
Country Adjusted 1,434%
Industry Adjusted 1,368%
markEt CapItalIzatIon
ChangE +40B
2
dong mIngzhu
Company
Gree Electric Appliances
China
Industry
Consumer Goods
tEnurE 2001–
total sharEholdEr rEturn
Country Adjusted 975%
Industry Adjusted 1,360%
markEt CapItalIzatIon
ChangE +8B
3
Carol mEyroWItz
Company TJX
United States
Industry
Retail
tEnurE 2007–
total sharEholdEr rEturn
Country Adjusted 226%
Industry Adjusted 204%
markEt CapItalIzatIon
ChangE +24B
4
zou lIhua
Company Xinhu Zhongbao
China
Industry
Financial Services
tEnurE 2006–2009
total sharEholdEr rEturn
Country Adjusted 167%
Industry Adjusted 284%
markEt CapItalIzatIon
ChangE +7B
5
hElIanE CanEpa
Company Nobel Biocare
Switzerland
Industry
Health Care
tEnurE 2001–2007
total sharEholdEr rEturn
Country Adjusted 142%
Industry Adjusted 225%
markEt CapItalIzatIon
ChangE +8B
13
ovErall rank
Mikhail Prokhorov
Company
Norilsk Nickel
Industry
Materials
tEnurE
2001–2007
InsIdEr
total sharEholdEr rEturn
Country Adjusted Industry Adjusted
markEt CapItalIzatIon ChangE
($ bIllIons)
+48
mBa
russIa
657% 1,250%
*tIE
5
John C. Martin
Company
Gilead Sciences
Industry
Health Care
tEnurE
1996–
InsIdEr
total sharEholdEr rEturn
Country Adjusted Industry Adjusted
markEt CapItalIzatIon ChangE
($ bIllIons)
+51
mBa
unItEd statEs
2,552% 2,474%
ovErall rank
10
John T. Chambers
Company
Cisco Systems
Industry
Information Technology
tEnurE
1995–
InsIdEr
total sharEholdEr rEturn
Country Adjusted Industry Adjusted
markEt CapItalIzatIon ChangE
($ bIllIons)
+143
mBa
unItEd statEs
564% 873%
ovErall rank
9
Margaret C.
Whitman
Company
eBay
Industry
Information Technology
tEnurE
1998–2008
InsIdEr
total sharEholdEr rEturn
Country Adjusted Industry Adjusted
markEt CapItalIzatIon ChangE
($ bIllIons)
+40
mBa
unItEd statEs
1,434% 1,368%
ovErall rank
8
David Simon
Company
Simon Property Group
Industry
Financial Services
tEnurE
1995–
InsIdEr
total sharEholdEr rEturn
Country Adjusted Industry Adjusted
markEt CapItalIzatIon ChangE
($ bIllIons)
+47
mBa
unItEd statEs
1,199% 1,410%
ovErall rank
13
Subir Raha
Company
Oil & Natural Gas
Industry
Energy
tEnurE
2001–2006
InsIdEr
total sharEholdEr rEturn
Country Adjusted Industry Adjusted
markEt CapItalIzatIon ChangE
($ bIllIons)
+57
mBa
IndIa
729% 915%
ovErall rank
*tIE
15
José Antonio
Fernández
Company
FEMSA
Industry
Consumer Goods
tEnurE
1995–
InsIdEr
total sharEholdEr rEturn
Country Adjusted Industry Adjusted
markEt CapItalIzatIon ChangE
($ bIllIons)
+26
mBa
mExICo
2,788% 1,183%
ovErall rank
HBR.ORG
January–February 2013 Harvard Business Review 87
The BesT-Performing Ceos in The World
What Accounts for success?
Our 2010 article looked at several factors that might
be relevant to good performance (whether CEOs
were hired from inside the company, had an MBA,
and so on). We tracked those factors again, and our
global comparison revealed some insights into dif-
ferences across the world.
The insider-CEO story. Management thinkers
have long debated whether it is better to appoint an
insider as CEO or get someone from the outside to
run the company. But most studies have focused on
U.S. corporations.
In our full sample of 3,143 CEOs, 74% were insid-
ers. India had the lowest proportion (63%) and Japan
the highest (90%). Overall, insiders did better than
outsiders; the insiders’ average rank was 154 places
higher than the outsiders’. This is similar to what we
found in the 2010 global ranking. It didn’t hold true,
however, in major parts of the world. Insiders got
better results in the United States, the United King-
dom, and Latin America, but there was no difference
between insiders and outsiders in continental Eu-
rope, China, and India.
What about the idea that outsiders are prefer-
able when a company is in trouble? We find that
boards—especially in the United States and Europe—
do have a slightly greater tendency than normal to
hire outsiders when the company is underperform-
ing (measured as having an industry-adjusted total
shareholder return of -24% or worse for the two
years before the CEO started). But the results those
outsiders produced varied by region. In the United
States they didn’t get better performance from strug-
gling companies than insiders did. In Europe outsid-
ers did better; the average rank of those who took
over subpar performers was 370 places higher than
the average rank of their insider counterparts.
In Latin America, however, the picture was dif-
ferent: The average rank of insiders who had taken
the helm of poor performers was 750 places higher
than that of outsiders who had. Regional factors help
explain this disparity. A large number of Central and
South American firms are family controlled; another
large segment is government controlled. Business
families—and, in some cases, governments—exer-
cise a strong influence on long-term strategies and
investment decisions, which makes it more difficult
for a CEO who is new to a company to operate.
The upshot: In the United States, outsider CEOs
usually do not deliver the goods, whether the
company is underperforming or not. But this find-
ing can’t be generalized to other parts of the world.
Boards need to keep regional success factors firmly
in mind when selecting CEOs.
The curse of great prior performance. If you
want to create a lot of shareholder value, it pays to
take over a company that hasn’t been doing well—at
least if you’re in the United States, China, India, or
the United Kingdom. In those countries a poorly
performing predecessor is often followed by a high-
performing one. But there is no such effect in conti-
nental Europe, Japan, and Latin America.
The greater continuity in company performance
in Latin America is probably a reflection of the long-
term control exercised by business families, investor
syndicates, and governments, whose visions don’t
change even as CEOs come and go. In Latin America
those parties generally make the important bet-the-
company decisions and policies, while CEOs are
mainly responsible for execution.
An MBA degree. In the wake of the financial
crisis, MBAs were accused of being value destroy-
ers. We supplied the debate with some contrary data
in 2010, showing that the average MBA ranked 40
places higher in the study sample than the average
non-MBA. We saw similar results in this year’s list.
In this case, we did not discover that CEOs of cer-
tain nationalities benefited more from an MBA than
others.
Industry. In general, industry differences count
for very little in our analysis, explaining only about
5% of the variation in CEO performance. That said,
the high-tech industry is overrepresented in the top
10, with five CEOs, including Amazon.com’s. CEOs
from the energy industry, who make up only 5% of
the group studied, are overrepresented in the top
100, where they occupy 15% of the slots.
doing Well and doing good
Many management thinkers argue that it is no longer
enough to do well financially; companies also need
to improve the well-being of (or at least not harm)
the communities in which they operate, the environ-
ment, and their employees. (See, for example, “Cre-
ating Shared Value,” by Michael E. Porter and Mark R.
Kramer, HBR January–February 2011.) That’s the
good news. The bad news is that stellar performance
on both dimensions is no common or easy feat.
This year we examined the correlation between
the financial performance of leaders on our list and
their social and environmental performance as mea-
sured by MSCI, a highly reputable firm that rates
Top 5
Ceos
IndIa
1
Y.C. deVesHWaR
CompanY ITC
IndusTRY Consumer Goods
TenuRe 1996–
ToTal sHaReHoldeR ReTuRn
Country Adjusted 3,308%
Industry Adjusted 1,574%
maRkeT CapITalIzaTIon
CHange +45B
2
suBIR RaHa
CompanY Oil & Natural Gas
IndusTRY Energy
TenuRe 2001–2006
ToTal sHaReHoldeR ReTuRn
Country Adjusted 729%
Industry Adjusted 915%
maRkeT CapITalIzaTIon
CHange +57B
3
mukesH dHIRuBHaI
amBanI
CompanY
Reliance Industries
IndusTRY Energy
TenuRe 2002–
ToTal sHaReHoldeR ReTuRn
Country Adjusted 565%
Industry Adjusted 745%
maRkeT CapITalIzaTIon
CHange +41B
4
a.m. naIk
CompanY
Larsen & Toubro
IndusTRY Industrials
TenuRe 1999–2012
ToTal sHaReHoldeR ReTuRn
Country Adjusted 3,154%
Industry Adjusted 2,728%
maRkeT CapITalIzaTIon
CHange +16B
5
a.k. puRI
CompanY
Bharat Heavy Electricals
IndusTRY Industrials
TenuRe 2004–2008
ToTal sHaReHoldeR ReTuRn
Country Adjusted 471%
Industry Adjusted 664%
maRkeT CapITalIzaTIon
CHange +30B
88 Harvard Business Review January–february 2013
23
Paolo Rocca
Company
Tenaris
Industry
Energy
tEnurE
2002–
InsIdEr
markEt CapItalIzatIon ChangE
($ billions)
+26
mBa
argEntIna
816% 1,138%
ovErall rank
24
Renato Alves Vale
Company
CCR
Industry
industrials
tEnurE
1999–
InsIdErmBa
BrazIl
1,933% 2,658%
ovErall rank
21
lew Frankfort
Company
Coach
Industry
Consumer Goods
tEnurE
1995–
InsIdErmBa
unItEd statEs
2,260% 2,073%
ovErall rank
19
Mark G. Papa
Company
EoG Resources
Industry
Energy
tEnurE
1998–
InsIdErmBa
unItEd statEs
1,428% 1,201%
ovErall rank
total sharEholdEr rEturn
CounTRy AdjusTEd indusTRy AdjusTEd
total sharEholdEr rEturn
CounTRy AdjusTEd indusTRy AdjusTEd
ovErall rank
22
Hugh Grant
Company
Monsanto
Industry
Materials
tEnurE
2003–
InsIdEr
markEt CapItalIzatIon ChangE
($ billions)
+45
mBa
unItEd statEs
781% 632%
ovErall rank
total sharEholdEr rEturn
CounTRy AdjusTEd indusTRy AdjusTEd
total sharEholdEr rEturn
CounTRy AdjusTEd indusTRy AdjusTEd
total sharEholdEr rEturn
CounTRy AdjusTEd indusTRy AdjusTEd
17
li jiaxiang
Company
Air China
Industry
Transportation
tEnurE
2004–2008
InsIdErmBa
ChIna
731% 1,022%
ovErall rank
total sharEholdEr rEturn
CounTRy AdjusTEd indusTRy AdjusTEd
markEt CapItalIzatIon ChangE
($ billions)
+37
18
daniel Hajj
Aboumrad
Company
América Móvil
Industry
Telecommunication
tEnurE
2000–
InsIdErmBa
mExICo
506% 684%
ovErall rank
total sharEholdEr rEturn
CounTRy AdjusTEd indusTRy AdjusTEd
markEt CapItalIzatIon ChangE
($ billions)
+87
20
lars Rebien
sØrensen
Company
novo nordisk
Industry
Health Care
tEnurE
2000–
InsIdErmBa
dEnmark
470% 804%
ovErall rank
total sharEholdEr rEturn
CounTRy AdjusTEd indusTRy AdjusTEd
markEt CapItalIzatIon ChangE
($ billions)
+64
markEt CapItalIzatIon ChangE
($ billions)
+20
markEt CapItalIzatIon ChangE
($ billions)
+25
25
Paul Chisholm
Company
ColT Telecom Group
Industry
Telecommunication
tEnurE
1996–2001
InsIdErmBa
unItEd kIngdom
1,905% 1,761%
ovErall rank
total sharEholdEr rEturn
CounTRy AdjusTEd indusTRy AdjusTEd
markEt CapItalIzatIon ChangE
($ billions)
+20
26
david E.i. Pyott
Company
Allergan
Industry
Health Care
tEnurE
1998–
InsIdErmBa
unItEd statEs
949% 956%
ovErall rank
*tIE
total sharEholdEr rEturn
CounTRy AdjusTEd indusTRy AdjusTEd
markEt CapItalIzatIon ChangE
($ billions)
+25
26
djalma bastos
de Morais
Company
Companhia Energética
de Minas Gerais (CEMiG)
Industry
utilities
tEnurE
1999–
InsIdErmBa
BrazIl
939% 1,649%
ovErall rank
*tIE
total sharEholdEr rEturn
CounTRy AdjusTEd indusTRy AdjusTEd
markEt CapItalIzatIon ChangE
($ billions)
+22
ovErall rank
28
Mukesh dhirubhai
Ambani
Company
Reliance industries
Industry
Energy
tEnurE
2002–
InsIdErmBa
IndIa
565% 745%
total sharEholdEr rEturn
CounTRy AdjusTEd indusTRy AdjusTEd
markEt CapItalIzatIon ChangE
($ billions)
+41
markEt CapItalIzatIon ChangE
($ billions)
+19
HbR.oRG
January–February 2013 Harvard business Review 89
top 5
CEos
EuropE
1
graham maCkay
Company SABMiller
United Kingdom
Industry Consumer Goods
tEnurE 1997–
total sharEholdEr rEturn
Country Adjusted 758%
Industry Adjusted 626%
markEt CapItalIzatIon
ChangE +70B
2
lars rEBIEn
sØrEnsEn
Company Novo Nordisk
Denmark
Industry Health Care
tEnurE 2000–
total sharEholdEr rEturn
Country Adjusted 470%
Industry Adjusted 804%
markEt CapItalIzatIon
ChangE +64B
3
paul ChIsholm
Company
COLT Telecom Group
United Kingdom
Industry Telecommunication
tEnurE 1996–2001
total sharEholdEr rEturn
Country Adjusted 1,905%
Industry Adjusted 1,761%
markEt CapItalIzatIon
ChangE +20B
4
garEth davIs
Company Imperial Tobacco
United Kingdom
Industry Consumer Goods
tEnurE 1996–2010
total sharEholdEr rEturn
Country Adjusted 977%
Industry Adjusted 579%
markEt CapItalIzatIon
ChangE +27B
5
mIkaEl lIlIus
Company Fortum
Finland
Industry Utilities
tEnurE 2000–2009
total sharEholdEr rEturn
Country Adjusted 768%
Industry Adjusted 1,014%
markEt CapItalIzatIon
ChangE +22B
ADIDAS
HERBERT HAINER
INDITEX
PABLO ISLA ÁLVAREZ
DE TEJERA
HERMÈS
PATRICK THOMAS
EATON
ALEXANDER
CUTLER
2010 RANKING
DANONE
FRANCK RIBOUD
NATURA
ALESSANDRO
CARLUCCI
THE BEST-PERFORMING CEOS IN THE WORLD
major companies. Despite all the rhetoric, we discov-
ered that the correlation between the two sets of data
is, well, zero. You can see this clearly in the exhibit
“Does Doing Good Help CEOs Do Well?” Companies
are scattered all over this chart. Though many articles
suggest that responsible corporate behavior—say, in
sustainability—will automatically improve your bot-
tom line, clearly it’s not as simple as that. Some com-
panies probably aren’t managing with such issues in
mind. Some may not have attractive social or envi-
ronmental strategies; some may have misalignment
between those strategies and the overall corporate
strategy; and some may have incomplete measures
of social or environmental practices.
But the chart did reveal outliers. Five percent of
the CEOs for which we had su� cient data fell into
the box at the top right; they delivered great � nancial
performance year over year and performed strongly
on social and environmental dimensions. It is a rare
achievement, indeed, but it is possible.
These trendsetting CEOs are the new role models
for leaders pursuing the paradigm of creating shared
value. One example: Franck Riboud of Danone, a
French multinational with $27 billion in annual sales.
Danone’s excellent financial performance earned
Does Doing Good Help CEOs Do Well?
SOURCE BEST-PERFORMING CEOS SCORECARD DATA,
2013; MSCI ESG INTANGIBLE VALUE ASSESSMENTS,
2006–2010
This chart maps the long-term fi nancial performance of some
1,100 CEOs against their companies’ social and environmental
performance for their last two years in offi ce. As the rela-
tively even scattering of points across the chart shows, there
is no overall correlation between fi nancial results and social
responsibility. However, the chart does reveal numerous role
models, who excelled in both areas.
WORST BESTSHAREHOLDER PERFORMANCE RANK
W
O
R
ST
B
ES
TIDEALISTSIDEALISTS
LAGGARDSLAGGARDSLAGGARDS
EXPLOITERSEXPLOITERSEXPLOITERS
TRENDSETTERSTRENDSETTERSTRENDSETTERS
SO
C
IA
L
&
E
N
V
IR
O
N
M
EN
TA
L
P
ER
FO
R
M
A
N
C
E
SOCIALLY RESPONSIBLE
CEOS ON THE RISE
Four CEOs whose fi rms received high ratings for
social responsibility moved into the top 15% of
fi nancial performers in the 2013 study, joining role
models from Natura and Danone.
DETAIL
him a spot in the top 10% of this year’s sample (a
truly amazing achievement for a consumer goods
company); at the same time, the company received
extremely high ratings from MSCI. Another outlier
is Natura’s Alessandro Carlucci (who made the top
6% for � nancial performance), a leader among CEOs
who believe that alleviating poverty and inequality
and protecting the environment are intimately tied
to their business agendas. Carlucci and Riboud have
both confronted the key social or environmental is-
sue in their industry (in Danone’s case, obesity and
unhealthful food consumption; in Natura’s, defores-
tation and poverty) and redirected their company’s
strategy to tackle it.
We also looked at CEOs whose companies had
high social and environmental performance in 2010
but whose � nancial performance kept them out of
the top 15% of the group studied that year. Since do-
ing both well and good can be a long-term strategy,
we wanted to see whether any of those CEOs had
then moved into the top 15% of the current � nancial
ranking. We found four: the leaders of Adidas, Indi-
tex, Hermès International, and Eaton.
At Adidas, CEO Herbert Hainer oversaw the im-
plementation of a triple-bottom-line philosophy, a
2013 RANKING
90 Harvard Business Review January–February 2013
Top 5
Ceos
China
1
Li Jiaxiang
Company Air China
indusTry Transportation
Tenure 2004–2008
ToTaL sharehoLder reTurn
Country Adjusted 731%
Industry Adjusted 1,022%
markeT CapiTaLizaTion
Change +37B
2
Wang dongming
Company Citic Securities
indusTry Financial Services
Tenure 2002–
ToTaL sharehoLder reTurn
Country Adjusted 537%
Industry Adjusted 861%
markeT CapiTaLizaTion
Change +12B
3
dong mingzhu
Company
Gree Electric Appliances
indusTry Consumer Goods
Tenure 2001–
ToTaL sharehoLder reTurn
Country Adjusted 975%
Industry Adjusted 1,360%
markeT CapiTaLizaTion
Change +8B
4
Li Jianhong
Company
China International
Marine Containers
indusTry Industrials
Tenure 1995–2007
ToTaL sharehoLder reTurn
Country Adjusted 2,686%
Industry Adjusted 3,426%
markeT CapiTaLizaTion
Change +5B
5
Che shuChun
Company
Shanxi Xishan Coal and
Electricity Power
indusTry Energy
Tenure 2007–2010
ToTaL sharehoLder reTurn
Country Adjusted 354%
Industry Adjusted 414%
markeT CapiTaLizaTion
Change +9B
29
Manoel Arlindo
Zaroni Torres
Company
Tractebel Energia
indusTry
Utilities
Tenure
1999–
insidermBa
BraziL
3,171% 2,585%
overaLL rank
ToTaL sharehoLder reTurn
CoUnTry AdjUsTEd IndUsTry AdjUsTEd
30
Mark donegan
Company
Precision Castparts
indusTry
Industrials
Tenure
2002–
insidermBa
uniTed sTaTes
1,237% 1,190%
overaLL rank
ToTaL sharehoLder reTurn
CoUnTry AdjUsTEd IndUsTry AdjUsTEd
31
William E. Greehey
Company
Valero Energy
indusTry
Energy
Tenure
1997–2005
insidermBa
uniTed sTaTes
721% 629%
overaLL rank
ToTaL sharehoLder reTurn
CoUnTry AdjUsTEd IndUsTry AdjUsTEd
32
A.M. naik
Company
Larsen & Toubro
indusTry
Industrials
Tenure
1999–2012
insidermBa
india
3,154% 2,728%
overaLL rank
ToTaL sharehoLder reTurn
CoUnTry AdjUsTEd IndUsTry AdjUsTEd
34
Mikael Lilius
Company
Fortum
indusTry
Utilities
Tenure
2000–2009
insidermBa
FinLand
768% 1,014%
overaLL rank
ToTaL sharehoLder reTurn
CoUnTry AdjUsTEd IndUsTry AdjUsTEd
37
david C. novak
Company
yum Brands
indusTry
Consumer Goods
Tenure
2000–
insidermBa
uniTed sTaTes
658% 567%
overaLL rank
ToTaL sharehoLder reTurn
CoUnTry AdjUsTEd IndUsTry AdjUsTEd
38
A.K. Puri
Company
Bharat Heavy Electricals
indusTry
Industrials
Tenure
2004–2008
insidermBa
india
471% 664%
overaLL rank
ToTaL sharehoLder reTurn
CoUnTry AdjUsTEd IndUsTry AdjUsTEd
39
Fu Chengyu
Company
CnooC
indusTry
Energy
Tenure
2003–2011
insidermBa
hong kong
448% 395%
overaLL rank
ToTaL sharehoLder reTurn
CoUnTry AdjUsTEd IndUsTry AdjUsTEd
40
john rowe
Company
Aetna
indusTry
Health Care
Tenure
2000–2006
insidermBa
uniTed sTaTes
679% 566%
overaLL rank
ToTaL sharehoLder reTurn
CoUnTry AdjUsTEd IndUsTry AdjUsTEd
markeT CapiTaLizaTion Change
($ BILLIons)
+18
markeT CapiTaLizaTion Change
($ BILLIons)
+21
markeT CapiTaLizaTion Change
($ BILLIons)
+36
markeT CapiTaLizaTion Change
($ BILLIons)
+16
33
Gareth davis
Company
Imperial Tobacco
indusTry
Consumer Goods
Tenure
1996–2010
insidermBa
uniTed kingdom
977% 579%
overaLL rank
ToTaL sharehoLder reTurn
CoUnTry AdjUsTEd IndUsTry AdjUsTEd
markeT CapiTaLizaTion Change
($ BILLIons)
+27
markeT CapiTaLizaTion Change
($ BILLIons)
+22
35
Eric E. schmidt
Company
Google
indusTry
Information Technology
Tenure
2001–2011
insidermBa
uniTed sTaTes
448% 401%
overaLL rank
ToTaL sharehoLder reTurn
CoUnTry AdjUsTEd IndUsTry AdjUsTEd
markeT CapiTaLizaTion Change
($ BILLIons)
+143
36
Masahiro sakane
Company
Komatsu
indusTry
Industrials
Tenure
2003–2007
insidermBa
Japan
652% 493%
overaLL rank
ToTaL sharehoLder reTurn
CoUnTry AdjUsTEd IndUsTry AdjUsTEd
markeT CapiTaLizaTion Change
($ BILLIons)
+40
markeT CapiTaLizaTion Change
($ BILLIons)
+31
markeT CapiTaLizaTion Change
($ BILLIons)
+30
markeT CapiTaLizaTion Change
($ BILLIons)
+83
markeT CapiTaLizaTion Change
($ BILLIons)
+27
HBr.orG
January–February 2013 Harvard Business review 91
THE BEST-PERFORMING CEOS IN THE WORLD
massive push to slash the company’s carbon foot-
print, and the increased use of recycled polyester as
well as sustainably farmed cotton in products. One
of Adidas’s latest sustainable innovations is DryDye
technology, which removes the need for water in
the dyeing process. At Eaton, Alexander Cutler has
embedded sustainability into the company’s culture
and practices. The diversi� ed power management
company develops innovative products and pro-
cesses, such as hybrid electric and hydraulic power
trains and electric power control systems, that help
customers and consumers conserve resources and
reduce their carbon footprint.
This new breed of leaders not only rejects the
idea that � nancial market demands are more impor-
tant than stakeholders’ needs but also demonstrates
that companies can excel at meeting both. These
CEOs have shown the way, and others can learn
from them.
We don’t foresee a time in the near future when
measures of social performance will be as objective
as the measure of long-term � nancial performance
we’ve developed. That said, we will continue to
track how CEOs are doing in the two areas, with the
aim of encouraging leaders to shine in both.
EVERYONE IN the business world seems to agree that
executives should be less obsessed with quarterly
earnings and more focused on the long term—every-
one, that is, except the decision makers who hire and
� re executives and the people who buy and sell com-
pany stock. The short-term emphasis won’t change
until a new paradigm for evaluating performance
emerges. Talk alone won’t bring about that change;
we also need a whole new method of evaluating
CEOs. Here, we’re proposing two key improvements:
a robust, objective measure of leaders’ performance
over their full terms in o� ce, benchmarking all chief
executives of major global companies; and an assess-
ment of the correlation between a � rm’s � nancial re-
sults and its environmental and social practices. We
hope that boards of directors, pension funds, hedge
funds, and other shareholder activists will use these
measures to better evaluate CEOs and to guide the
selection of tomorrow’s leaders.
HBR Reprint R1301F
Metrics. We pulled fi nancial data
from Datastream and Worldscope
and calculated daily company
returns for the entire length of each
CEO’s tenure (or until August 31,
2012, if the CEO was still in of-
fi ce). We calculated three sets of
numbers:
Country-adjusted company
returns. We computed a company’s
total shareholder return (including
dividends reinvested) for the CEO’s
tenure. We then computed the aver-
age return for other fi rms from the
same country over the same period
and subtracted that fi gure from the
company’s return. This measure
thus excludes any increase in stock
return that is merely attributable to
an improvement in the general stock
market of a country.
Industry-adjusted company
returns. We also deducted the
average return for the industry, to
exclude any increases that were
the result of rising fortunes for the
overall industry.
Market capitalization change.
We measured the change in the
company’s equity market capitaliza-
tion over the CEO’s tenure. We ad-
justed this fi gure for infl ation in each
country and translated values into
U.S. dollars, using 2011 exchange
rates. We added to this number
the infl ation-adjusted value of the
dividends and shares repurchased,
and subtracted the adjusted value of
shares issued.
We then ranked all CEOs for
each metric—from 1 (best) to 3,143
(worst)—and calculated the average
of the three rankings for every CEO
to create the fi nal overall ranking.
Using three metrics is a balanced
and robust approach: While the fi rst
two metrics risk being skewed to-
ward smaller companies (it’s easier
to get large returns if you start from
a small base), the third is skewed
toward larger companies.
Analysis. We performed regres-
sion analysis on the data set of 3,143
CEOs. This allowed us to “control”
for some factors and isolate the ef-
fect that one factor (such as having
an MBA) had on a CEO’s standing in
the ranking. Signifi cant eff ects are
reported in this article.
How We Created the Scorecard
We selected the CEOs we tracked from the following indexes:
• S&P Global 1200, 1997–2010
• S&P CNX 500, 1998–2010 (for India)
• Shanghai and Shenzhen Stock Exchanges, 1998–2010
• MSCI Emerging Markets Latin America Index and
AméricaEconomía 500, 2002–2010
• S&P BRIC 40, 1997–2010
To make sure we had reliable and suffi cient data, we
excluded CEOs who had assumed their role before 1995 or
after August 31, 2010. (For example, Tim Cook of Apple is
not eligible because he became CEO in 2011.) And we in-
cluded only those whose tenure lasted more than two years.
All told, we ended up with 3,143 CEOs from 1,862 companies,
of whom 1,007 were still in offi ce on the date we stopped
measuring performance. The entire group represented 64
nationalities and came from companies based in 37 countries.
Nana von Bernuth, project manager,
led the eff ort to create and analyze the
ranking.
Morten T. Hansen is a management professor at the
University of California, Berkeley, School of Information,
and at Insead, in Fontainebleau, France. Herminia Ibarra is
the Cora Chaired Professor of Leadership and Learning and
a professor of organizational behavior at Insead. Urs Peyer
is an associate professor of fi nance at Insead.
92 Harvard Business Review January–February 2013
Top 5
Ceos
LaTin
ameriCa
45
Oscar González
Rocha
Company
Southern Copper
indusTry
Materials
Tenure
2004–
insider
markeT CapiTaLizaTion Change
($ billions)
+39
mBa
mexiCo
411% 530%
overaLL rank
1
roger agneLLi
Company Vale
Brazil
indusTry Materials
Tenure 2001–2011
ToTaL sharehoLder reTurn
Country Adjusted 934%
Industry Adjusted 1,773%
markeT CapiTaLizaTion
Change +157B
2
maurÍCio novis
BoTeLho
Company Embraer
Brazil
indusTry Industrials
Tenure 1995–2007
ToTaL sharehoLder reTurn
Country Adjusted 5,881%
Industry Adjusted 2,895%
markeT CapiTaLizaTion
Change +23B
3
JosÉ anTonio
FernÁndez
Company FEMSA
Mexico
indusTry Consumer Goods
Tenure 1995–
ToTaL sharehoLder reTurn
Country Adjusted 2,788%
Industry Adjusted 1,183%
markeT CapiTaLizaTion
Change +26B
4
danieL haJJ
aBoumrad
Company América Móvil
Mexico
indusTry Telecommunication
Tenure 2000–
ToTaL sharehoLder reTurn
Country Adjusted 506%
Industry Adjusted 684%
markeT CapiTaLizaTion
Change +87B
o
5
paoLo roCCa
Company Tenaris
Argentina
indusTry Energy
Tenure 2002–
ToTaL sharehoLder reTurn
Country Adjusted 816%
Industry Adjusted 1,138%
markeT CapiTaLizaTion
Change +26B
816 1,138 26
26278.10368
For more
on The Ceos
go To
hBr.org
46
Bart Becht
Company
Reckitt Benckiser
indusTry
Consumer Goods
Tenure
1999–2011
insider
markeT CapiTaLizaTion Change
($ billions)
+44
mBa
uniTed kingdom
467% 420%
overaLL rank
41
John W. Thompson
Company
Symantec
indusTry
Information Technology
Tenure
1999–2009
insider
markeT CapiTaLizaTion Change
($ billions)
+21
mBa
uniTed sTaTes
838% 851%
overaLL rank
ToTaL sharehoLder reTurn
COunTRy AdJuSTed InduSTRy AdJuSTed
42
Pietro Franco Tali
Company
Saipem
indusTry
energy
Tenure
2000–
insider
markeT CapiTaLizaTion Change
($ billions)
+21
mBa
iTaLy
706% 924%
overaLL rank
ToTaL sharehoLder reTurn
COunTRy AdJuSTed InduSTRy AdJuSTed
43
Company
express Scripts
indusTry
Health Care
Tenure
2005–
insider
markeT CapiTaLizaTion Change
($ billions)
+48
mBa
uniTed sTaTes
448% 442%
overaLL rank
George Paz
ToTaL sharehoLder reTurn
COunTRy AdJuSTed InduSTRy AdJuSTed
44
Robert L. Tillman
Tenure
1996–2005
insidermBa
uniTed sTaTes
overaLL rank
Company
Lowe’s
indusTry
Retail
markeT CapiTaLizaTion Change
($ billions)
+44
459% 456%
ToTaL sharehoLder reTurn
COunTRy AdJuSTed InduSTRy AdJuSTed
ToTaL sharehoLder reTurn
COunTRy AdJuSTed InduSTRy AdJuSTed
ToTaL sharehoLder reTurn
COunTRy AdJuSTed InduSTRy AdJuSTed
47
david B. Snow Jr.
Company
Medco Health
Solution
s
indusTry
Health Care
Tenure
2003–2012
insider
markeT CapiTaLizaTion Change
($ billions)
+33
mBa
uniTed sTaTes
515% 455%
overaLL rank
ToTaL sharehoLder reTurn
COunTRy AdJuSTed InduSTRy AdJuSTed
48
James d. Taiclet Jr.
Company
American Tower
indusTry
Telecommunication
Tenure
2003–
insider
markeT CapiTaLizaTion Change
($ billions)
+29
mBa
uniTed sTaTes
554% 485%
overaLL rank
ToTaL sharehoLder reTurn
COunTRy AdJuSTed InduSTRy AdJuSTed
49
Tomeo Kanbayashi
Company
nTT data
indusTry
Information Technology
Tenure
1995–1999
insider
markeT CapiTaLizaTion Change
($ billions)
+30
mBa
Japan
658% 406%
overaLL rank
ToTaL sharehoLder reTurn
COunTRy AdJuSTed InduSTRy AdJuSTed
50
Shafagat Fakhrazo-
vich Takhautdinov
Company
Tatneft
indusTry
energy
Tenure
1999–
insider
markeT CapiTaLizaTion Change
($ billions)
+14
mBa
russia
983% 1,285%
overaLL rank
ToTaL sharehoLder reTurn
COunTRy AdJuSTed InduSTRy AdJuSTed
HBR.ORG
January–February 2013 Harvard Business Review 93
The BesT-Performing Ceos in The World
51
Tim SolSo
Company Cummins
United States
induSTry Industrials
Tenure 2000–2011
mBa Yes
inSider Yes
ToTal Shareholder reTurn
Country Adjusted 847%
Industry Adjusted 734%
markeT CapiTalizaTion
Change +16B
52
paBlo iSla
Álvarez de Tejera
Company Inditex
Spain
induSTry Retail
Tenure 2005–
mBa No
inSider No
ToTal Shareholder reTurn
Country Adjusted 369%
Industry Adjusted 340%
markeT CapiTalizaTion
Change +61B
53
mark C. pigoTT
Company PACCAR
United States
induSTry Industrials
Tenure 1997–
mBa No
inSider Yes
ToTal Shareholder reTurn
Country Adjusted 729%
Industry Adjusted 745%
markeT CapiTalizaTion
Change +17B
54
Frank Chapman
Company BG Group
United Kingdom
induSTry Energy
Tenure 2000–
mBa No
inSider Yes
ToTal Shareholder reTurn
Country Adjusted 408%
Industry Adjusted 315%
markeT CapiTalizaTion
Change +58B
55
marShall o. larSen
Company Goodrich
United States
induSTry Industrials
Tenure 2003–2012
mBa No
inSider Yes
ToTal Shareholder reTurn
Country Adjusted 887%
Industry Adjusted 773%
markeT CapiTalizaTion
Change +15B
56
philip g. Cox
Company International Power
United Kingdom
induSTry Utilities
Tenure 2003–
mBa No
inSider Yes
ToTal Shareholder reTurn
Country Adjusted 442%
Industry Adjusted 380%
markeT CapiTalizaTion
Change +33B
57
john C.S. lau
Company Husky Energy
Canada
induSTry Energy
Tenure 2000–2010
mBa No
inSider Yes
ToTal Shareholder reTurn
Country Adjusted 437%
Industry Adjusted 553%
markeT CapiTalizaTion
Change +23B
58
STanley Fink
Company Man Group
United Kingdom
induSTry Financial Services
Tenure 2000–2007
mBa No
inSider Yes
ToTal Shareholder reTurn
Country Adjusted 618%
Industry Adjusted 731%
markeT CapiTalizaTion
Change +17B
59
a.j. SCheepBouwer
Company Royal KPN
Netherlands
induSTry Telecommunication
Tenure 2001–2011
mBa No
inSider Yes
ToTal Shareholder reTurn
Country Adjusted 283%
Industry Adjusted 459%
markeT CapiTalizaTion
Change +40B
60
ChriSTopher m.
Connor
Company Sherwin-Williams
United States
induSTry Retail
Tenure 1999–
mBa No
inSider Yes
ToTal Shareholder reTurn
Country Adjusted 747%
Industry Adjusted 737%
markeT CapiTalizaTion
Change +16B
61
Benjamin
STeinBruCh
Company CSN
Brazil
induSTry Materials
Tenure 2002–
mBa No
inSider Yes
ToTal Shareholder reTurn
Country Adjusted 666%
Industry Adjusted 1,058%
markeT CapiTalizaTion
Change +14B
62
william a. oSBorn
Company Northern Trust
United States
induSTry Financial Services
Tenure 1995–2008
mBa Yes
inSider Yes
ToTal Shareholder reTurn
Country Adjusted 552%
Industry Adjusted 604%
markeT CapiTalizaTion
Change +19B
63
miguel gomeS
pereira SarmienTo
guTierrez
Company Lojas Americanas
Brazil
induSTry Retail
Tenure 2001–
mBa Yes
inSider Yes
ToTal Shareholder reTurn
Country Adjusted 7,500%
Industry Adjusted 7,576%
markeT CapiTalizaTion
Change +9B
64
kong Qingping
Company China Overseas
Land and Investment
Hong Kong
induSTry Financial Services
Tenure 2001–2007
mBa Yes
inSider Yes
ToTal Shareholder reTurn
Country Adjusted 1,416%
Industry Adjusted 1,303%
markeT CapiTalizaTion
Change +11B
65 *Tie
Sunil BharTi miTTal
Company Bharti Airtel
India
induSTry Telecommunication
Tenure 1995–
mBa No
inSider Yes
ToTal Shareholder reTurn
Country Adjusted 562%
Industry Adjusted 737%
markeT CapiTalizaTion
Change +16B
65 *Tie
peTer marrone
Company Yamana Gold
Canada
induSTry Materials
Tenure 2003–
mBa No
inSider Yes
ToTal Shareholder reTurn
Country Adjusted 849%
Industry Adjusted 1,185%
markeT CapiTalizaTion
Change +12B
67
ronald l.
havner jr.
Company Public Storage
United States
induSTry Other
Tenure 2002–
mBa No
inSider Yes
ToTal Shareholder reTurn
Country Adjusted 501%
Industry Adjusted 390%
markeT CapiTalizaTion
Change +24B
68 *Tie
Sidney Toledano
Company Christian Dior
France
induSTry Consumer Goods
Tenure 1998–
mBa No
inSider Yes
ToTal Shareholder reTurn
Country Adjusted 435%
Industry Adjusted 327%
markeT CapiTalizaTion
Change +31B
68 *Tie
paTriCk darold
daniel
Company Enbridge
Canada
induSTry Energy
Tenure 2001–
mBa No
inSider Yes
ToTal Shareholder reTurn
Country Adjusted 355%
Industry Adjusted 511%
markeT CapiTalizaTion
Change +24B
70
71
r. david yoST
Company AmerisourceBergen
United States
induSTry Health Care
Tenure 1997–2011
mBa Yes
inSider Yes
ToTal Shareholder reTurn
Country Adjusted 579%
Industry Adjusted 625%
markeT CapiTalizaTion
Change +16B
72
paTriCk ThomaS
Company
Hermès International
France
induSTry Consumer Goods
Tenure 2003–
mBa No
inSider Yes
ToTal Shareholder reTurn
Country Adjusted 465%
Industry Adjusted 321%
markeT CapiTalizaTion
Change +28B
73
manFred wennemer
Company Continental
Germany
induSTry Automobile
Tenure 2001–2008
mBa Yes
inSider Yes
ToTal Shareholder reTurn
Country Adjusted 553%
Industry Adjusted 958%
markeT CapiTalizaTion
Change +14B
74
C. john wilder
Company TXU
United States
induSTry Utilities
Tenure 2004–2007
mBa Yes
inSider No
ToTal Shareholder reTurn
Country Adjusted 397%
Industry Adjusted 313%
markeT CapiTalizaTion
Change +33B
75
pedro
wongTSChowSki
Company Ultrapar
Brazil
induSTry Energy
Tenure 2007–
mBa No
inSider Yes
ToTal Shareholder reTurn
Country Adjusted 763%
Industry Adjusted 840%
markeT CapiTalizaTion
Change +19B
joÃo mauriCio
giFFoni de CaSTro
neveS
Company Ambev
Brazil
induSTry Consumer Goods
Tenure 2009–
mBa Yes
inSider Yes
ToTal Shareholder reTurn
Country Adjusted 276%
Industry Adjusted 297%
markeT CapiTalizaTion
Change +99B
94 Harvard Business Review January–february 2013
76
Kenneth W.
Freeman
Company Quest Diagnostics
United States
Industry Health Care
tenure 1996–2004
mBa Yes
InsIder Yes
total shareholder return
Country Adjusted 1,014%
Industry Adjusted 1,102%
marKet CapItalIzatIon
Change +11B
77
thomas p. maC
mahon
Company Laboratory Corp. of
America Holdings
United States
Industry Health Care
tenure 1997–2006
mBa Yes
InsIder No
total shareholder return
Country Adjusted 869%
Industry Adjusted 959%
marKet CapItalIzatIon
Change +11B
78
phIlIp K.r. pasCall
Company
First Quantum Minerals
Canada
Industry Materials
tenure 1996–
mBa Yes
InsIder No
total shareholder return
Country Adjusted 1,917%
Industry Adjusted 2,687%
marKet CapItalIzatIon
Change +9B
79
terry leahy
Company Tesco
United Kingdom
Industry Retail
tenure 1997–2011
mBa No
InsIder Yes
total shareholder return
Country Adjusted 293%
Industry Adjusted 304%
marKet CapItalIzatIon
Change +49B
80
BlaKe W.
nordstrom
Company Nordstrom
United States
Industry Retail
tenure 2000–
mBa No
InsIder Yes
total shareholder return
Country Adjusted 717%
Industry Adjusted 615%
marKet CapItalIzatIon
Change +14B
81 *tIe
tIm Koogle
Company Yahoo
United States
Industry
Information Technology
tenure 1995–2001
mBa No
InsIder N0
total shareholder return
Country Adjusted 566%
Industry Adjusted 559%
marKet CapItalIzatIon
Change +14B
81 *tIe
roy gardner
Company Centrica
United Kingdom
Industry Utilities
tenure 1997–2006
mBa No
InsIder Yes
total shareholder return
Country Adjusted 342%
Industry Adjusted 496%
marKet CapItalIzatIon
Change +20B
83 *tIe
Wang dongmIng
Company Citic Securities
China
Industry Financial Services
tenure 2002–
mBa No
InsIder Yes
total shareholder return
Country Adjusted 537%
Industry Adjusted 861%
marKet CapItalIzatIon
Change +12B
83 *tIe
mIng-KaI tsaI
Company MediaTek
Taiwan
Industry Information
Technology
tenure 1997–
mBa No
InsIder No
total shareholder return
Country Adjusted 423%
Industry Adjusted 648%
marKet CapItalIzatIon
Change +15B
85
marCelo aWad
Company Antofagasta
Chile
Industry Materials
tenure 2004–2012
mBa No
InsIder Yes
total shareholder return
Country Adjusted 464%
Industry Adjusted 394%
marKet CapItalIzatIon
Change +19B
96
paul Walsh
Company Diageo
United Kingdom
Industry Consumer Goods
tenure 2000–
mBa No
InsIder Yes
total shareholder return
Country Adjusted 332%
Industry Adjusted 200%
marKet CapItalIzatIon
Change +61B
97
John mCadam
Company
Imperial Chemical Industries
United Kingdom
Industry Materials
tenure 2003–2008
mBa No
InsIder Yes
total shareholder return
Country Adjusted 505%
Industry Adjusted 557%
marKet CapItalIzatIon
Change +13B
98
dong mIngzhu
Company
Gree Electric Appliances
China
Industry Consumer Goods
tenure 2001–
mBa Yes
InsIder Yes
total shareholder return
Country Adjusted 975%
Industry Adjusted 1,360%
marKet CapItalIzatIon
Change +8B
99
Jon FredrIK
BaKsaas
Company Telenor
Norway
Industry Telecommunication
tenure 2002–
mBa No
InsIder Yes
total shareholder return
Country Adjusted 206%
Industry Adjusted 464%
marKet CapItalIzatIon
Change +27B
100
noBuo Katsumata
Company Marubeni
Japan
Industry Industrials
tenure 2003–2008
mBa No
InsIder Yes
total shareholder return
Country Adjusted 516%
Industry Adjusted 416%
marKet CapItalIzatIon
Change +14B
91
merrIll a.
mIller Jr.
Company
National Oilwell Varco
United States
Industry Energy
tenure 2001–
mBa Yes
InsIder Yes
total shareholder return
Country Adjusted 329%
Industry Adjusted 273%
marKet CapItalIzatIon
Change +30B
92 *tIe
ronald alVIn
Brenneman
Company Petro-Canada
Canada
Industry Energy
tenure 2000–2009
mBa No
InsIder Yes
total shareholder return
Country Adjusted 314%
Industry Adjusted 409%
marKet CapItalIzatIon
Change +21B
92 *tIe
phIlIppe VarIn
Company Corus
United Kingdom
Industry Materials
tenure 2003–2009
mBa No
InsIder No
total shareholder return
Country Adjusted 799%
Industry Adjusted 761%
marKet CapItalIzatIon
Change +10B
94
harry roels
Company RWE
Germany
Industry Utilities
tenure 2003–2007
mBa No
InsIder No
total shareholder return
Country Adjusted 206%
Industry Adjusted 312%
marKet CapItalIzatIon
Change +62B
95
gÉrard mestrallet
Company Suez
France
Industry Utilities
tenure 1995–2008
mBa No
InsIder Yes
total shareholder return
Country Adjusted 163%
Industry Adjusted 388%
marKet CapItalIzatIon
Change +70B
86
Wang JIanzhou
Company China Mobile
Hong Kong
Industry Telecommunication
tenure 2004–2010
mBa No
InsIder Yes
total shareholder return
Country Adjusted 218%
Industry Adjusted 266%
marKet CapItalIzatIon
Change +189B
87
naVeen JIndal
Company Jindal Steel & Power
India
Industry Materials
tenure 1998–
mBa Yes
InsIder Yes
total shareholder return
Country Adjusted 7,315%
Industry Adjusted 5,704%
marKet CapItalIzatIon
Change +7B
88
grant alFred KIng
Company Origin Energy
Australia
Industry Energy
tenure 2000–
mBa No
InsIder Yes
total shareholder return
Country Adjusted 985%
Industry Adjusted 1,673%
marKet CapItalIzatIon
Change +8B
89
V.s. JaIn
Company
Steel Authority of India
India
Industry Materials
tenure 2002–2006
mBa No
InsIder Yes
total shareholder return
Country Adjusted 788%
Industry Adjusted 843%
marKet CapItalIzatIon
Change +10B
90
mattheW K. rose
Company
Burlington Northern Santa Fe
United States
Industry Industrials
tenure 2000–
mBa No
InsIder Yes
total shareholder return
Country Adjusted 364%
Industry Adjusted 252%
marKet CapItalIzatIon
Change +31B
HBR.ORG
January–February 2013 Harvard Business Review 95
Harvard Business Review Notice of Use Restrictions, May 2009
Harvard Business Review and Harvard Business Publishing
Newsletter content on EBSCOhost is licensed for
the private individual use of authorized EBSCOhost users. It is
not intended for use as assigned course material
in academic institutions nor as corporate learning or training
materials in businesses. Academic licensees may
not use this content in electronic reserves, electronic course
packs, persistent linking from syllabi or by any
other means of incorporating the content into course resources.
Business licensees may not host this content on
learning management systems or use persistent linking or other
means to incorporate the content into learning
management systems. Harvard Business Publishing will be
pleased to grant permission to make this content
available through such means. For rates and permission, contact
[email protected]

More Related Content

Similar to The knock on most business leaders is that they don’t take the.docx

EntrepreneurialMINDSETWalter Jofre Jr.Entrepreneurial .docx
EntrepreneurialMINDSETWalter Jofre Jr.Entrepreneurial .docxEntrepreneurialMINDSETWalter Jofre Jr.Entrepreneurial .docx
EntrepreneurialMINDSETWalter Jofre Jr.Entrepreneurial .docxgreg1eden90113
 
What impact does Customer Management have on Business Performance
What impact does Customer Management have on Business PerformanceWhat impact does Customer Management have on Business Performance
What impact does Customer Management have on Business PerformanceDoug Leather
 
Crafting Data Driven Buyer Personas
Crafting Data Driven Buyer PersonasCrafting Data Driven Buyer Personas
Crafting Data Driven Buyer PersonasLeadMD
 
Info Week Sfsf 21610 Pr
Info Week Sfsf 21610 PrInfo Week Sfsf 21610 Pr
Info Week Sfsf 21610 Prukumarsanghi
 
[Salterbaxter Directions] Moving The Goal Posts
[Salterbaxter Directions] Moving The Goal Posts[Salterbaxter Directions] Moving The Goal Posts
[Salterbaxter Directions] Moving The Goal PostsMSL
 
Accounting Research Paper revised
Accounting Research Paper revisedAccounting Research Paper revised
Accounting Research Paper revisedRob Simmons
 
(280) the dias focused growth portfolio – under the hood
(280)   the dias focused growth portfolio – under the hood(280)   the dias focused growth portfolio – under the hood
(280) the dias focused growth portfolio – under the hoodtheretirementengineer
 
1. Our book mentions, An analyst could easily get lost in examini.docx
1. Our book mentions, An analyst could easily get lost in examini.docx1. Our book mentions, An analyst could easily get lost in examini.docx
1. Our book mentions, An analyst could easily get lost in examini.docxjackiewalcutt
 
TSGThinking about Your Company Mastera
TSGThinking about Your Company MasteraTSGThinking about Your Company Mastera
TSGThinking about Your Company MasteraTodd S. Greenberg
 
Sf guide moving_mountains_us_02
Sf guide moving_mountains_us_02Sf guide moving_mountains_us_02
Sf guide moving_mountains_us_02Yasmin AbdelAziz
 
ARE CEOS PAID FOR PERFORMANCE? Evaluating the Effectiveness of Equity Incentives
ARE CEOS PAID FOR PERFORMANCE? Evaluating the Effectiveness of Equity IncentivesARE CEOS PAID FOR PERFORMANCE? Evaluating the Effectiveness of Equity Incentives
ARE CEOS PAID FOR PERFORMANCE? Evaluating the Effectiveness of Equity IncentivesTrading Game Pty Ltd
 
An Overview of Corporate Finance and the Financial Environment.pdf
An Overview of Corporate Finance and the Financial Environment.pdfAn Overview of Corporate Finance and the Financial Environment.pdf
An Overview of Corporate Finance and the Financial Environment.pdfCynthia Velynne
 
PEI October - Interview with Jim Corey
PEI October -  Interview with Jim CoreyPEI October -  Interview with Jim Corey
PEI October - Interview with Jim CoreyCorey Torrence
 
The Mandate for Agile Measurement by BECKON
The Mandate for Agile Measurement by BECKONThe Mandate for Agile Measurement by BECKON
The Mandate for Agile Measurement by BECKONAmanda Roberts
 
Business Intelligence System
Business Intelligence SystemBusiness Intelligence System
Business Intelligence SystemLisa Martinez
 

Similar to The knock on most business leaders is that they don’t take the.docx (18)

EntrepreneurialMINDSETWalter Jofre Jr.Entrepreneurial .docx
EntrepreneurialMINDSETWalter Jofre Jr.Entrepreneurial .docxEntrepreneurialMINDSETWalter Jofre Jr.Entrepreneurial .docx
EntrepreneurialMINDSETWalter Jofre Jr.Entrepreneurial .docx
 
20 most admired companies of the year 2019
20 most admired companies of the year 201920 most admired companies of the year 2019
20 most admired companies of the year 2019
 
What impact does Customer Management have on Business Performance
What impact does Customer Management have on Business PerformanceWhat impact does Customer Management have on Business Performance
What impact does Customer Management have on Business Performance
 
Organizing for Advantage
Organizing for AdvantageOrganizing for Advantage
Organizing for Advantage
 
Crafting Data Driven Buyer Personas
Crafting Data Driven Buyer PersonasCrafting Data Driven Buyer Personas
Crafting Data Driven Buyer Personas
 
Info Week Sfsf 21610 Pr
Info Week Sfsf 21610 PrInfo Week Sfsf 21610 Pr
Info Week Sfsf 21610 Pr
 
[Salterbaxter Directions] Moving The Goal Posts
[Salterbaxter Directions] Moving The Goal Posts[Salterbaxter Directions] Moving The Goal Posts
[Salterbaxter Directions] Moving The Goal Posts
 
Accounting Research Paper revised
Accounting Research Paper revisedAccounting Research Paper revised
Accounting Research Paper revised
 
(280) the dias focused growth portfolio – under the hood
(280)   the dias focused growth portfolio – under the hood(280)   the dias focused growth portfolio – under the hood
(280) the dias focused growth portfolio – under the hood
 
1. Our book mentions, An analyst could easily get lost in examini.docx
1. Our book mentions, An analyst could easily get lost in examini.docx1. Our book mentions, An analyst could easily get lost in examini.docx
1. Our book mentions, An analyst could easily get lost in examini.docx
 
TSGThinking about Your Company Mastera
TSGThinking about Your Company MasteraTSGThinking about Your Company Mastera
TSGThinking about Your Company Mastera
 
Sf guide moving_mountains_us_02
Sf guide moving_mountains_us_02Sf guide moving_mountains_us_02
Sf guide moving_mountains_us_02
 
ARE CEOS PAID FOR PERFORMANCE? Evaluating the Effectiveness of Equity Incentives
ARE CEOS PAID FOR PERFORMANCE? Evaluating the Effectiveness of Equity IncentivesARE CEOS PAID FOR PERFORMANCE? Evaluating the Effectiveness of Equity Incentives
ARE CEOS PAID FOR PERFORMANCE? Evaluating the Effectiveness of Equity Incentives
 
Sas business analytics
Sas   business analyticsSas   business analytics
Sas business analytics
 
An Overview of Corporate Finance and the Financial Environment.pdf
An Overview of Corporate Finance and the Financial Environment.pdfAn Overview of Corporate Finance and the Financial Environment.pdf
An Overview of Corporate Finance and the Financial Environment.pdf
 
PEI October - Interview with Jim Corey
PEI October -  Interview with Jim CoreyPEI October -  Interview with Jim Corey
PEI October - Interview with Jim Corey
 
The Mandate for Agile Measurement by BECKON
The Mandate for Agile Measurement by BECKONThe Mandate for Agile Measurement by BECKON
The Mandate for Agile Measurement by BECKON
 
Business Intelligence System
Business Intelligence SystemBusiness Intelligence System
Business Intelligence System
 

More from oreo10

All scientific theories must be able to make testable predictions. S.docx
All scientific theories must be able to make testable predictions. S.docxAll scientific theories must be able to make testable predictions. S.docx
All scientific theories must be able to make testable predictions. S.docxoreo10
 
All I wnat is to write a reflection paper on my project which is hac.docx
All I wnat is to write a reflection paper on my project which is hac.docxAll I wnat is to write a reflection paper on my project which is hac.docx
All I wnat is to write a reflection paper on my project which is hac.docxoreo10
 
Alice,Betty, and Carol are playing a game with 48 marbles in a circl.docx
Alice,Betty, and Carol are playing a game with 48 marbles in a circl.docxAlice,Betty, and Carol are playing a game with 48 marbles in a circl.docx
Alice,Betty, and Carol are playing a game with 48 marbles in a circl.docxoreo10
 
All healthcare organizations must convert to an Electronic Health Re.docx
All healthcare organizations must convert to an Electronic Health Re.docxAll healthcare organizations must convert to an Electronic Health Re.docx
All healthcare organizations must convert to an Electronic Health Re.docxoreo10
 
All round writer onlyThis is an individual Mediation assignment..docx
All round writer onlyThis is an individual Mediation assignment..docxAll round writer onlyThis is an individual Mediation assignment..docx
All round writer onlyThis is an individual Mediation assignment..docxoreo10
 
Alice was wondering whether it was a good idea to invest her money i.docx
Alice was wondering whether it was a good idea to invest her money i.docxAlice was wondering whether it was a good idea to invest her money i.docx
Alice was wondering whether it was a good idea to invest her money i.docxoreo10
 
All organisms have DNA, which differs only in the number and order o.docx
All organisms have DNA, which differs only in the number and order o.docxAll organisms have DNA, which differs only in the number and order o.docx
All organisms have DNA, which differs only in the number and order o.docxoreo10
 
All literature involves some kind of performance which is intended f.docx
All literature involves some kind of performance which is intended f.docxAll literature involves some kind of performance which is intended f.docx
All literature involves some kind of performance which is intended f.docxoreo10
 
All key elements of the assignment are covered in a substantiv.docx
All key elements of the assignment are covered in a substantiv.docxAll key elements of the assignment are covered in a substantiv.docx
All key elements of the assignment are covered in a substantiv.docxoreo10
 
Alice, Betty and Carol are playing a game with 48 marbles in a circl.docx
Alice, Betty and Carol are playing a game with 48 marbles in a circl.docxAlice, Betty and Carol are playing a game with 48 marbles in a circl.docx
Alice, Betty and Carol are playing a game with 48 marbles in a circl.docxoreo10
 
Alice Jones was employed as a clerk-typist by a company. She request.docx
Alice Jones was employed as a clerk-typist by a company. She request.docxAlice Jones was employed as a clerk-typist by a company. She request.docx
Alice Jones was employed as a clerk-typist by a company. She request.docxoreo10
 
Air and Water Pollution PaperAir and water pollutants exist in m.docx
Air and Water Pollution PaperAir and water pollutants exist in m.docxAir and Water Pollution PaperAir and water pollutants exist in m.docx
Air and Water Pollution PaperAir and water pollutants exist in m.docxoreo10
 
Air pollution is an environmental health problem in many cities thro.docx
Air pollution is an environmental health problem in many cities thro.docxAir pollution is an environmental health problem in many cities thro.docx
Air pollution is an environmental health problem in many cities thro.docxoreo10
 
After your topic has been approved, the next step is to research.docx
After your topic has been approved, the next step is to research.docxAfter your topic has been approved, the next step is to research.docx
After your topic has been approved, the next step is to research.docxoreo10
 
After watching three of the five movie clips listed in the Multime.docx
After watching three of the five movie clips listed in the Multime.docxAfter watching three of the five movie clips listed in the Multime.docx
After watching three of the five movie clips listed in the Multime.docxoreo10
 
Aging and Disability WorksheetPart IIdentify 2 or .docx
Aging and Disability WorksheetPart IIdentify 2 or .docxAging and Disability WorksheetPart IIdentify 2 or .docx
Aging and Disability WorksheetPart IIdentify 2 or .docxoreo10
 
After watching the video and reading the Web Resource, CDC Autism .docx
After watching the video and reading the Web Resource, CDC Autism .docxAfter watching the video and reading the Web Resource, CDC Autism .docx
After watching the video and reading the Web Resource, CDC Autism .docxoreo10
 
AI Artificial Intelligence1Reading responsePeter .docx
AI Artificial Intelligence1Reading responsePeter .docxAI Artificial Intelligence1Reading responsePeter .docx
AI Artificial Intelligence1Reading responsePeter .docxoreo10
 
Agree or disagree with, and discuss the following statement Corp.docx
Agree or disagree with, and discuss the following statement Corp.docxAgree or disagree with, and discuss the following statement Corp.docx
Agree or disagree with, and discuss the following statement Corp.docxoreo10
 
After watching Reactions to an Impending Death Sentence and Ti.docx
After watching Reactions to an Impending Death Sentence and Ti.docxAfter watching Reactions to an Impending Death Sentence and Ti.docx
After watching Reactions to an Impending Death Sentence and Ti.docxoreo10
 

More from oreo10 (20)

All scientific theories must be able to make testable predictions. S.docx
All scientific theories must be able to make testable predictions. S.docxAll scientific theories must be able to make testable predictions. S.docx
All scientific theories must be able to make testable predictions. S.docx
 
All I wnat is to write a reflection paper on my project which is hac.docx
All I wnat is to write a reflection paper on my project which is hac.docxAll I wnat is to write a reflection paper on my project which is hac.docx
All I wnat is to write a reflection paper on my project which is hac.docx
 
Alice,Betty, and Carol are playing a game with 48 marbles in a circl.docx
Alice,Betty, and Carol are playing a game with 48 marbles in a circl.docxAlice,Betty, and Carol are playing a game with 48 marbles in a circl.docx
Alice,Betty, and Carol are playing a game with 48 marbles in a circl.docx
 
All healthcare organizations must convert to an Electronic Health Re.docx
All healthcare organizations must convert to an Electronic Health Re.docxAll healthcare organizations must convert to an Electronic Health Re.docx
All healthcare organizations must convert to an Electronic Health Re.docx
 
All round writer onlyThis is an individual Mediation assignment..docx
All round writer onlyThis is an individual Mediation assignment..docxAll round writer onlyThis is an individual Mediation assignment..docx
All round writer onlyThis is an individual Mediation assignment..docx
 
Alice was wondering whether it was a good idea to invest her money i.docx
Alice was wondering whether it was a good idea to invest her money i.docxAlice was wondering whether it was a good idea to invest her money i.docx
Alice was wondering whether it was a good idea to invest her money i.docx
 
All organisms have DNA, which differs only in the number and order o.docx
All organisms have DNA, which differs only in the number and order o.docxAll organisms have DNA, which differs only in the number and order o.docx
All organisms have DNA, which differs only in the number and order o.docx
 
All literature involves some kind of performance which is intended f.docx
All literature involves some kind of performance which is intended f.docxAll literature involves some kind of performance which is intended f.docx
All literature involves some kind of performance which is intended f.docx
 
All key elements of the assignment are covered in a substantiv.docx
All key elements of the assignment are covered in a substantiv.docxAll key elements of the assignment are covered in a substantiv.docx
All key elements of the assignment are covered in a substantiv.docx
 
Alice, Betty and Carol are playing a game with 48 marbles in a circl.docx
Alice, Betty and Carol are playing a game with 48 marbles in a circl.docxAlice, Betty and Carol are playing a game with 48 marbles in a circl.docx
Alice, Betty and Carol are playing a game with 48 marbles in a circl.docx
 
Alice Jones was employed as a clerk-typist by a company. She request.docx
Alice Jones was employed as a clerk-typist by a company. She request.docxAlice Jones was employed as a clerk-typist by a company. She request.docx
Alice Jones was employed as a clerk-typist by a company. She request.docx
 
Air and Water Pollution PaperAir and water pollutants exist in m.docx
Air and Water Pollution PaperAir and water pollutants exist in m.docxAir and Water Pollution PaperAir and water pollutants exist in m.docx
Air and Water Pollution PaperAir and water pollutants exist in m.docx
 
Air pollution is an environmental health problem in many cities thro.docx
Air pollution is an environmental health problem in many cities thro.docxAir pollution is an environmental health problem in many cities thro.docx
Air pollution is an environmental health problem in many cities thro.docx
 
After your topic has been approved, the next step is to research.docx
After your topic has been approved, the next step is to research.docxAfter your topic has been approved, the next step is to research.docx
After your topic has been approved, the next step is to research.docx
 
After watching three of the five movie clips listed in the Multime.docx
After watching three of the five movie clips listed in the Multime.docxAfter watching three of the five movie clips listed in the Multime.docx
After watching three of the five movie clips listed in the Multime.docx
 
Aging and Disability WorksheetPart IIdentify 2 or .docx
Aging and Disability WorksheetPart IIdentify 2 or .docxAging and Disability WorksheetPart IIdentify 2 or .docx
Aging and Disability WorksheetPart IIdentify 2 or .docx
 
After watching the video and reading the Web Resource, CDC Autism .docx
After watching the video and reading the Web Resource, CDC Autism .docxAfter watching the video and reading the Web Resource, CDC Autism .docx
After watching the video and reading the Web Resource, CDC Autism .docx
 
AI Artificial Intelligence1Reading responsePeter .docx
AI Artificial Intelligence1Reading responsePeter .docxAI Artificial Intelligence1Reading responsePeter .docx
AI Artificial Intelligence1Reading responsePeter .docx
 
Agree or disagree with, and discuss the following statement Corp.docx
Agree or disagree with, and discuss the following statement Corp.docxAgree or disagree with, and discuss the following statement Corp.docx
Agree or disagree with, and discuss the following statement Corp.docx
 
After watching Reactions to an Impending Death Sentence and Ti.docx
After watching Reactions to an Impending Death Sentence and Ti.docxAfter watching Reactions to an Impending Death Sentence and Ti.docx
After watching Reactions to an Impending Death Sentence and Ti.docx
 

Recently uploaded

Web & Social Media Analytics Previous Year Question Paper.pdf
Web & Social Media Analytics Previous Year Question Paper.pdfWeb & Social Media Analytics Previous Year Question Paper.pdf
Web & Social Media Analytics Previous Year Question Paper.pdfJayanti Pande
 
Holdier Curriculum Vitae (April 2024).pdf
Holdier Curriculum Vitae (April 2024).pdfHoldier Curriculum Vitae (April 2024).pdf
Holdier Curriculum Vitae (April 2024).pdfagholdier
 
microwave assisted reaction. General introduction
microwave assisted reaction. General introductionmicrowave assisted reaction. General introduction
microwave assisted reaction. General introductionMaksud Ahmed
 
Sanyam Choudhary Chemistry practical.pdf
Sanyam Choudhary Chemistry practical.pdfSanyam Choudhary Chemistry practical.pdf
Sanyam Choudhary Chemistry practical.pdfsanyamsingh5019
 
A Critique of the Proposed National Education Policy Reform
A Critique of the Proposed National Education Policy ReformA Critique of the Proposed National Education Policy Reform
A Critique of the Proposed National Education Policy ReformChameera Dedduwage
 
Ecosystem Interactions Class Discussion Presentation in Blue Green Lined Styl...
Ecosystem Interactions Class Discussion Presentation in Blue Green Lined Styl...Ecosystem Interactions Class Discussion Presentation in Blue Green Lined Styl...
Ecosystem Interactions Class Discussion Presentation in Blue Green Lined Styl...fonyou31
 
BAG TECHNIQUE Bag technique-a tool making use of public health bag through wh...
BAG TECHNIQUE Bag technique-a tool making use of public health bag through wh...BAG TECHNIQUE Bag technique-a tool making use of public health bag through wh...
BAG TECHNIQUE Bag technique-a tool making use of public health bag through wh...Sapna Thakur
 
Disha NEET Physics Guide for classes 11 and 12.pdf
Disha NEET Physics Guide for classes 11 and 12.pdfDisha NEET Physics Guide for classes 11 and 12.pdf
Disha NEET Physics Guide for classes 11 and 12.pdfchloefrazer622
 
IGNOU MSCCFT and PGDCFT Exam Question Pattern: MCFT003 Counselling and Family...
IGNOU MSCCFT and PGDCFT Exam Question Pattern: MCFT003 Counselling and Family...IGNOU MSCCFT and PGDCFT Exam Question Pattern: MCFT003 Counselling and Family...
IGNOU MSCCFT and PGDCFT Exam Question Pattern: MCFT003 Counselling and Family...PsychoTech Services
 
Paris 2024 Olympic Geographies - an activity
Paris 2024 Olympic Geographies - an activityParis 2024 Olympic Geographies - an activity
Paris 2024 Olympic Geographies - an activityGeoBlogs
 
Russian Escort Service in Delhi 11k Hotel Foreigner Russian Call Girls in Delhi
Russian Escort Service in Delhi 11k Hotel Foreigner Russian Call Girls in DelhiRussian Escort Service in Delhi 11k Hotel Foreigner Russian Call Girls in Delhi
Russian Escort Service in Delhi 11k Hotel Foreigner Russian Call Girls in Delhikauryashika82
 
Software Engineering Methodologies (overview)
Software Engineering Methodologies (overview)Software Engineering Methodologies (overview)
Software Engineering Methodologies (overview)eniolaolutunde
 
Key note speaker Neum_Admir Softic_ENG.pdf
Key note speaker Neum_Admir Softic_ENG.pdfKey note speaker Neum_Admir Softic_ENG.pdf
Key note speaker Neum_Admir Softic_ENG.pdfAdmir Softic
 
APM Welcome, APM North West Network Conference, Synergies Across Sectors
APM Welcome, APM North West Network Conference, Synergies Across SectorsAPM Welcome, APM North West Network Conference, Synergies Across Sectors
APM Welcome, APM North West Network Conference, Synergies Across SectorsAssociation for Project Management
 
Presentation by Andreas Schleicher Tackling the School Absenteeism Crisis 30 ...
Presentation by Andreas Schleicher Tackling the School Absenteeism Crisis 30 ...Presentation by Andreas Schleicher Tackling the School Absenteeism Crisis 30 ...
Presentation by Andreas Schleicher Tackling the School Absenteeism Crisis 30 ...EduSkills OECD
 
1029-Danh muc Sach Giao Khoa khoi 6.pdf
1029-Danh muc Sach Giao Khoa khoi  6.pdf1029-Danh muc Sach Giao Khoa khoi  6.pdf
1029-Danh muc Sach Giao Khoa khoi 6.pdfQucHHunhnh
 
Nutritional Needs Presentation - HLTH 104
Nutritional Needs Presentation - HLTH 104Nutritional Needs Presentation - HLTH 104
Nutritional Needs Presentation - HLTH 104misteraugie
 

Recently uploaded (20)

Web & Social Media Analytics Previous Year Question Paper.pdf
Web & Social Media Analytics Previous Year Question Paper.pdfWeb & Social Media Analytics Previous Year Question Paper.pdf
Web & Social Media Analytics Previous Year Question Paper.pdf
 
Holdier Curriculum Vitae (April 2024).pdf
Holdier Curriculum Vitae (April 2024).pdfHoldier Curriculum Vitae (April 2024).pdf
Holdier Curriculum Vitae (April 2024).pdf
 
microwave assisted reaction. General introduction
microwave assisted reaction. General introductionmicrowave assisted reaction. General introduction
microwave assisted reaction. General introduction
 
Sanyam Choudhary Chemistry practical.pdf
Sanyam Choudhary Chemistry practical.pdfSanyam Choudhary Chemistry practical.pdf
Sanyam Choudhary Chemistry practical.pdf
 
A Critique of the Proposed National Education Policy Reform
A Critique of the Proposed National Education Policy ReformA Critique of the Proposed National Education Policy Reform
A Critique of the Proposed National Education Policy Reform
 
Ecosystem Interactions Class Discussion Presentation in Blue Green Lined Styl...
Ecosystem Interactions Class Discussion Presentation in Blue Green Lined Styl...Ecosystem Interactions Class Discussion Presentation in Blue Green Lined Styl...
Ecosystem Interactions Class Discussion Presentation in Blue Green Lined Styl...
 
BAG TECHNIQUE Bag technique-a tool making use of public health bag through wh...
BAG TECHNIQUE Bag technique-a tool making use of public health bag through wh...BAG TECHNIQUE Bag technique-a tool making use of public health bag through wh...
BAG TECHNIQUE Bag technique-a tool making use of public health bag through wh...
 
Advance Mobile Application Development class 07
Advance Mobile Application Development class 07Advance Mobile Application Development class 07
Advance Mobile Application Development class 07
 
Disha NEET Physics Guide for classes 11 and 12.pdf
Disha NEET Physics Guide for classes 11 and 12.pdfDisha NEET Physics Guide for classes 11 and 12.pdf
Disha NEET Physics Guide for classes 11 and 12.pdf
 
IGNOU MSCCFT and PGDCFT Exam Question Pattern: MCFT003 Counselling and Family...
IGNOU MSCCFT and PGDCFT Exam Question Pattern: MCFT003 Counselling and Family...IGNOU MSCCFT and PGDCFT Exam Question Pattern: MCFT003 Counselling and Family...
IGNOU MSCCFT and PGDCFT Exam Question Pattern: MCFT003 Counselling and Family...
 
Mattingly "AI & Prompt Design: Structured Data, Assistants, & RAG"
Mattingly "AI & Prompt Design: Structured Data, Assistants, & RAG"Mattingly "AI & Prompt Design: Structured Data, Assistants, & RAG"
Mattingly "AI & Prompt Design: Structured Data, Assistants, & RAG"
 
Paris 2024 Olympic Geographies - an activity
Paris 2024 Olympic Geographies - an activityParis 2024 Olympic Geographies - an activity
Paris 2024 Olympic Geographies - an activity
 
Russian Escort Service in Delhi 11k Hotel Foreigner Russian Call Girls in Delhi
Russian Escort Service in Delhi 11k Hotel Foreigner Russian Call Girls in DelhiRussian Escort Service in Delhi 11k Hotel Foreigner Russian Call Girls in Delhi
Russian Escort Service in Delhi 11k Hotel Foreigner Russian Call Girls in Delhi
 
Software Engineering Methodologies (overview)
Software Engineering Methodologies (overview)Software Engineering Methodologies (overview)
Software Engineering Methodologies (overview)
 
Key note speaker Neum_Admir Softic_ENG.pdf
Key note speaker Neum_Admir Softic_ENG.pdfKey note speaker Neum_Admir Softic_ENG.pdf
Key note speaker Neum_Admir Softic_ENG.pdf
 
APM Welcome, APM North West Network Conference, Synergies Across Sectors
APM Welcome, APM North West Network Conference, Synergies Across SectorsAPM Welcome, APM North West Network Conference, Synergies Across Sectors
APM Welcome, APM North West Network Conference, Synergies Across Sectors
 
Mattingly "AI & Prompt Design: The Basics of Prompt Design"
Mattingly "AI & Prompt Design: The Basics of Prompt Design"Mattingly "AI & Prompt Design: The Basics of Prompt Design"
Mattingly "AI & Prompt Design: The Basics of Prompt Design"
 
Presentation by Andreas Schleicher Tackling the School Absenteeism Crisis 30 ...
Presentation by Andreas Schleicher Tackling the School Absenteeism Crisis 30 ...Presentation by Andreas Schleicher Tackling the School Absenteeism Crisis 30 ...
Presentation by Andreas Schleicher Tackling the School Absenteeism Crisis 30 ...
 
1029-Danh muc Sach Giao Khoa khoi 6.pdf
1029-Danh muc Sach Giao Khoa khoi  6.pdf1029-Danh muc Sach Giao Khoa khoi  6.pdf
1029-Danh muc Sach Giao Khoa khoi 6.pdf
 
Nutritional Needs Presentation - HLTH 104
Nutritional Needs Presentation - HLTH 104Nutritional Needs Presentation - HLTH 104
Nutritional Needs Presentation - HLTH 104
 

The knock on most business leaders is that they don’t take the.docx

  • 1. The knock on most business leaders is that they don’t take the long view—that they’re fixated on achieving short-term goals to lift their pay. So which global CEOs actually delivered solid results over the long run? The 2013 version of the CEO Scorecard provides an objective answer. by Morten T. Hansen, Herminia Ibarra, and Urs Peyer 100 The Best-Performing CEOs in the World hBr.Org January–February 2013 harvard Business review 81 The BesT-Performing Ceos in The World I t’s no accident that chief executives so often focus on short-term financial re- sults at the expense of longer-term per- formance. They have every incentive to do so. If they don’t make their quarterly or annual numbers, their compensa- tion drops and their jobs are in jeopardy. Stock analysts, shareholders, and often their own boards judge them harshly if they miss near-term goals. And without
  • 2. equally strong pressure to manage for a future that stretches beyond 90 or 180 days, CEOs’ behavior is unlikely to change. Developing a simple yet rigorous way to gauge long-term performance is crucial; after all, in business, leaders default to managing what’s measured. Five years ago we launched a global project to ad- dress that challenge. But we wanted to do more than just devise the right metrics. Our goal was to imple- ment a scorecard that would not only get people talking about long-term performance but also alter the way that boards, executives, consultants, and management scholars thought about and assessed CEOs. We wanted this innovation to shine a spotlight on the CEOs worldwide who had created long-term value for their companies, and we wanted to give ex- ecutives around the world critical benchmarks they could aim for. Three years ago, in the January–February 2010 is- sue of HBR, we introduced such a scorecard. It evalu- ated chief executives on their entire tenure in office. We used it to rank the performance of nearly 2,000 CEOs. This month we are publishing a new version of that analysis. We have expanded it along two impor- tant new dimensions—making the group of CEOs we studied truly global, and examining which CEOs and companies were able to do well not only financially but also in terms of corporate social performance. Judging Ceo Performance For the most part, we used the same methodology that we did three years ago. (See the sidebar “How We Created the Scorecard,” page 92.) We wanted to accomplish three things:
  • 3. Assess the long-term performance of each CEO, from the first day on the job to the last. (Or for CEOs still in office, until August 31, 2012, our last day of data collection.) To do this, we looked at how much total shareholder returns had changed over that time period (adjusting for country and in- dustry effects), plus the overall increase in market capitalization. Reflect the global nature of business. In 2010 we drew candidates from the S&P Global 1200 and BRIC 40 lists; this year we worked with three other emerging-market indexes as well. The pool of CEOs studied increased by roughly one-third, from 1,999 in 2010 to 3,143 this year. Be objective. Other rankings use reputation and surveys, which tap into popularity and ce- lebrity status, to score CEOs. Instead, we use only performance data—notably, total shareholder per- formance. Other metrics, such as sales, profitability, and innovation rates, are useful, too, but they differ by industry, which makes comparisons difficult. Granted, one downside of using truly objective measures is that our ranking may not exclude CEOs who have disappointed stakeholders on dimensions where performance is more subjective. This can be especially challenging with CEOs from emerging markets where rules are still being established. But even though CEOs are held accountable in areas that shareholder performance cannot capture, it remains the principal standard by which they are judged.
  • 4. Who’s Up, Who’s down The top 100 CEOs on our list performed exception- ally well. On average, they delivered a total share- holder return of 1,385% during their tenures and increased their firms’ market value by $40.2 billion (adjusted for inflation, dividends, share repurchases, and share issues). The contrast between their results and those of the bottom 100 CEOs was striking: On average, the bottom 100 produced a total share- holder return of -57% and presided over a loss of $13.6 billion in market value. It comes as no surprise that the best-performing CEO over the past 17 years was Steve Jobs of Apple, who was #1 on our 2010 list as well. From 1997 to 2011, Apple’s market value increased by $359 bil- lion, and its shareholder return experienced aver- age compound annual growth of 35%. That remark- 82 Harvard Business Review January–february 2013 1 Steve Jobs Company Apple Industry Information Technology tEnurE 1997–2011
  • 5. InsIdEr total sharEholdEr rEturn Country Adjusted Industry Adjusted markEt CapItalIzatIon ChangE ($ bIllIons) +359 mBa unItEd statEs 6,682% 6,621% ovErall rank 3 Yun Jong-Yong Company Samsung Electronics Industry Information Technology tEnurE 1996–2008 InsIdEr total sharEholdEr rEturn Country Adjusted Industry Adjusted
  • 6. markEt CapItalIzatIon ChangE ($ bIllIons) +128 mBa south korEa 1,559% 1,437% ovErall rank 2 ovErall rank Jeffrey P. Bezos Company Amazon.com Industry Online Retail tEnurE 1996– InsIdEr total sharEholdEr rEturn Country Adjusted Industry Adjusted markEt CapItalIzatIon ChangE ($ bIllIons) +111
  • 7. mBa unItEd statEs 12,431% 12,266% Continued on PAGe 84 Jeff Bezos’s focus on consumers above share- holders has at times vexed Wall Street. But smart investors have stayed with his company. In 16 years as CEO of Amazon, the online retail giant he created, Bezos has delivered industry- adjusted shareholder returns of 12,266%, and the value of the company has grown by $111 billion. Bezos took time to speak with HBR’s editor in chief, Adi Ignatius, last November 26—Cyber Monday, which set an all-time record for online sales, a category Amazon practically invented. Edited excerpts from the interview follow. “ You Have to Be Willing to Be Misunderstood” 4 Roger Agnelli Company Vale Industry Materials
  • 8. tEnurE 2001–2011 InsIdEr total sharEholdEr rEturn Country Adjusted Industry Adjusted markEt CapItalIzatIon ChangE ($ bIllIons) +157 mBa BrazIl 934% 1,773% ovErall rank BE zO S Ph O TO g R A Ph
  • 9. Y: K A R En M O SK O w IT z hBR.ORg January–February 2013 harvard Business Review 83 The BesT-Performing Ceos in The World 2 Continued Jeffrey P. Bezos hBr: When Amazon went public, in 1997, you wrote a letter to shareholders that said, “It’s all about the long term.” Did you feel you were chal- lenging orthodoxy? Bezos: We were trying to make sure we were cor- rectly advertising the event. Warren Buffett once
  • 10. said, “You can hold a rock concert or you can hold a ballet. Just don’t hold a rock concert and advertise it as a ballet.” A public company has to be clear about whether it’s holding a rock concert or a ballet, and then investors can decide if they want to opt in. What does it mean from the perspective of a CEO to think long-term? If you’re long-term oriented, customer interests and shareholder interests are aligned. In the short term, that’s not always the case. We have other stakeholders, too—our employees, our vendors. We take it as an article of faith that if we put cus- tomers first, other stakeholders will also benefit, as long as they’re willing to take the long-term view. And a long-term approach is essential for invention, because you’re going to have a lot of failures along the way. You’ve said that you like to plant seeds that may take seven years to bear fruit. Doesn’t that mean you’ll lose some battles to companies that have a more conventional, two- or three-year outlook? Maybe so, but if we had always needed to see sig- nificant financial results in two or three years, then some of the most meaningful things we’ve done would never have been started—like Kindle, Ama- zon Web Services, Amazon Prime. How much do you care about your share price? I care very much about our shareowners, so I care very much about our long-term share price. I do not follow the stock on a daily basis, because I don’t think there’s any information in it. The economist Benjamin Graham once said, “In the short term, the stock market is a voting machine. In the long term,
  • 11. it’s a weighing machine.” We try to build a company that wants to be weighed, not voted on. Does it make sense for Amazon to stay in the hardware business, which is a low-margin, low- profit area for you? Our approach is to sell our hardware—our Kindle de- vices—at near breakeven. Then we have an ongoing relationship with customers who buy content from us: digital books, music, movies, TV shows, games, apps. We aren’t trying to make $100 every time we sell a Kindle Fire, so we don’t have to get you on the upgrade treadmill. You have said that you would be interested, if you had the right concept and approach, in creating a physical Amazon retail experience. Why even con- sider that? We like to build innovative things, but only if we can put our own unique twist on them. If we could find something differentiated that we thought customers would like, it would be superfun. Would developing a phone fall into that innovative category? Yeah, absolutely. Who do you fear is your biggest challenger? We don’t get up every morning wondering, “Who are the top three companies that are going to try to kill us?” I know of companies that do that in their annual planning processes, and the competitive zeal moti- vates them. We do pay attention, but it’s not where we get our energy from.
  • 12. Disruption is a rough business. Do you have any personal regrets about the pain your success has caused traditional retailers? I’m as sentimental as the next person. I have lots of childhood memories of physical books and things like that. But our job at Amazon is to build the best customer experience we can and let customers choose where they shop. At what point will the goal change from lowering margins and building market share to making a big- ger profit? Percentage margins are not something we seek to optimize. We want to maximize the absolute-dollar free cash flow per share. If we can do that by lowering margins, we will. Free cash flow is something inves- tors can spend. They can’t spend percentage margins. Amazon has done a great job of self-cannibalizing its revenue streams—going from Amazon Store to 84 Harvard Business Review January–february 2013 able accomplishment is likely to go unbeaten for a long time. Jeff Bezos of Amazon.com has now climbed to the #2 spot, up from #7 in our 2010 list. Under his leadership, the company delivered industry- adjusted shareholder returns of 12,266% and saw its value increase by $111 billion. In recent years the online retailer has expanded aggressively into new segments such as cloud-based computing services, while working to get the most out of the markets it
  • 13. already occupies. Its revenue growth shows no signs of slowing: Sales increased by 40% in 2011. The highest-ranked woman on the list is Meg Whitman, currently the CEO of beleaguered HP, whose performance as the CEO of eBay from 1998 to 2008 earned her the #9 spot. Overall, only 1.9% of all the CEOs we studied were women. There was considerable turnover in the top 100—this year about half (43) of the CEOs are new to that list since 2010. The change happened largely because in creating the 2013 ranking, we examined a bigger, more international sample of CEOs. To make the top 100 in 2010, CEOs had to rank in the top 5% of the executives in the study; this year they had to land in the top 3.2%. The majority of new- comers to the top 100 are from emerging markets, not surprisingly, but eight U.S. CEOs made the cut for the first time. One notable new name is Lars Sørensen, the CEO of Novo Nordisk, a company that made its name selling insulin for diabetics. He shot up from #233 in 2010 to #20 in our current ranking. After Sørensen took over the company, in 2000, he spent 10 years and $500 million expanding the sales force to make it truly global. When all his competitors were invest- ing in diabetes pills, Sørensen shut down Novo’s pill research and instead focused the company on its core competency—insulin and other injected dia- betes medications, notably prefilled insulin “pens” that eliminate the hassle of using a vial and syringe. His bet that sales would continue to grow in the wake of a worldwide diabetes epidemic has clearly paid off.
  • 14. Even industries that have gone through tough times in recent years have seen some exceptional results. Airlines, for example, have not been do- ing well, but Air China, under the leadership of Li Jiaxiang (#17 on our list), bucked that trend. During his tenure, from 2004 to 2008, the company’s to- tal shareholder return was 1,022 percentage points higher than the average for its industry peers, while Amazon Marketplace, from print to e-books, and so on. In most companies, moves like those would be hard to execute without organizational turmoil. How have you managed the transitions? When things get complicated, we simplify them by asking, “What’s best for the customer?” We believe that if we do that, things will work out in the long term. We can never prove that. In fact, sometimes we do price-elasticity studies, and the answer is always that we should raise prices. But we don’t, because we believe that by keeping our prices very low, we earn trust with customers, and that this will maximize free cash flow over the long term. What have you learned about leadership from run- ning what has become a very big company? If you’re inventing and pioneering, you have to be willing to be misunderstood for long periods of time. One early example is customer reviews. A book pub- lisher told me, “You don’t understand your business. You make money when you sell things. Why do you allow negative reviews?” And I thought, “We don’t make money when we sell things; we make money when we help customers make purchase decisions.” How do you institutionalize the ability to come up
  • 15. with these good, misunderstood ideas? First, there are stories we tell ourselves internally about persistence and patience, long-term think- ing, staying focused on the customer. Second, we select people who, when they wake up in the morn- ing, are thinking about how to invent on behalf of the customer. If you like a more competitively focused culture, you might find us dull. We find our culture intensely fun. We have an explorer mentality, not a conqueror mentality. You’ve generated a lot of attention recently. Is all the publicity good for you and for Amazon? I have to be choosy—I do very little. But I do inter- views because I want customers to understand what makes us tick, how we operate, what our principles are. I think customers want to know who they’re do- ing business with. And if you don’t talk, how in the world can we mis- understand you? Oh, believe me, that wouldn’t stop it. hbr.org January–February 2013 harvard business review 85 THE BEST-PERFORMING CEOS IN THE WORLD A truly stringent standard of excellence takes into account not only what results CEOs deliver over the long term but whether they’ve positioned their companies to succeed after they’ve left the helm. Here are the CEOs whose companies did very well over their entire tenure (in the top 10% of
  • 16. our 3,143 CEOs) and also during the three years after their departure. Many CEOs are not eligible for this list, of course, because they are still in offi ce or because three years haven’t passed since they left. At the top of this ranking we fi nd Tim Koogle, who was the CEO of Yahoo from 1995 to 2001. His successor, Terry Semel, increased the company’s market value by $24 billion from 2001 to 2004. The Legacy Litmus Test its market capitalization rose by $37 billion. With his guidance, Air China obtained a 50% share of the market in major Beijing airports and joined the larg- est airline alliance in the world. The World of CEOs Is Not Flat With a truly global sample to study, we can do a bet- ter job of comparing countries and regions. This is a signi� cant advance; for decades most analysis of CEO performance has been U.S.-centric. Now we’re able to examine data country by country—and we � nd real di� erences when we do. China has been the growth miracle of the past de- cade, so you might expect CEOs there to have done very well. We � nd that the opposite is true: Among the 3,143 CEOs we analyzed, the average rank of Chinese executives was 176 places lower than the average rank of U.S. executives. Only three Chinese companies’ CEOs made the top 100, though 17% of all the executives studied were from China. The Chinese leaders we asked about this discrepancy theorized that as the country’s companies become more innovation-focused, their performance will
  • 17. improve. Likewise, the average rank of Japanese CEOs was 562 places lower than that of their U.S. counterparts, although this is not a big surprise, since Japan’s econ- omy has struggled for many years. On the whole, U.S. CEOs did not shine either, despite holding six of the top 10 slots. Their average rank was 215 places lower than Latin American CEOs’, 140 places lower than Indian CEOs’, and 137 places lower than British CEOs’. Continental European and U.S. CEOs ranked about the same. U.S. CEOs have not been as competi- tive on a global scale as one might think. One bright spot is Brazil, whose CEOs make up only 4.5% of the total sample but 9% of the top 100. They include Roger Agnelli of Vale (#4) and Em- braer’s Maurício Botelho (#11). Botelho took over the state-owned company in 1995, when it was reporting losses of around $300 million a year, and over the next 12 years, built it into a world-class competitor. (Interestingly, Brazil is also overrepre- sented in the bottom 100, suggesting that compa- nies from that country play a high-risk, high-reward game.) Another standout is Mexico, whose aver- age CEO ranked 108 places higher than the average U.S. CEO. The national and regional differences get even more interesting as we turn to the question of why some CEOs got better results than others. 1 TIM KOOGLE COMPANY Yahoo United States INDUSTRY Information Technology
  • 18. TENURE 1995–2001 COUNTRY-ADJUSTED TSR TENURE 566% POST-TENURE 1,041% INDUSTRY-ADJUSTED TSR TENURE 559% POST-TENURE 1,076% MARKET CAP CHANGE TENURE +14B POST-TENURE +24B 2 V.S. JAIN COMPANY Steel Authority of India India INDUSTRY Materials TENURE 2002–2006 COUNTRY-ADJUSTED TSR TENURE 788% POST-TENURE 1,759% INDUSTRY-ADJUSTED TSR TENURE 843% POST-TENURE 1,925% MARKET CAP CHANGE TENURE +10B POST-TENURE +13B 3 PANGAL JAYENDRA NAYAK COMPANY Axis Bank India INDUSTRY Financial Services TENURE 2000–2009 COUNTRY-ADJUSTED TSR TENURE 2,149% POST-TENURE 3,217% INDUSTRY-ADJUSTED TSR TENURE 1,984% POST-TENURE 2,674% MARKET CAP CHANGE TENURE +4B POST-TENURE +4B 4 JOSÉ EDUARDO DE BARROS DUTRA COMPANY Petrobras Brazil
  • 19. INDUSTRY Energy TENURE 2003–2005 COUNTRY-ADJUSTED TSR TENURE 58% POST-TENURE 243% INDUSTRY-ADJUSTED TSR TENURE 201% POST-TENURE 1,329% MARKET CAP CHANGE TENURE +67B POST-TENURE +183B 5 MÁRCIO ARTUR LAURELLI CYPRIANO COMPANY Bradesco Brazil INDUSTRY Financial Services TENURE 1999–2009 COUNTRY-ADJUSTED TSR TENURE 36% POST-TENURE 268% INDUSTRY-ADJUSTED TSR TENURE 645% POST-TENURE 1,206% MARKET CAP CHANGE TENURE +41B POST-TENURE +29B 6 YUN JONG-YONG COMPANY Samsung Electronics South Korea INDUSTRY Information Technology TENURE 1996–2008 COUNTRY-ADJUSTED TSR TENURE 1,559% POST-TENURE 471% INDUSTRY-ADJUSTED TSR TENURE 1,437% POST-TENURE 380% MARKET CAP CHANGE TENURE +128B POST-TENURE +17B 7 DAVID THOMPSON COMPANY Teck Cominco
  • 20. Canada INDUSTRY Materials TENURE 2001–2005 COUNTRY-ADJUSTED TSR TENURE 235% POST-TENURE 423% INDUSTRY-ADJUSTED TSR TENURE 244% POST-TENURE 422% MARKET CAP CHANGE TENURE +8B POST-TENURE +14B 8 CHEE ONN LIM COMPANY Keppel Corporation Singapore INDUSTRY Industrials TENURE 2000–2008 COUNTRY-ADJUSTED TSR TENURE 237% POST-TENURE 511% INDUSTRY-ADJUSTED TSR TENURE 324% POST-TENURE 756% MARKET CAP CHANGE TENURE +5B POST-TENURE +9B 9 JOSÉ SIDNEI COLOMBO MARTINI COMPANY CTEEP Brazil INDUSTRY Utilities TENURE 1999–2009 COUNTRY-ADJUSTED TSR TENURE 2,288% POST-TENURE 2,205% INDUSTRY-ADJUSTED TSR TENURE 2,001% POST-TENURE 3,484% MARKET CAP CHANGE TENURE +6B POST-TENURE +2B 10 SUBIR RAHA
  • 21. COMPANY Oil & Natural Gas India INDUSTRY Energy TENURE 2001–2006 COUNTRY-ADJUSTED TSR TENURE 729% POST-TENURE 394% INDUSTRY-ADJUSTED TSR TENURE 915% POST-TENURE 512% MARKET CAP CHANGE TENURE +57B POST-TENURE +13B 86 Harvard Business Review January–February 2013 6 Chung Mong-Koo Company Hyundai Motor Company Industry Automobile tEnurE 1999– InsIdEr total sharEholdEr rEturn Country Adjusted Industry Adjusted markEt CapItalIzatIon ChangE ($ bIllIons)
  • 22. +48 mBa south korEa 2,024% 2,548% ovErall rank 7 Y.C. Deveshwar Company ITC Industry Consumer Goods tEnurE 1996– InsIdEr total sharEholdEr rEturn Country Adjusted Industry Adjusted markEt CapItalIzatIon ChangE ($ bIllIons) +45 mBa IndIa
  • 23. 3,308% 1,574% ovErall rank mBa 11 Maurício Novis Botelho Company Embraer Industry Industrials tEnurE 1995–2007 InsIdEr total sharEholdEr rEturn Country Adjusted Industry Adjusted markEt CapItalIzatIon ChangE ($ bIllIons) +23 BrazIl 5,881% 2,895% ovErall rank
  • 24. 12 William J. Doyle Company PotashCorp Industry Materials tEnurE 1999– InsIdEr total sharEholdEr rEturn Country Adjusted Industry Adjusted markEt CapItalIzatIon ChangE ($ bIllIons) +38 mBa Canada 862% 1,343% ovErall rank 16 Graham Mackay Company
  • 25. SABMiller Industry Consumer Goods tEnurE 1997– InsIdEr total sharEholdEr rEturn Country Adjusted Industry Adjusted markEt CapItalIzatIon ChangE ($ bIllIons) +70 mBa unItEd kIngdom 758% 626% ovErall rank top 5 FEmalE CEos 1 margarEt C. WhItman Company eBay United States Industry Information Technology
  • 26. tEnurE 1998–2008 total sharEholdEr rEturn Country Adjusted 1,434% Industry Adjusted 1,368% markEt CapItalIzatIon ChangE +40B 2 dong mIngzhu Company Gree Electric Appliances China Industry Consumer Goods tEnurE 2001– total sharEholdEr rEturn Country Adjusted 975% Industry Adjusted 1,360% markEt CapItalIzatIon ChangE +8B 3 Carol mEyroWItz Company TJX United States Industry Retail tEnurE 2007– total sharEholdEr rEturn Country Adjusted 226% Industry Adjusted 204% markEt CapItalIzatIon ChangE +24B 4 zou lIhua
  • 27. Company Xinhu Zhongbao China Industry Financial Services tEnurE 2006–2009 total sharEholdEr rEturn Country Adjusted 167% Industry Adjusted 284% markEt CapItalIzatIon ChangE +7B 5 hElIanE CanEpa Company Nobel Biocare Switzerland Industry Health Care tEnurE 2001–2007 total sharEholdEr rEturn Country Adjusted 142% Industry Adjusted 225% markEt CapItalIzatIon ChangE +8B 13 ovErall rank Mikhail Prokhorov Company Norilsk Nickel Industry Materials tEnurE
  • 28. 2001–2007 InsIdEr total sharEholdEr rEturn Country Adjusted Industry Adjusted markEt CapItalIzatIon ChangE ($ bIllIons) +48 mBa russIa 657% 1,250% *tIE 5 John C. Martin Company Gilead Sciences Industry Health Care tEnurE 1996– InsIdEr total sharEholdEr rEturn
  • 29. Country Adjusted Industry Adjusted markEt CapItalIzatIon ChangE ($ bIllIons) +51 mBa unItEd statEs 2,552% 2,474% ovErall rank 10 John T. Chambers Company Cisco Systems Industry Information Technology tEnurE 1995– InsIdEr total sharEholdEr rEturn Country Adjusted Industry Adjusted markEt CapItalIzatIon ChangE ($ bIllIons)
  • 30. +143 mBa unItEd statEs 564% 873% ovErall rank 9 Margaret C. Whitman Company eBay Industry Information Technology tEnurE 1998–2008 InsIdEr total sharEholdEr rEturn Country Adjusted Industry Adjusted markEt CapItalIzatIon ChangE ($ bIllIons) +40 mBa unItEd statEs
  • 31. 1,434% 1,368% ovErall rank 8 David Simon Company Simon Property Group Industry Financial Services tEnurE 1995– InsIdEr total sharEholdEr rEturn Country Adjusted Industry Adjusted markEt CapItalIzatIon ChangE ($ bIllIons) +47 mBa unItEd statEs 1,199% 1,410% ovErall rank 13
  • 32. Subir Raha Company Oil & Natural Gas Industry Energy tEnurE 2001–2006 InsIdEr total sharEholdEr rEturn Country Adjusted Industry Adjusted markEt CapItalIzatIon ChangE ($ bIllIons) +57 mBa IndIa 729% 915% ovErall rank *tIE 15 José Antonio Fernández Company
  • 33. FEMSA Industry Consumer Goods tEnurE 1995– InsIdEr total sharEholdEr rEturn Country Adjusted Industry Adjusted markEt CapItalIzatIon ChangE ($ bIllIons) +26 mBa mExICo 2,788% 1,183% ovErall rank HBR.ORG January–February 2013 Harvard Business Review 87 The BesT-Performing Ceos in The World What Accounts for success? Our 2010 article looked at several factors that might
  • 34. be relevant to good performance (whether CEOs were hired from inside the company, had an MBA, and so on). We tracked those factors again, and our global comparison revealed some insights into dif- ferences across the world. The insider-CEO story. Management thinkers have long debated whether it is better to appoint an insider as CEO or get someone from the outside to run the company. But most studies have focused on U.S. corporations. In our full sample of 3,143 CEOs, 74% were insid- ers. India had the lowest proportion (63%) and Japan the highest (90%). Overall, insiders did better than outsiders; the insiders’ average rank was 154 places higher than the outsiders’. This is similar to what we found in the 2010 global ranking. It didn’t hold true, however, in major parts of the world. Insiders got better results in the United States, the United King- dom, and Latin America, but there was no difference between insiders and outsiders in continental Eu- rope, China, and India. What about the idea that outsiders are prefer- able when a company is in trouble? We find that boards—especially in the United States and Europe— do have a slightly greater tendency than normal to hire outsiders when the company is underperform- ing (measured as having an industry-adjusted total shareholder return of -24% or worse for the two years before the CEO started). But the results those outsiders produced varied by region. In the United States they didn’t get better performance from strug- gling companies than insiders did. In Europe outsid- ers did better; the average rank of those who took
  • 35. over subpar performers was 370 places higher than the average rank of their insider counterparts. In Latin America, however, the picture was dif- ferent: The average rank of insiders who had taken the helm of poor performers was 750 places higher than that of outsiders who had. Regional factors help explain this disparity. A large number of Central and South American firms are family controlled; another large segment is government controlled. Business families—and, in some cases, governments—exer- cise a strong influence on long-term strategies and investment decisions, which makes it more difficult for a CEO who is new to a company to operate. The upshot: In the United States, outsider CEOs usually do not deliver the goods, whether the company is underperforming or not. But this find- ing can’t be generalized to other parts of the world. Boards need to keep regional success factors firmly in mind when selecting CEOs. The curse of great prior performance. If you want to create a lot of shareholder value, it pays to take over a company that hasn’t been doing well—at least if you’re in the United States, China, India, or the United Kingdom. In those countries a poorly performing predecessor is often followed by a high- performing one. But there is no such effect in conti- nental Europe, Japan, and Latin America. The greater continuity in company performance in Latin America is probably a reflection of the long- term control exercised by business families, investor syndicates, and governments, whose visions don’t
  • 36. change even as CEOs come and go. In Latin America those parties generally make the important bet-the- company decisions and policies, while CEOs are mainly responsible for execution. An MBA degree. In the wake of the financial crisis, MBAs were accused of being value destroy- ers. We supplied the debate with some contrary data in 2010, showing that the average MBA ranked 40 places higher in the study sample than the average non-MBA. We saw similar results in this year’s list. In this case, we did not discover that CEOs of cer- tain nationalities benefited more from an MBA than others. Industry. In general, industry differences count for very little in our analysis, explaining only about 5% of the variation in CEO performance. That said, the high-tech industry is overrepresented in the top 10, with five CEOs, including Amazon.com’s. CEOs from the energy industry, who make up only 5% of the group studied, are overrepresented in the top 100, where they occupy 15% of the slots. doing Well and doing good Many management thinkers argue that it is no longer enough to do well financially; companies also need to improve the well-being of (or at least not harm) the communities in which they operate, the environ- ment, and their employees. (See, for example, “Cre- ating Shared Value,” by Michael E. Porter and Mark R. Kramer, HBR January–February 2011.) That’s the good news. The bad news is that stellar performance on both dimensions is no common or easy feat. This year we examined the correlation between
  • 37. the financial performance of leaders on our list and their social and environmental performance as mea- sured by MSCI, a highly reputable firm that rates Top 5 Ceos IndIa 1 Y.C. deVesHWaR CompanY ITC IndusTRY Consumer Goods TenuRe 1996– ToTal sHaReHoldeR ReTuRn Country Adjusted 3,308% Industry Adjusted 1,574% maRkeT CapITalIzaTIon CHange +45B 2 suBIR RaHa CompanY Oil & Natural Gas IndusTRY Energy TenuRe 2001–2006 ToTal sHaReHoldeR ReTuRn Country Adjusted 729% Industry Adjusted 915% maRkeT CapITalIzaTIon CHange +57B 3 mukesH dHIRuBHaI amBanI CompanY Reliance Industries IndusTRY Energy TenuRe 2002–
  • 38. ToTal sHaReHoldeR ReTuRn Country Adjusted 565% Industry Adjusted 745% maRkeT CapITalIzaTIon CHange +41B 4 a.m. naIk CompanY Larsen & Toubro IndusTRY Industrials TenuRe 1999–2012 ToTal sHaReHoldeR ReTuRn Country Adjusted 3,154% Industry Adjusted 2,728% maRkeT CapITalIzaTIon CHange +16B 5 a.k. puRI CompanY Bharat Heavy Electricals IndusTRY Industrials TenuRe 2004–2008 ToTal sHaReHoldeR ReTuRn Country Adjusted 471% Industry Adjusted 664% maRkeT CapITalIzaTIon CHange +30B 88 Harvard Business Review January–february 2013 23
  • 39. Paolo Rocca Company Tenaris Industry Energy tEnurE 2002– InsIdEr markEt CapItalIzatIon ChangE ($ billions) +26 mBa argEntIna 816% 1,138% ovErall rank 24 Renato Alves Vale Company CCR Industry industrials
  • 40. tEnurE 1999– InsIdErmBa BrazIl 1,933% 2,658% ovErall rank 21 lew Frankfort Company Coach Industry Consumer Goods tEnurE 1995– InsIdErmBa unItEd statEs 2,260% 2,073% ovErall rank 19 Mark G. Papa
  • 41. Company EoG Resources Industry Energy tEnurE 1998– InsIdErmBa unItEd statEs 1,428% 1,201% ovErall rank total sharEholdEr rEturn CounTRy AdjusTEd indusTRy AdjusTEd total sharEholdEr rEturn CounTRy AdjusTEd indusTRy AdjusTEd ovErall rank 22 Hugh Grant Company Monsanto Industry Materials tEnurE
  • 42. 2003– InsIdEr markEt CapItalIzatIon ChangE ($ billions) +45 mBa unItEd statEs 781% 632% ovErall rank total sharEholdEr rEturn CounTRy AdjusTEd indusTRy AdjusTEd total sharEholdEr rEturn CounTRy AdjusTEd indusTRy AdjusTEd total sharEholdEr rEturn CounTRy AdjusTEd indusTRy AdjusTEd 17 li jiaxiang Company Air China Industry Transportation
  • 43. tEnurE 2004–2008 InsIdErmBa ChIna 731% 1,022% ovErall rank total sharEholdEr rEturn CounTRy AdjusTEd indusTRy AdjusTEd markEt CapItalIzatIon ChangE ($ billions) +37 18 daniel Hajj Aboumrad Company América Móvil Industry Telecommunication tEnurE 2000– InsIdErmBa mExICo
  • 44. 506% 684% ovErall rank total sharEholdEr rEturn CounTRy AdjusTEd indusTRy AdjusTEd markEt CapItalIzatIon ChangE ($ billions) +87 20 lars Rebien sØrensen Company novo nordisk Industry Health Care tEnurE 2000– InsIdErmBa dEnmark 470% 804% ovErall rank total sharEholdEr rEturn CounTRy AdjusTEd indusTRy AdjusTEd
  • 45. markEt CapItalIzatIon ChangE ($ billions) +64 markEt CapItalIzatIon ChangE ($ billions) +20 markEt CapItalIzatIon ChangE ($ billions) +25 25 Paul Chisholm Company ColT Telecom Group Industry Telecommunication tEnurE 1996–2001 InsIdErmBa unItEd kIngdom 1,905% 1,761% ovErall rank
  • 46. total sharEholdEr rEturn CounTRy AdjusTEd indusTRy AdjusTEd markEt CapItalIzatIon ChangE ($ billions) +20 26 david E.i. Pyott Company Allergan Industry Health Care tEnurE 1998– InsIdErmBa unItEd statEs 949% 956% ovErall rank *tIE total sharEholdEr rEturn CounTRy AdjusTEd indusTRy AdjusTEd markEt CapItalIzatIon ChangE ($ billions)
  • 47. +25 26 djalma bastos de Morais Company Companhia Energética de Minas Gerais (CEMiG) Industry utilities tEnurE 1999– InsIdErmBa BrazIl 939% 1,649% ovErall rank *tIE total sharEholdEr rEturn CounTRy AdjusTEd indusTRy AdjusTEd markEt CapItalIzatIon ChangE ($ billions) +22 ovErall rank
  • 48. 28 Mukesh dhirubhai Ambani Company Reliance industries Industry Energy tEnurE 2002– InsIdErmBa IndIa 565% 745% total sharEholdEr rEturn CounTRy AdjusTEd indusTRy AdjusTEd markEt CapItalIzatIon ChangE ($ billions) +41 markEt CapItalIzatIon ChangE ($ billions) +19 HbR.oRG January–February 2013 Harvard business Review 89 top 5
  • 49. CEos EuropE 1 graham maCkay Company SABMiller United Kingdom Industry Consumer Goods tEnurE 1997– total sharEholdEr rEturn Country Adjusted 758% Industry Adjusted 626% markEt CapItalIzatIon ChangE +70B 2 lars rEBIEn sØrEnsEn Company Novo Nordisk Denmark Industry Health Care tEnurE 2000– total sharEholdEr rEturn Country Adjusted 470% Industry Adjusted 804% markEt CapItalIzatIon ChangE +64B 3 paul ChIsholm Company COLT Telecom Group United Kingdom Industry Telecommunication tEnurE 1996–2001 total sharEholdEr rEturn Country Adjusted 1,905%
  • 50. Industry Adjusted 1,761% markEt CapItalIzatIon ChangE +20B 4 garEth davIs Company Imperial Tobacco United Kingdom Industry Consumer Goods tEnurE 1996–2010 total sharEholdEr rEturn Country Adjusted 977% Industry Adjusted 579% markEt CapItalIzatIon ChangE +27B 5 mIkaEl lIlIus Company Fortum Finland Industry Utilities tEnurE 2000–2009 total sharEholdEr rEturn Country Adjusted 768% Industry Adjusted 1,014% markEt CapItalIzatIon ChangE +22B ADIDAS HERBERT HAINER INDITEX PABLO ISLA ÁLVAREZ
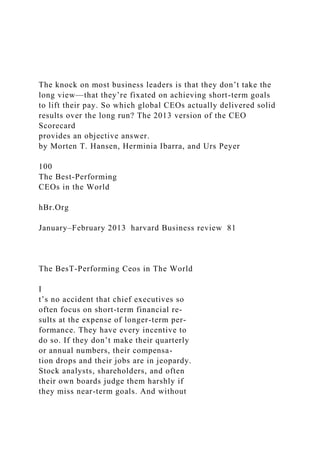
  • 51. DE TEJERA HERMÈS PATRICK THOMAS EATON ALEXANDER CUTLER 2010 RANKING DANONE FRANCK RIBOUD NATURA ALESSANDRO CARLUCCI THE BEST-PERFORMING CEOS IN THE WORLD major companies. Despite all the rhetoric, we discov- ered that the correlation between the two sets of data is, well, zero. You can see this clearly in the exhibit “Does Doing Good Help CEOs Do Well?” Companies are scattered all over this chart. Though many articles suggest that responsible corporate behavior—say, in sustainability—will automatically improve your bot- tom line, clearly it’s not as simple as that. Some com- panies probably aren’t managing with such issues in mind. Some may not have attractive social or envi- ronmental strategies; some may have misalignment between those strategies and the overall corporate strategy; and some may have incomplete measures of social or environmental practices.
  • 52. But the chart did reveal outliers. Five percent of the CEOs for which we had su� cient data fell into the box at the top right; they delivered great � nancial performance year over year and performed strongly on social and environmental dimensions. It is a rare achievement, indeed, but it is possible. These trendsetting CEOs are the new role models for leaders pursuing the paradigm of creating shared value. One example: Franck Riboud of Danone, a French multinational with $27 billion in annual sales. Danone’s excellent financial performance earned Does Doing Good Help CEOs Do Well? SOURCE BEST-PERFORMING CEOS SCORECARD DATA, 2013; MSCI ESG INTANGIBLE VALUE ASSESSMENTS, 2006–2010 This chart maps the long-term fi nancial performance of some 1,100 CEOs against their companies’ social and environmental performance for their last two years in offi ce. As the rela- tively even scattering of points across the chart shows, there is no overall correlation between fi nancial results and social responsibility. However, the chart does reveal numerous role models, who excelled in both areas. WORST BESTSHAREHOLDER PERFORMANCE RANK W O R ST
  • 54. FO R M A N C E SOCIALLY RESPONSIBLE CEOS ON THE RISE Four CEOs whose fi rms received high ratings for social responsibility moved into the top 15% of fi nancial performers in the 2013 study, joining role models from Natura and Danone. DETAIL him a spot in the top 10% of this year’s sample (a truly amazing achievement for a consumer goods company); at the same time, the company received extremely high ratings from MSCI. Another outlier is Natura’s Alessandro Carlucci (who made the top 6% for � nancial performance), a leader among CEOs who believe that alleviating poverty and inequality and protecting the environment are intimately tied to their business agendas. Carlucci and Riboud have both confronted the key social or environmental is- sue in their industry (in Danone’s case, obesity and unhealthful food consumption; in Natura’s, defores- tation and poverty) and redirected their company’s strategy to tackle it. We also looked at CEOs whose companies had
  • 55. high social and environmental performance in 2010 but whose � nancial performance kept them out of the top 15% of the group studied that year. Since do- ing both well and good can be a long-term strategy, we wanted to see whether any of those CEOs had then moved into the top 15% of the current � nancial ranking. We found four: the leaders of Adidas, Indi- tex, Hermès International, and Eaton. At Adidas, CEO Herbert Hainer oversaw the im- plementation of a triple-bottom-line philosophy, a 2013 RANKING 90 Harvard Business Review January–February 2013 Top 5 Ceos China 1 Li Jiaxiang Company Air China indusTry Transportation Tenure 2004–2008 ToTaL sharehoLder reTurn Country Adjusted 731% Industry Adjusted 1,022% markeT CapiTaLizaTion Change +37B 2 Wang dongming Company Citic Securities indusTry Financial Services
  • 56. Tenure 2002– ToTaL sharehoLder reTurn Country Adjusted 537% Industry Adjusted 861% markeT CapiTaLizaTion Change +12B 3 dong mingzhu Company Gree Electric Appliances indusTry Consumer Goods Tenure 2001– ToTaL sharehoLder reTurn Country Adjusted 975% Industry Adjusted 1,360% markeT CapiTaLizaTion Change +8B 4 Li Jianhong Company China International Marine Containers indusTry Industrials Tenure 1995–2007 ToTaL sharehoLder reTurn Country Adjusted 2,686% Industry Adjusted 3,426% markeT CapiTaLizaTion Change +5B 5 Che shuChun Company Shanxi Xishan Coal and
  • 57. Electricity Power indusTry Energy Tenure 2007–2010 ToTaL sharehoLder reTurn Country Adjusted 354% Industry Adjusted 414% markeT CapiTaLizaTion Change +9B 29 Manoel Arlindo Zaroni Torres Company Tractebel Energia indusTry Utilities Tenure 1999– insidermBa BraziL 3,171% 2,585% overaLL rank ToTaL sharehoLder reTurn CoUnTry AdjUsTEd IndUsTry AdjUsTEd 30 Mark donegan
  • 58. Company Precision Castparts indusTry Industrials Tenure 2002– insidermBa uniTed sTaTes 1,237% 1,190% overaLL rank ToTaL sharehoLder reTurn CoUnTry AdjUsTEd IndUsTry AdjUsTEd 31 William E. Greehey Company Valero Energy indusTry Energy Tenure 1997–2005 insidermBa
  • 59. uniTed sTaTes 721% 629% overaLL rank ToTaL sharehoLder reTurn CoUnTry AdjUsTEd IndUsTry AdjUsTEd 32 A.M. naik Company Larsen & Toubro indusTry Industrials Tenure 1999–2012 insidermBa india 3,154% 2,728% overaLL rank ToTaL sharehoLder reTurn CoUnTry AdjUsTEd IndUsTry AdjUsTEd 34 Mikael Lilius
  • 60. Company Fortum indusTry Utilities Tenure 2000–2009 insidermBa FinLand 768% 1,014% overaLL rank ToTaL sharehoLder reTurn CoUnTry AdjUsTEd IndUsTry AdjUsTEd 37 david C. novak Company yum Brands indusTry Consumer Goods Tenure 2000– insidermBa
  • 61. uniTed sTaTes 658% 567% overaLL rank ToTaL sharehoLder reTurn CoUnTry AdjUsTEd IndUsTry AdjUsTEd 38 A.K. Puri Company Bharat Heavy Electricals indusTry Industrials Tenure 2004–2008 insidermBa india 471% 664% overaLL rank ToTaL sharehoLder reTurn CoUnTry AdjUsTEd IndUsTry AdjUsTEd 39 Fu Chengyu
  • 62. Company CnooC indusTry Energy Tenure 2003–2011 insidermBa hong kong 448% 395% overaLL rank ToTaL sharehoLder reTurn CoUnTry AdjUsTEd IndUsTry AdjUsTEd 40 john rowe Company Aetna indusTry Health Care Tenure 2000–2006 insidermBa
  • 63. uniTed sTaTes 679% 566% overaLL rank ToTaL sharehoLder reTurn CoUnTry AdjUsTEd IndUsTry AdjUsTEd markeT CapiTaLizaTion Change ($ BILLIons) +18 markeT CapiTaLizaTion Change ($ BILLIons) +21 markeT CapiTaLizaTion Change ($ BILLIons) +36 markeT CapiTaLizaTion Change ($ BILLIons) +16 33 Gareth davis Company Imperial Tobacco indusTry Consumer Goods
  • 64. Tenure 1996–2010 insidermBa uniTed kingdom 977% 579% overaLL rank ToTaL sharehoLder reTurn CoUnTry AdjUsTEd IndUsTry AdjUsTEd markeT CapiTaLizaTion Change ($ BILLIons) +27 markeT CapiTaLizaTion Change ($ BILLIons) +22 35 Eric E. schmidt Company Google indusTry Information Technology Tenure 2001–2011
  • 65. insidermBa uniTed sTaTes 448% 401% overaLL rank ToTaL sharehoLder reTurn CoUnTry AdjUsTEd IndUsTry AdjUsTEd markeT CapiTaLizaTion Change ($ BILLIons) +143 36 Masahiro sakane Company Komatsu indusTry Industrials Tenure 2003–2007 insidermBa Japan 652% 493% overaLL rank
  • 66. ToTaL sharehoLder reTurn CoUnTry AdjUsTEd IndUsTry AdjUsTEd markeT CapiTaLizaTion Change ($ BILLIons) +40 markeT CapiTaLizaTion Change ($ BILLIons) +31 markeT CapiTaLizaTion Change ($ BILLIons) +30 markeT CapiTaLizaTion Change ($ BILLIons) +83 markeT CapiTaLizaTion Change ($ BILLIons) +27 HBr.orG January–February 2013 Harvard Business review 91 THE BEST-PERFORMING CEOS IN THE WORLD massive push to slash the company’s carbon foot- print, and the increased use of recycled polyester as
  • 67. well as sustainably farmed cotton in products. One of Adidas’s latest sustainable innovations is DryDye technology, which removes the need for water in the dyeing process. At Eaton, Alexander Cutler has embedded sustainability into the company’s culture and practices. The diversi� ed power management company develops innovative products and pro- cesses, such as hybrid electric and hydraulic power trains and electric power control systems, that help customers and consumers conserve resources and reduce their carbon footprint. This new breed of leaders not only rejects the idea that � nancial market demands are more impor- tant than stakeholders’ needs but also demonstrates that companies can excel at meeting both. These CEOs have shown the way, and others can learn from them. We don’t foresee a time in the near future when measures of social performance will be as objective as the measure of long-term � nancial performance we’ve developed. That said, we will continue to track how CEOs are doing in the two areas, with the aim of encouraging leaders to shine in both. EVERYONE IN the business world seems to agree that executives should be less obsessed with quarterly earnings and more focused on the long term—every- one, that is, except the decision makers who hire and � re executives and the people who buy and sell com- pany stock. The short-term emphasis won’t change until a new paradigm for evaluating performance emerges. Talk alone won’t bring about that change; we also need a whole new method of evaluating CEOs. Here, we’re proposing two key improvements:
  • 68. a robust, objective measure of leaders’ performance over their full terms in o� ce, benchmarking all chief executives of major global companies; and an assess- ment of the correlation between a � rm’s � nancial re- sults and its environmental and social practices. We hope that boards of directors, pension funds, hedge funds, and other shareholder activists will use these measures to better evaluate CEOs and to guide the selection of tomorrow’s leaders. HBR Reprint R1301F Metrics. We pulled fi nancial data from Datastream and Worldscope and calculated daily company returns for the entire length of each CEO’s tenure (or until August 31, 2012, if the CEO was still in of- fi ce). We calculated three sets of numbers: Country-adjusted company returns. We computed a company’s total shareholder return (including dividends reinvested) for the CEO’s tenure. We then computed the aver- age return for other fi rms from the same country over the same period and subtracted that fi gure from the company’s return. This measure thus excludes any increase in stock return that is merely attributable to an improvement in the general stock market of a country. Industry-adjusted company
  • 69. returns. We also deducted the average return for the industry, to exclude any increases that were the result of rising fortunes for the overall industry. Market capitalization change. We measured the change in the company’s equity market capitaliza- tion over the CEO’s tenure. We ad- justed this fi gure for infl ation in each country and translated values into U.S. dollars, using 2011 exchange rates. We added to this number the infl ation-adjusted value of the dividends and shares repurchased, and subtracted the adjusted value of shares issued. We then ranked all CEOs for each metric—from 1 (best) to 3,143 (worst)—and calculated the average of the three rankings for every CEO to create the fi nal overall ranking. Using three metrics is a balanced and robust approach: While the fi rst two metrics risk being skewed to- ward smaller companies (it’s easier to get large returns if you start from a small base), the third is skewed toward larger companies. Analysis. We performed regres- sion analysis on the data set of 3,143 CEOs. This allowed us to “control”
  • 70. for some factors and isolate the ef- fect that one factor (such as having an MBA) had on a CEO’s standing in the ranking. Signifi cant eff ects are reported in this article. How We Created the Scorecard We selected the CEOs we tracked from the following indexes: • S&P Global 1200, 1997–2010 • S&P CNX 500, 1998–2010 (for India) • Shanghai and Shenzhen Stock Exchanges, 1998–2010 • MSCI Emerging Markets Latin America Index and AméricaEconomía 500, 2002–2010 • S&P BRIC 40, 1997–2010 To make sure we had reliable and suffi cient data, we excluded CEOs who had assumed their role before 1995 or after August 31, 2010. (For example, Tim Cook of Apple is not eligible because he became CEO in 2011.) And we in- cluded only those whose tenure lasted more than two years. All told, we ended up with 3,143 CEOs from 1,862 companies, of whom 1,007 were still in offi ce on the date we stopped measuring performance. The entire group represented 64 nationalities and came from companies based in 37 countries. Nana von Bernuth, project manager, led the eff ort to create and analyze the ranking. Morten T. Hansen is a management professor at the University of California, Berkeley, School of Information, and at Insead, in Fontainebleau, France. Herminia Ibarra is the Cora Chaired Professor of Leadership and Learning and a professor of organizational behavior at Insead. Urs Peyer is an associate professor of fi nance at Insead.
  • 71. 92 Harvard Business Review January–February 2013 Top 5 Ceos LaTin ameriCa 45 Oscar González Rocha Company Southern Copper indusTry Materials Tenure 2004– insider markeT CapiTaLizaTion Change ($ billions) +39 mBa mexiCo 411% 530%
  • 72. overaLL rank 1 roger agneLLi Company Vale Brazil indusTry Materials Tenure 2001–2011 ToTaL sharehoLder reTurn Country Adjusted 934% Industry Adjusted 1,773% markeT CapiTaLizaTion Change +157B 2 maurÍCio novis BoTeLho Company Embraer Brazil indusTry Industrials Tenure 1995–2007 ToTaL sharehoLder reTurn Country Adjusted 5,881% Industry Adjusted 2,895% markeT CapiTaLizaTion Change +23B 3 JosÉ anTonio FernÁndez Company FEMSA Mexico indusTry Consumer Goods Tenure 1995– ToTaL sharehoLder reTurn Country Adjusted 2,788%
  • 73. Industry Adjusted 1,183% markeT CapiTaLizaTion Change +26B 4 danieL haJJ aBoumrad Company América Móvil Mexico indusTry Telecommunication Tenure 2000– ToTaL sharehoLder reTurn Country Adjusted 506% Industry Adjusted 684% markeT CapiTaLizaTion Change +87B o 5 paoLo roCCa Company Tenaris Argentina indusTry Energy Tenure 2002– ToTaL sharehoLder reTurn Country Adjusted 816% Industry Adjusted 1,138% markeT CapiTaLizaTion Change +26B 816 1,138 26 26278.10368 For more on The Ceos go To
  • 74. hBr.org 46 Bart Becht Company Reckitt Benckiser indusTry Consumer Goods Tenure 1999–2011 insider markeT CapiTaLizaTion Change ($ billions) +44 mBa uniTed kingdom 467% 420% overaLL rank 41 John W. Thompson Company Symantec
  • 75. indusTry Information Technology Tenure 1999–2009 insider markeT CapiTaLizaTion Change ($ billions) +21 mBa uniTed sTaTes 838% 851% overaLL rank ToTaL sharehoLder reTurn COunTRy AdJuSTed InduSTRy AdJuSTed 42 Pietro Franco Tali Company Saipem indusTry energy Tenure
  • 76. 2000– insider markeT CapiTaLizaTion Change ($ billions) +21 mBa iTaLy 706% 924% overaLL rank ToTaL sharehoLder reTurn COunTRy AdJuSTed InduSTRy AdJuSTed 43 Company express Scripts indusTry Health Care Tenure 2005– insider markeT CapiTaLizaTion Change ($ billions)
  • 77. +48 mBa uniTed sTaTes 448% 442% overaLL rank George Paz ToTaL sharehoLder reTurn COunTRy AdJuSTed InduSTRy AdJuSTed 44 Robert L. Tillman Tenure 1996–2005 insidermBa uniTed sTaTes overaLL rank Company Lowe’s indusTry Retail markeT CapiTaLizaTion Change ($ billions)
  • 78. +44 459% 456% ToTaL sharehoLder reTurn COunTRy AdJuSTed InduSTRy AdJuSTed ToTaL sharehoLder reTurn COunTRy AdJuSTed InduSTRy AdJuSTed ToTaL sharehoLder reTurn COunTRy AdJuSTed InduSTRy AdJuSTed 47 david B. Snow Jr. Company Medco Health Solution s indusTry Health Care Tenure 2003–2012 insider
  • 79. markeT CapiTaLizaTion Change ($ billions) +33 mBa uniTed sTaTes 515% 455% overaLL rank ToTaL sharehoLder reTurn COunTRy AdJuSTed InduSTRy AdJuSTed 48 James d. Taiclet Jr. Company American Tower indusTry
  • 80. Telecommunication Tenure 2003– insider markeT CapiTaLizaTion Change ($ billions) +29 mBa uniTed sTaTes 554% 485% overaLL rank ToTaL sharehoLder reTurn COunTRy AdJuSTed InduSTRy AdJuSTed 49
  • 81. Tomeo Kanbayashi Company nTT data indusTry Information Technology Tenure 1995–1999 insider markeT CapiTaLizaTion Change ($ billions) +30 mBa Japan 658% 406% overaLL rank
  • 82. ToTaL sharehoLder reTurn COunTRy AdJuSTed InduSTRy AdJuSTed 50 Shafagat Fakhrazo- vich Takhautdinov Company Tatneft indusTry energy Tenure 1999– insider markeT CapiTaLizaTion Change ($ billions) +14 mBa
  • 83. russia 983% 1,285% overaLL rank ToTaL sharehoLder reTurn COunTRy AdJuSTed InduSTRy AdJuSTed HBR.ORG January–February 2013 Harvard Business Review 93 The BesT-Performing Ceos in The World 51 Tim SolSo Company Cummins United States induSTry Industrials Tenure 2000–2011 mBa Yes
  • 84. inSider Yes ToTal Shareholder reTurn Country Adjusted 847% Industry Adjusted 734% markeT CapiTalizaTion Change +16B 52 paBlo iSla Álvarez de Tejera Company Inditex Spain induSTry Retail Tenure 2005– mBa No inSider No ToTal Shareholder reTurn Country Adjusted 369% Industry Adjusted 340% markeT CapiTalizaTion Change +61B 53 mark C. pigoTT Company PACCAR
  • 85. United States induSTry Industrials Tenure 1997– mBa No inSider Yes ToTal Shareholder reTurn Country Adjusted 729% Industry Adjusted 745% markeT CapiTalizaTion Change +17B 54 Frank Chapman Company BG Group United Kingdom induSTry Energy Tenure 2000– mBa No inSider Yes ToTal Shareholder reTurn Country Adjusted 408% Industry Adjusted 315% markeT CapiTalizaTion Change +58B
  • 86. 55 marShall o. larSen Company Goodrich United States induSTry Industrials Tenure 2003–2012 mBa No inSider Yes ToTal Shareholder reTurn Country Adjusted 887% Industry Adjusted 773% markeT CapiTalizaTion Change +15B 56 philip g. Cox Company International Power United Kingdom induSTry Utilities Tenure 2003– mBa No inSider Yes ToTal Shareholder reTurn Country Adjusted 442% Industry Adjusted 380%
  • 87. markeT CapiTalizaTion Change +33B 57 john C.S. lau Company Husky Energy Canada induSTry Energy Tenure 2000–2010 mBa No inSider Yes ToTal Shareholder reTurn Country Adjusted 437% Industry Adjusted 553% markeT CapiTalizaTion Change +23B 58 STanley Fink Company Man Group United Kingdom induSTry Financial Services Tenure 2000–2007 mBa No inSider Yes
  • 88. ToTal Shareholder reTurn Country Adjusted 618% Industry Adjusted 731% markeT CapiTalizaTion Change +17B 59 a.j. SCheepBouwer Company Royal KPN Netherlands induSTry Telecommunication Tenure 2001–2011 mBa No inSider Yes ToTal Shareholder reTurn Country Adjusted 283% Industry Adjusted 459% markeT CapiTalizaTion Change +40B 60 ChriSTopher m. Connor Company Sherwin-Williams United States
  • 89. induSTry Retail Tenure 1999– mBa No inSider Yes ToTal Shareholder reTurn Country Adjusted 747% Industry Adjusted 737% markeT CapiTalizaTion Change +16B 61 Benjamin STeinBruCh Company CSN Brazil induSTry Materials Tenure 2002– mBa No inSider Yes ToTal Shareholder reTurn Country Adjusted 666% Industry Adjusted 1,058% markeT CapiTalizaTion Change +14B
  • 90. 62 william a. oSBorn Company Northern Trust United States induSTry Financial Services Tenure 1995–2008 mBa Yes inSider Yes ToTal Shareholder reTurn Country Adjusted 552% Industry Adjusted 604% markeT CapiTalizaTion Change +19B 63 miguel gomeS pereira SarmienTo guTierrez Company Lojas Americanas Brazil induSTry Retail Tenure 2001– mBa Yes inSider Yes ToTal Shareholder reTurn
  • 91. Country Adjusted 7,500% Industry Adjusted 7,576% markeT CapiTalizaTion Change +9B 64 kong Qingping Company China Overseas Land and Investment Hong Kong induSTry Financial Services Tenure 2001–2007 mBa Yes inSider Yes ToTal Shareholder reTurn Country Adjusted 1,416% Industry Adjusted 1,303% markeT CapiTalizaTion Change +11B 65 *Tie Sunil BharTi miTTal Company Bharti Airtel India induSTry Telecommunication
  • 92. Tenure 1995– mBa No inSider Yes ToTal Shareholder reTurn Country Adjusted 562% Industry Adjusted 737% markeT CapiTalizaTion Change +16B 65 *Tie peTer marrone Company Yamana Gold Canada induSTry Materials Tenure 2003– mBa No inSider Yes ToTal Shareholder reTurn Country Adjusted 849% Industry Adjusted 1,185% markeT CapiTalizaTion Change +12B 67 ronald l.
  • 93. havner jr. Company Public Storage United States induSTry Other Tenure 2002– mBa No inSider Yes ToTal Shareholder reTurn Country Adjusted 501% Industry Adjusted 390% markeT CapiTalizaTion Change +24B 68 *Tie Sidney Toledano Company Christian Dior France induSTry Consumer Goods Tenure 1998– mBa No inSider Yes ToTal Shareholder reTurn Country Adjusted 435% Industry Adjusted 327% markeT CapiTalizaTion
  • 94. Change +31B 68 *Tie paTriCk darold daniel Company Enbridge Canada induSTry Energy Tenure 2001– mBa No inSider Yes ToTal Shareholder reTurn Country Adjusted 355% Industry Adjusted 511% markeT CapiTalizaTion Change +24B 70 71 r. david yoST Company AmerisourceBergen United States induSTry Health Care Tenure 1997–2011
  • 95. mBa Yes inSider Yes ToTal Shareholder reTurn Country Adjusted 579% Industry Adjusted 625% markeT CapiTalizaTion Change +16B 72 paTriCk ThomaS Company Hermès International France induSTry Consumer Goods Tenure 2003– mBa No inSider Yes ToTal Shareholder reTurn Country Adjusted 465% Industry Adjusted 321% markeT CapiTalizaTion Change +28B 73 manFred wennemer
  • 96. Company Continental Germany induSTry Automobile Tenure 2001–2008 mBa Yes inSider Yes ToTal Shareholder reTurn Country Adjusted 553% Industry Adjusted 958% markeT CapiTalizaTion Change +14B 74 C. john wilder Company TXU United States induSTry Utilities Tenure 2004–2007 mBa Yes inSider No ToTal Shareholder reTurn Country Adjusted 397% Industry Adjusted 313% markeT CapiTalizaTion Change +33B
  • 97. 75 pedro wongTSChowSki Company Ultrapar Brazil induSTry Energy Tenure 2007– mBa No inSider Yes ToTal Shareholder reTurn Country Adjusted 763% Industry Adjusted 840% markeT CapiTalizaTion Change +19B joÃo mauriCio giFFoni de CaSTro neveS Company Ambev Brazil induSTry Consumer Goods Tenure 2009– mBa Yes inSider Yes
  • 98. ToTal Shareholder reTurn Country Adjusted 276% Industry Adjusted 297% markeT CapiTalizaTion Change +99B 94 Harvard Business Review January–february 2013 76 Kenneth W. Freeman Company Quest Diagnostics United States Industry Health Care tenure 1996–2004 mBa Yes InsIder Yes total shareholder return Country Adjusted 1,014% Industry Adjusted 1,102% marKet CapItalIzatIon Change +11B
  • 99. 77 thomas p. maC mahon Company Laboratory Corp. of America Holdings United States Industry Health Care tenure 1997–2006 mBa Yes InsIder No total shareholder return Country Adjusted 869% Industry Adjusted 959% marKet CapItalIzatIon Change +11B 78 phIlIp K.r. pasCall Company First Quantum Minerals Canada Industry Materials tenure 1996– mBa Yes InsIder No
  • 100. total shareholder return Country Adjusted 1,917% Industry Adjusted 2,687% marKet CapItalIzatIon Change +9B 79 terry leahy Company Tesco United Kingdom Industry Retail tenure 1997–2011 mBa No InsIder Yes total shareholder return Country Adjusted 293% Industry Adjusted 304% marKet CapItalIzatIon Change +49B 80 BlaKe W. nordstrom Company Nordstrom United States
  • 101. Industry Retail tenure 2000– mBa No InsIder Yes total shareholder return Country Adjusted 717% Industry Adjusted 615% marKet CapItalIzatIon Change +14B 81 *tIe tIm Koogle Company Yahoo United States Industry Information Technology tenure 1995–2001 mBa No InsIder N0 total shareholder return Country Adjusted 566% Industry Adjusted 559% marKet CapItalIzatIon Change +14B
  • 102. 81 *tIe roy gardner Company Centrica United Kingdom Industry Utilities tenure 1997–2006 mBa No InsIder Yes total shareholder return Country Adjusted 342% Industry Adjusted 496% marKet CapItalIzatIon Change +20B 83 *tIe Wang dongmIng Company Citic Securities China Industry Financial Services tenure 2002– mBa No InsIder Yes total shareholder return Country Adjusted 537% Industry Adjusted 861%
  • 103. marKet CapItalIzatIon Change +12B 83 *tIe mIng-KaI tsaI Company MediaTek Taiwan Industry Information Technology tenure 1997– mBa No InsIder No total shareholder return Country Adjusted 423% Industry Adjusted 648% marKet CapItalIzatIon Change +15B 85 marCelo aWad Company Antofagasta Chile Industry Materials tenure 2004–2012 mBa No
  • 104. InsIder Yes total shareholder return Country Adjusted 464% Industry Adjusted 394% marKet CapItalIzatIon Change +19B 96 paul Walsh Company Diageo United Kingdom Industry Consumer Goods tenure 2000– mBa No InsIder Yes total shareholder return Country Adjusted 332% Industry Adjusted 200% marKet CapItalIzatIon Change +61B 97 John mCadam Company Imperial Chemical Industries
  • 105. United Kingdom Industry Materials tenure 2003–2008 mBa No InsIder Yes total shareholder return Country Adjusted 505% Industry Adjusted 557% marKet CapItalIzatIon Change +13B 98 dong mIngzhu Company Gree Electric Appliances China Industry Consumer Goods tenure 2001– mBa Yes InsIder Yes total shareholder return Country Adjusted 975% Industry Adjusted 1,360% marKet CapItalIzatIon Change +8B
  • 106. 99 Jon FredrIK BaKsaas Company Telenor Norway Industry Telecommunication tenure 2002– mBa No InsIder Yes total shareholder return Country Adjusted 206% Industry Adjusted 464% marKet CapItalIzatIon Change +27B 100 noBuo Katsumata Company Marubeni Japan Industry Industrials tenure 2003–2008 mBa No InsIder Yes total shareholder return
  • 107. Country Adjusted 516% Industry Adjusted 416% marKet CapItalIzatIon Change +14B 91 merrIll a. mIller Jr. Company National Oilwell Varco United States Industry Energy tenure 2001– mBa Yes InsIder Yes total shareholder return Country Adjusted 329% Industry Adjusted 273% marKet CapItalIzatIon Change +30B 92 *tIe ronald alVIn Brenneman Company Petro-Canada
  • 108. Canada Industry Energy tenure 2000–2009 mBa No InsIder Yes total shareholder return Country Adjusted 314% Industry Adjusted 409% marKet CapItalIzatIon Change +21B 92 *tIe phIlIppe VarIn Company Corus United Kingdom Industry Materials tenure 2003–2009 mBa No InsIder No total shareholder return Country Adjusted 799% Industry Adjusted 761% marKet CapItalIzatIon Change +10B
  • 109. 94 harry roels Company RWE Germany Industry Utilities tenure 2003–2007 mBa No InsIder No total shareholder return Country Adjusted 206% Industry Adjusted 312% marKet CapItalIzatIon Change +62B 95 gÉrard mestrallet Company Suez France Industry Utilities tenure 1995–2008 mBa No InsIder Yes total shareholder return Country Adjusted 163% Industry Adjusted 388%
  • 110. marKet CapItalIzatIon Change +70B 86 Wang JIanzhou Company China Mobile Hong Kong Industry Telecommunication tenure 2004–2010 mBa No InsIder Yes total shareholder return Country Adjusted 218% Industry Adjusted 266% marKet CapItalIzatIon Change +189B 87 naVeen JIndal Company Jindal Steel & Power India Industry Materials tenure 1998– mBa Yes InsIder Yes
  • 111. total shareholder return Country Adjusted 7,315% Industry Adjusted 5,704% marKet CapItalIzatIon Change +7B 88 grant alFred KIng Company Origin Energy Australia Industry Energy tenure 2000– mBa No InsIder Yes total shareholder return Country Adjusted 985% Industry Adjusted 1,673% marKet CapItalIzatIon Change +8B 89 V.s. JaIn Company Steel Authority of India India
  • 112. Industry Materials tenure 2002–2006 mBa No InsIder Yes total shareholder return Country Adjusted 788% Industry Adjusted 843% marKet CapItalIzatIon Change +10B 90 mattheW K. rose Company Burlington Northern Santa Fe United States Industry Industrials tenure 2000– mBa No InsIder Yes total shareholder return Country Adjusted 364% Industry Adjusted 252% marKet CapItalIzatIon Change +31B
  • 113. HBR.ORG January–February 2013 Harvard Business Review 95 Harvard Business Review Notice of Use Restrictions, May 2009 Harvard Business Review and Harvard Business Publishing Newsletter content on EBSCOhost is licensed for the private individual use of authorized EBSCOhost users. It is not intended for use as assigned course material in academic institutions nor as corporate learning or training materials in businesses. Academic licensees may not use this content in electronic reserves, electronic course packs, persistent linking from syllabi or by any other means of incorporating the content into course resources. Business licensees may not host this content on learning management systems or use persistent linking or other
  • 114. means to incorporate the content into learning management systems. Harvard Business Publishing will be pleased to grant permission to make this content available through such means. For rates and permission, contact [email protected]