1. (REFEREED RESEARCH)
THE USE OF THE TAGUCHI DESIGN OF EXPERIMENT
METHOD IN OPTIMIZING SPIRALITY ANGLE OF
SINGLE JERSEY FABRICS
TAGUCHİ DENEYSEL TASARIMININ SÜPREM KUMAŞLARIN MAY
DÖNMESİ AÇISININ OPTİMİZASYONUNDA KULLANIMI
Serin MAVRUZ MEZARCIÖZ*, R. Tuğrul OĞULATA
Çukurova University, Department of Textile Engineering, Adana, Turkey
Received: 17.12.2010 Accepted: 05.09.2011
ABSTRACT
In this paper, spirality angle of single jersey fabrics was optimized using the Taguchi experiment design technique, which is a recently
famous approach. In the evaluations, analysis of variance (ANOVA) and signal to noise ratio (S/N) were used. Nine fabric configurations
with respect to L9 orthogonal design for Taguchi approach were knitted and tested. Relaxation treatment, yarn type and loop length,
effecting on spirality angle were selected as control factors. Based on the S/N ratio and ANOVA analyses, the optimum levels of these
parameters obtained in this paper, relaxation type of dry relaxation, yarn type of open end yarn, loop length of 0,25 cm. By using the Taguchi
experimental design approach, low number of experiments can be performed to achieve the combination providing the best performance.
Thus, before starting manufacturing in factory, it can be easily predict the spirality angle of single jersey fabrics using the defined factors.
Key Words: Experimental design, Taguchi design, Knitted fabrics, Spirality, Optimization.
ÖZET
Bu çalışmada, son yıllarda kullanımı yaygınlaşmaya başlayan Taguchi deneysel tasarımına göre süprem kumaşların may dönmesi
açısının optimizasyonu gerçekleştirilmiştir. Değerlendirmelerde varyans analizi (ANOVA) ve sinyal gürültü oranı (S/N) kullanılmış olup, L9
ortogonal dizaynına göre üretilen 9 farklı örme kumaş ile denemeler yapılmıştır. Relaksasyon türü, iplik üretim tipi ve ilmek iplik uzunluğu
may dönmesini etkileyen kontrol faktörleri olarak seçilmiştir. S/N oranı ve varyans analizine göre; relaksasyon türü olarak kuru relaksasyon,
iplik üretim tipi olarak open end iplik ve ilmek iplik uzunluğu olarak 0.25 cm bu parametrelerin optimum düzeyleri olarak elde edilmiştir.
Taguchi tasarımının kullanılması az sayıda deneme ile en iyi performansın elde edilmesini ve üretimden önce, belirli faktörler yardımıyla
may dönmesi açısının tahminlenmesini sağlamıştır.
Anahtar Kelimeler: Deneysel tasarım, Taguchi tasarım, Örme kumaşlar, May dönmesi, Optimizasyon.
* Corresponding Author: Serin Mavruz Mezarcıöz, smavruz@cu.edu.tr, Tel: +90 322 3386084 Fax: +90 322 3386126
1. INTRODUCTION
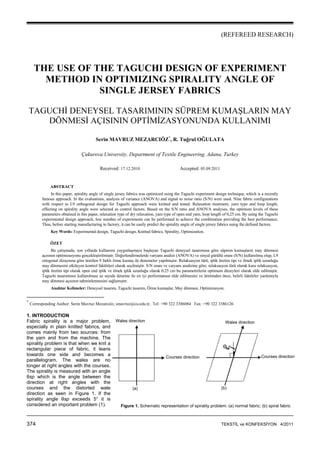
Fabric spirality is a major problem,
Wales direction
especially in plain knitted fabrics, and
comes mainly from two sources: from
the yarn and from the machine. The
spirality problem is that when we knit a
rectangular piece of fabric, it leans
towards one side and becomes a
parallelogram. The wales are no
Courses direction
longer at right angles with the courses.
The spirality is measured with an angle
θsp which is the angle between the
direction at right angles with the
courses and the distorted wale
(a)
direction as seen in Figure 1. If the
spirality angle θsp exceeds 5° it is
considered an important problem (1).
Wales direction
Courses direction
(b)
Figure 1. Schematic representation of spirality problem: (a) normal fabric; (b) spiral fabric
374 TEKSTİL ve KONFEKSİYON 4/2011
2. The Taguchi method, pioneered by Dr.
Genichi Taguchi and also called the
“robust design method”, greatly
improves engineering productivity (2).
Taguchi focused on minimizing the
effect of causes of variation. The
product or process performs
consistently on target and is relatively
insensitive to uncontrollable factors. In
comparison with a traditional full
factorial design of experiments,
Taguchi’s methods in general provide
a significant reduction in the size of
experiments, thereby speeding up the
experimental process (3). In Taguchi
design approach, there are three
design stages, which are system,
parameter and tolerance designs (2, 4,
5). The parameter design approach
has been adopted for studying the
effect of parameters on the spirality of
single jersey knitted fabrics.
Taguchi methodology for optimization
can be divided into four phases. viz.
planning, conducting, analysis and
validation. Each phase has a separate
objective and contributes towards the
overall optimization process (6-8). The
primary goal is to keep the variance in
the output very low even in the
presence of noise inputs. Thus, the
processes/products are made robust
against all variations (7).
Two major tools used in Taguchi
method are the orthogonal array (OA)
and the signal to noise ratio (SNR or
S/N ratio). OA is a matrix of numbers
arranged in rows and columns. A
typical OA is shown in Figure 2.
Factors
A B C D
1 1 1 1 1
2 1 2 2 2
3 1 3 3 3
4 2 1 2 3
5 2 2 3 1
6 2 3 1 2
7 3 1 3 2
8 3 2 1 3
9 3 3 2 1
L9(34)
Figure 2. L9(34) orthogonal array
Experiments
In this array, the columns are mutually
orthogonal. That is, for any pair of
columns, all combinations of factor
levels occur; and they repeat an equal
number of times. Here there are four
parameters A, B, C, and D, each at
three levels. This is called an "L9"
design, with the 9 indicating the nine
rows, configurations or prototypes
which are to be tested (9).
Taguchi suggests that the response
values at each inner array design point
be summarized by a performance
criterion called a signal to noise ratio.
S/N ratio is expressed in decibels (dB).
Conceptually, the S/N ratio (η) is the
ratio of signal to noise in terms of
power. Another way to look at it is that
it represents the ratio of sensitivity to
variability (4, 10). The higher the SNR,
the better quality of product is. The
idea is to maximize the SNR and
thereby minimizing the effect of
random noise factors has significant
impact on the process performance (5,
11).
Therefore, the method of calculating
the S/N ratio depends on whether the
quality characteristic is smaller-the-better,
larger-the-better, or nominal-the-
best (4, 8, 11, 12).
In our study, we adopt the “smaller is
better” approach. The S/N ratio for this
type of response was used and given
below:
S/N=
10 log 1 2 ⎤
(1)
⎥⎦
⎡
n
− Σ=
⎢⎣
n i
1
i y
Where; n is the number of experiments
in the orthogonal array and yi is the ith
measured value.
Taguchi design has been applied
many different areas, even in service
systems (5). However, studies about
application of Taguchi design in textile
industry are very new. Some
researchers used this design for
different textile process (2, 5, 13-22).
The effects of different characteristics
of the structure of knitted fabrics on
their spirality angle and prediction of
spirality angle have been investigated
by some researchers (23-27). In these
studies, correlations between spirality
angle and the structural parameters of
fabrics like stitch length, tightness
factor, yarn twist value, yarn linear
density, number of courses and wales
were investigated. In some of these
studies, the regression equations were
formed. In general, it was determined
that yarn twist value, loop length and
yarn linear density were the most
important factors on fabric spirality in
these studies. Also, any research has
been conducted on the spirality angle
of knitted fabrics from yarn and fabric
parameters using Taguchi design. In
the present study, it was focused on
optimizing the yarn and fabric
parameters affecting the spirality angle
of single jersey fabrics. For this
purpose, Taguchi experimental design
technique was employed. Firstly,
factors were chosen from cause-effect
diagram, which has an effect on the
spirality angle of the knitted fabrics.
Taguchi’s parameter design approach
has been used to plan, analyze and
confirm the experiments.
Determination of design parameters
Due to the difficulty and cost of
controlling certain parameters in
practical scenarios, this study
specifically emphasizes on factors
associated with materials, which can
be accepted as the major input.
During the relaxation treatment, knitted
fabrics tend to go back to the original
forms by getting away the stress.
Since relaxation treatment has
changed shape of the loop, it would be
affect the spirality angle of fabrics.
Also; the type of yarn production (ring,
compact and open-end) impressed the
physical features of yarns and fabrics
produced from these yarns would be
demonstrated different performance
properties. If amount of yarn that is
essential for one stitch are increased,
the fabrics are looser and its weight
decreases. Hence, some fabric
performances are affected.
So, relaxation treatment, yarn type and
loop length, effecting on spirality angle
are selected as control factors. Here,
yarn type is assumed as yarn
parameter, relaxation treatment and
loop length are assummed as fabric
parameter effecting on spirality angle.
After determining the control factors,
the levels of each factor have to be
determined. The most commonly used
yarn types were considered to
determine the levels of the factors.
Here, ring, compact and open-end
yarns were selected as the yarn type.
0.25, 0.28, and 0.32 cm were selected
as loop length (fabric tightness). Dry
relaxation, wash relaxation and full
relaxation were selected as relaxation
type. Used yarns were produced at
nearly closed machine settings each
other. As a result, each of the control
factors was evaluated with three
levels.
2. MATERIAL AND METHOD
100% cotton Ne 30/1 yarns were
knitted into single jersey structures on
Orizio circular knitting machine (28-
gauge 32-inch diameter, 2760 needle
count, with a positive yarn feeding
system). Yarn testing results are given
in Table 1. Table 2 gives the levels of
various parameters and their
designation.
TEKSTİL ve KONFEKSİYON 4/2011 375
3. Table 1. Yarn properties
Conventional ring yarn Compact yarn Open end yarn
Parameter
Ne 30 Ne 30 Ne 30
Actual count 29,36 29,36 28,80
Evenness U% 9,20 9,05 12,11
CVm % 11,60 11,40 15,23
Thin places (-50%)/km 0,3 0,0 59,2
Thick places (+50%)/km 7,1 6,6 75,3
Neps (+200%)/km 63,1 10,7 16,1
Hairiness 6,62 4,34 5,17
Breaking strength (gf) 354,1 381,9 226,2
Breaking elongation (%) 5,04 5,31 4,39
Rkm (kgf*Nm) 17,51 18,88 11,03
Breaking work (gf.cm) 482,7 535,6 283,2
Table 2. Parameters and their levels
Levels
Parameter Designation 1 2 3
Relaxation treatment
A
Dry
Washing
Yarn type
B
Ring
Compact
Loop length (cm)
C
0,25
0,28
Full
Open end
0,32
The following relaxation treatments
were applied to fabrics after knitting.
Dry relaxation: Fabrics were conditioned
for at least 24 hours in the standard
atmosphere (temperature: 20±2 ºC and
relative humidity: 65±2%). Washing
relaxation: After dry relaxation, fabrics
were washed in a domestic washer at
30ºC min 45 using 0.05% wetting
agent. After wetting, fabrics were
briefly hydro extracted. Then they were
conditioned in the same way as the dry
relaxation method. Full relaxation:
Washing relaxation procedure was
repeated for five times. Before tests
were taken, the fabrics were
conditioned for 48 h in a standard
atmosphere.
Measuring the angle of spirality, firstly
by using colored yarn on the knit
courses, the measuring areas are
determined. It is taken into consider
that for every fabric the measuring
areas should be in the same limits.
Spirality is measured from 5 points.
The angle of spirality is measured by
using a protractor between the specific
course direction, signed by using a
colored yarn and the wale direction,
which is followed from this course
direction. This test is applied according
to the IWS 276 test method (28). The
angle of spirality (θsp) method is
shown in Figure 3. All tests were
performed under standard atmospheric
conditions (temperature: 20±2 ºC and
relative humidity: 65±2%).
Figure 3. Measurement of the angle of
spirality
An L9 (33) orthogonal array table was
used. With three factors, each having
three levels, a total of 27 (33) full
factorial experiments to explore all
possible factor level combinations
would be required, and the cost and
effort of such experiments would be
quite large. However, the experimental
design of an orthogonal array required
only nine experiments. The L9(33)
orthogonal array table was shown in
Table 3.
Table 3. Orthogonal matrix for sample
production
Parameters
Order A B C
1 1 1 1
2 1 2 2
3 1 3 3
4 2 1 2
5 2 2 3
6 2 3 1
7 3 1 3
8 3 2 1
9 3 3 2
3. RESULTS AND DISCUSSION
Briefly, the Taguchi optimization
method consists of the following steps:
Each S/N ratio can be obtained from
observations according to the formula
of lower the better. For each significant
factor, the level corresponding to the
highest S/N ratio is chosen as its
optimum level. A search for the factors
that have a significant effect on the
S/N ratio is then performed through an
analysis of variance (ANOVA) of the
S/N ratios (2, 4). Table 4 shows the
average value of the spirality angle of
fabrics for each experimental point and
the S/N ratios calculated by formula 1.
It was seen that especially washing
treatments and increasing the loop
length rise the spirality angle in the
previous studies to be used the similar
materials. Closer results were also
found in this study.
For all levels, it was obtained average
SNR as shown in Table 5. Main effects
plotted for SNR is shown in Figure 4.
The largest S/N ratio (these were
indicated by rounding in the graph) for
each factor would be preferred. It
implied that the largest impact in
process consist of A1B3C1 respectively.
Minimum spirality degree levels
configuration for SNR are A1B3C1
which means that A (dry relaxation), B
(open end yarn), C (0.25 cm loop
length).
376 TEKSTİL ve KONFEKSİYON 4/2011
4. Table 4. Experimental layout using an L9 orthogonal array table and S/N ratio of experimental results
Factors and levels
Exp.
no
A B C Average spirality angle (º) S/N ratio (dB)
1 DR RY 0,25 8,2 -18,28
2 DR CY 0,28 12,0 -21,64
3 DR OEY 0,32 8,0 -18,09
4 WR RY 0,28 13,2 -22,42
5 WR CY 0,32 21,4 -26,61
6 WR OEY 0,25 4,0 -12,15
7 FR RY 0,32 22,4 -27,01
8 FR CY 0,25 10,0 -20,02
9 FR OEY 0,28 7,2 -17,19
DR: Dry relaxation, WR: Washing relaxation, FR: Full relaxation, RY: Ring yarn, CY: Compact yarn, OEY: Open end yarn
Table 5. Response table for S/N ratio
Average S/N (dB)
Factors
Level 1 Level 2 Level 3 Delta
A- Relaxation type -19.34* -20.39 -21.41 2.07
B- Yarn type -22.57 -22.75 -15.81* 6.94
C- Loop length -16.82* -20.42 -23.90 7.08
*: Optimum parameter level
A1 A2 A3
0
-5
-10
-15
-20
-25
-30
B1 B2 B3
S/N Ratio
0
-5
-10
-15
-20
-25
-30
C1 C2 C3
S/N Ratio
(a) (b) (c)
0
-5
-10
-15
-20
-25
-30
Figure 4. The effect of process parameters on S/N data-Factor A (relaxation type), factor B (yarn type), factor C (loop length)
Table 6. ANOVA table for the S/N
Factors Sum of
squares
Degree of
freedom
Mean
square
F
value
Prop Percentage
contribution (%)
Model 175,75 6 29,29 128,17 0,0078 -
A 6,43 2 3,21 14,06 0,0664 3,65
B 93,99 2 46,99 205,62 0,0048 53,34
C 75,34 2 37,67 164,82 0,0060 42,75
Residual 0,46 2 0,23 0,26
Total 176,21 8
R-squared: 0,997
S/N Ratio
3.1. ANOVA analysis
Statistical methods are powerful tools
for extracting useful information
contained in data and ANOVA is one
of the most frequently used tools (6).
ANOVA is the quantitative measure of
the influence of individual factors/
parameters. It is important for
determining the relative importance of
the various factors/parameters (29).
The end of results of S/N analysis was
used for realization of ANOVA. That
allows defining which factor and in
which level influences the final results
of experiments. ANOVA was
performed for S/N ratios with Design
TEKSTİL ve KONFEKSİYON 4/2011 377
5. Expert 6.0.1 statistical program
(α=0.05). An ANOVA table for S/N
ratio was given in Table 6.
The sum of squares, mean square, F
value, residual and also percentage
contribution of each factor were shown
in above ANOVA table. The degrees of
freedom (df) for each factor is
calculated as:
df = number of level – 1
With respect to Table 6, prob values
lower than 0.05 shows that the
established model is meaningful. Since
the value of R2 is 0.997,
expressiveness of the model is high.
This indicated that yarn type (B) and
loop length (C) the most significant
effect on fabric spirality values. The
contribution of different factors in
decreasing order as: Yarn type (53.34
%), loop length (42.75 %), relaxation
type (3.65 %) and undefined
parameters (0.26 %).
3.2. Confirmation experiment
Based on the S/N ratios and ANOVA
analyses, the optimal levels of all the
control factors’ combination were
identified. As mentioned before the
optimum setting of parameters is
A1B3C1. A confirmation experiment is
the final step of a design of
experiment. Its purpose is to verify that
the optimum conditions suggested by
the matrix experiment do indeed give
the projected improvement. The
confirmation experiment is performed
by conducting a test with optimal
settings of the factors and levels
previously evaluated. The predicted
value of multiple S/N ratio at optimum
level (η0) is calculated by formula 2.
j
( ) Σ=
η = η + η −
η 0 m i m
(2)
i
1
Where, j is the number of factors and
ηm is the mean value of multiple S/N
ratios in all experimental runs, ηi are
the multiple S/N ratios corresponding
to optimum factor levels (12, 30).
S/N ratio calculated for optimum level
as follow:
ηo=ηm+( ηA1-ηm) + (ηB3-ηm)+( ηC1-ηm)
(3)
ηo is optimum S/N ratio, ηm is the
overall mean of S/N values, ηA1 is the
average value of S/N at first level of
relaxation type, ηB3 is the average
value of S/N at the third level of yarn
type and ηC1 is the average value of
S/N at first level of loop length.
According to the formula 3, ηo was
found as -11.21 dB.
If the S/N is known and we want to
learn about the expected result that
will make the S/N. The procedure is to
back-transform S/N to find expected
performance value (8, 31).
When -11.21 dB value could be set
formula 1, obtained value is 3.63º.
Values of spirality angle of other
combinations will be expected with
same formula.
Also, knitted fabric was produced
according to the optimum design and
initial design. Spirality angle of these
fabrics was measured from five
different places of fabric. Average of
the results was determined as 4,20º for
optimum design (Table 7). This result
is very close to the result estimated by
Taguchi design (3,63º).
Initial design is accepted as A1B1C1
then S/N ratio is obtained according to
the initial and optimum design how
much profit is provided to find with
Taguchi design (Table 7).
Table 7 show that the improvement in
S/N ratio at the optimum level was
found to be 5,46 dB. The value of
spirality angle (º) at this optimum level
is 4,20 against the initial parameter
setting of 8,0. As a result, the
decrease in the value of spirality angle
can be obviously seen.
3.3. Prediction of spirality angle of
other conditions using Taguchi
design
According to the Taguchi design, it
was predicted the values of spirality
angle of knitted fabrics for seven
conditions (order) using formula 1 and
2. Predicted values were given with
their experimental results in Table 8.
Also, the values of percentage relative
error are evaluated, since software to
be used, shortening the numbers by
computer, personal mistakes are
considered.
As seen from Table 8, experimental
results and the predicted values are
much closed.
Table 7. Results of optimum and initial design
Optimum levels
Initial
Prediction Experimental
Design A1B1C1 A1B3C1 A1B3C1
Performance values (º) 8,0 3,63 4,20
S/N (dB) -18,07 -11,21 -12,61
Table 8. Comparison of experimental results with the predicted values from Taguchi design
Order A B C Experimental
(measured)
Predicted with Taguchi design
(calculated)
% Relative
error
1 2 2 1 8,22 9,12 10,90
2 1 2 3 19,62 18,26 6,93
3 2 3 2 6,00 6,21 3,50
4 2 1 3 18,11 20,18 11,4
5 2 2 2 13,00 13,80 6,15
6 3 3 1 5,10 4,61 9,61
7 3 1 2 14,67 15,20 3,60
378 TEKSTİL ve KONFEKSİYON 4/2011
6. 4. CONCLUSIONS
In this research, we intended to a
process for optimizing single jersey
fabric conditions using Taguchi design
to minimize the spirality angle of single
jersey fabrics. Firstly, important
affecting parameters for the spirality
angle of single jersey fabrics were
determined as relaxation type, yarn
type and loop length and an L9
orthogonal array was used in planning
the Taguchi experiments.
Based on the S/N ratio and ANOVA
analyses, yarn type and loop length
the most significant effect on fabric
spirality angles. Also, the optimum
levels of these parameters obtained in
this paper, which was A1B3C1; this
corresponds to relaxation type of dry
relaxation, yarn type of open end yarn,
loop length of 0,25 cm. In addition to
this, S/N ratio has been considerably
improved as compared to initial
parameter settings of the experiment.
Closeness of the results of the
predictions based on the calculated
S/N ratios and experimental values
show that Taguchi experimental
design technique can be used
successfully both optimization and
prediction.
As the loop length increases, spirality
angle increases. The reason for this
behavior can be explained by
concerning the chance of loops to turn
freely in loose fabric structure. Spirality
angle can also be increased by the
activity of fabric tending to reach
relaxation with washing process and
exchanges created by the wet
process. As already known, twist
direction in open end spinning is from
inward to outward, opposite of the ring
and compact spinning. So the amount
of twist is lower at the outer region with
respect to the inner region in open end
yarns. This means, the amount of
torque created in open end spinning is
lower with respect to ring and compact
spinning during the knitting process.
Because of these reasons, it is
predicted that the spirality angle of a
fabric knitted by open end yarns is
lower. Also lower values of twist
tendency created by yarn twist in open
end yarns support these results.
The main advantage of the Taguchi
parameter design, as opposed to the
classic factorial design methods, lies in
the introduction of noise factors in the
experimentation which provoke an
uncontrolled variation leading to a
noise insensitive response, therefore
to higher reproducibility. Taguchi
approach provides systematic, simple
and efficient methodology for the
optimization of the near optimum
design parameters with only a few
well-defined experimental sets and
determine the main factors to affect
the process. Taguchi design is an
important tool for robust design. It
offers a simple and systematic
approach to optimize design for
performance, quality and cost.
REFERENCES
1. Kurbak, A., and Kayacan, Ö., 2008, “Basic Studies for Modeling Complex Weft Knitted Fabric Structures Part II: A Geometrical Model for Plain Knitted
Fabric Spirality”, Textile Research Journal, Vol: 78(4), pp: 279-288.
2. Park, C.K., and Ha, J.Y., 2005, “A Process for Optimizing Sewing Conditions to Minimize Seam Pucker Using the Taguchi Method”, Textile Research
Journal, Vol: 75(3), pp: 245-252.
3. Singh, S., Shan, H.S., and Kumar, P., 2002, “Parametric Optimization of Magnetic-Field-Assisted Abrasive Flow Machining by the Taguchi Method”, Quality
and Reliability Engineering International, Vol: 18, pp: 273-283.
4. Taguchi G., Chowdhury, S., and Wu, Y., 2005, “Taguchi’s Quality Engineering Handbook”, John Wiley&Sons, Inc. ISBN 0-471-41334-8. p.1662.
5. Zeydan, M., 2008, “Modelling the Woven Fabric Strength Using Artificial Neural Network and Taguchi Methodologies”, International Journal of Clothing
Science and Technology, Vol:20(2), pp: 104-118.
6. Khosla, A., Kumar, S., and Aggarwal, K.K., 2006, “Identification of Strategy Parameters for Particle Swarm Optimizer Through Taguchi Method”, Journal of
Zhejiang University Science A, Vol: 7(12), pp: 1989-1994.
7. Introduction the Taguchi Method, http://www.ee.iitb.ac.in/~apte/CV_PRA_TAGUCHI_INTRO. htm., (The last visit date is November 2010).
8. Roy, R.K., 2001, Design of Experiments Using the Taguchi Approach, A Wiley-Interscience Publication, ISBN 0-471-36101-1.p.538.
9. Unal, R., and Dean, E.B., 1991, Taguchi Approach to Design Optimization for Quality and Cost: An Overview, http://nasa.gov/archieve/nasa/
casi.ntrs.nasa.gov/2004012019_2004117340.pdf (The last visit date is November 2010).
10. Raymond H. M., Andre I. K., and Geoffrey, V., 1992, “Response Surface Alternatives to the Taguchi Robust Parameter Design Approach”, The American
Statistician, Vol: 46(2), pp: 131-139.
11. Palanikumar, K., 2006, “Cutting Parameters Optimization for Surface Roughness in Machining of GFRP Composites Using Taguchi’s Method”, Journal of
Reinforced Plastics and Composites, Vol: 25(16), pp: 1739-1751.
12. Ross, P.J., 1996, “Taguchi Techniques for Quality Engineering”, Mcgraw-Hill International Editions, ISBN 0-07-114663-6. p.329.
13. Liasi, E., Du, R., Simon, D., Bujas-Dimitrejevic, J. and Liburdi, F., 1999, “An Experimental Study of Needle Heating in Sewing Heavy Materials Using
Infrared Radiometry”, International Journal of Clothing Science and Technology, Vol: 11(5), pp: 300–314.
14. Cheng, K.P.S., and Li, C.H.L., 2002, “JetRing Spinning and Its Influence on Yarn Hairiness”, Textile Research Journal, Vol: 72(12), pp: 1079-1087.
15. (a) Kumar, A., Ishtiaque, S.M., and Salhotra, K.R., 2006, “Analysis of Spinning Process Using the Taguchi Method. Part III: Effect of Spinning Process
Variables on Migration Parameters of Ring, Rotor and Air-jet Yarn”, Journal of the Textile Institute, Vol: 97(5), pp: 377-384.
(b) Kumar, A., Ishtiaque, S.M., and Salhotra, K.R., 2006, “Analysis of Spinning Process Using the Taguchi Method. Part IV: Effect of Spinning Process
Variables on Tensile Properties of Ring, Rotor and Air-jet Yarns”, Journal of the Textile Institute, Vol: 97(5), pp: 385-390.
(c) Kumar, A., Salhotra, K.R., Ishtiaque, S.M., 2006, “Analysis of Spinning Process Using the Taguchi Method. Part V: Effect of Spinning Process Variables
on Physical Properties of Ring, Rotor and Air-jet Yarns”, Journal of the Textile Institute, Vol: 97(6), pp: 463-473.
16. Salhotra, K.R., Ishtiaque, S.M., and Kumar, A., 2006, “Analysis of Spinning Process Using the Taguchi Method. Part I: Effect of Spinning Process Variables
on Fibre Orientation and Tenacities of Sliver and Roving”, Journal of the Textile Institute, Vol: 97(4), pp: 271-284.
17. Ishtiaque S.M., Salhotra, K.R., and Kumar, A., 2006, “Analysis of Spinning Process Using the Taguchi Method. Part II: Effect of Spinning Process Variables
on Fibre Extent and Fibre Overlap in Ring, Rotor and Air-jet Yarns”, Journal of the Textile Institute, Vol: 97(4), pp: 285-294.
18. Webb, C.J., Waters, G.T., Thomas, A.J., Liu, G.P., and Thomas, C., 2007, “The use of Taguchi Design of Experiment Method in Optimizing Splicing
Conditions for a Naylon 66 Yarn”, Journal of the Textile Institute, Vol: 98(4), pp: 327-336.
19. Onal, L., Zeydan, M., Korkmaz, M. and Meeran, S., 2009, “Predicting the Seam Strength of Notched Webbings for Parachute Assemblies Using the
Taguchi's Design of Experiment and Artificial Neural Networks”, Textile Research Journal, Vol: 79(5), pp: 468-478.
TEKSTİL ve KONFEKSİYON 4/2011 379
7. 20. Mavruz, S. and Oğulata, R.T., 2010, “Taguchi Approach for the Optimisation of the Bursting Strength of Knitted Fabrics”, Fibres & Textiles in Eastern
Europe, Vol:18 No.2 (79), pp: 78-83.
21. Mezarcıöz, S. and Oğulata, R.T., 2010, “Optimization of Bursting Strength of Single Jersey Fabrics with Taguchi Orthogonal Design”, Tekstil ve Konfeksiyon,
Vol: 20(4), pp: 320-328, (in Turkish).
22. Ogulata, R.T. and Mezarcioz, S., 2011,“Optimization of Air Permeability of Knitted Fabrics with the Taguchi Approach”, Journal of the Textile Institute, Vol:
102(5), pp: 395-404.
23. Tao, J., Dhingra, R.C., Chan, C.K., and Abbas, M.S., 1997, “Effects of Yarn and Fabric Construction on Spirality of Cotton Single Jersey Fabrics, Textile
Research Journal, Vol: 67(1), pp: 57-68.
24. Chen, Q.H., Au, K.F., Yuen, C.W.M., and Yeung, K.W., 2003, “Effects of Yarn and Knitting Parameters on the Spirality of Plain Knitted Wool Fabrics”, Textile
Research Journal, Vol: 73(5), pp: 421-426.
25. Çeken, F., and Kayacan, Ö., 2007, “The Effects of Some Machine Parameters on the Spirality in Single Jersey Fabrics”, Fibers and Polymers, Vol: 8(1), pp:
89-97.
26. Murrells, C.M., Xu, B.G., Cheng, K.P.S., and Tao, X.M., 2010, “Twist Liveliness Measurement and Its Application to Predict Fabric Spirality”,
www.elearning.lib.fcu.edu.tw. (The last visit date is November 2010).
27. Mezarcıöz S., and Oğulata R.T., 2009, “Investigation of Values of Spirality on Single Jersey Fabrics Knitted from Different Yarns”, Ç.Ü. Mühendislik-Mimarlık
Fakültesi Dergisi, Vol: 24(1-2), pp: 157-164, (in Turkish).
28. IWS Standard TM 276, 2000, Test Method for the Angle of Spirality (in Plain Knitted Garments).
29. Mel, M., Karim, M.I.A., Jamal, P., Salleh, M.R.M. and Zakaria, R.A., 2006, “The Influence of Process Parameters on Lactic Acid Fermentation in Laboratory
Scale Fermenter”, Journal of Applied Sciences, Vol: 6(10), pp: 2287-2291.
30. Dubey, A. K. and Yadava, V., 2007, “Simultaneous Optimization of Multiple Quality Characteristics in Laser Beam Cutting Using Taguchi Method”,
International Journal of Precision Engineering and Manufacturing, Vol: 8(4), pp: 10-15.
31. Savaşkan, M., 2003,Comparative Analysis of Design of Experiment Techniques on the Performance Evaluation and Optimization of Hard Ceramic Coated
Drill Bits, Phd Thesis. İstanbul Technical University, Inst. of Natural and Appl. Sci., (in Turkish), p.277.
380 TEKSTİL ve KONFEKSİYON 4/2011