Content Usability and Concept Learning in Technology Environments
1. Content Usability in Technology Supported
Learning Environments
Nivedita Singh
Rochester Institute of Technology
1 Lomb Memorial Drive
Rochester. NY- 14623
nxs313@rit.edu
ABSTRACT
Technology has not only erased the physical boundaries to
instructions and resources but has also introduced learners’ new
interactions, engagements, and expectations from the medium and
content. The instructions and material need our careful attention to
become usable and compatible with the changed learning styles
and preferences of the learners today. This paper presents the
results of an investigative study on conceptual learning in the
electronically delivered self-paced format. The study looked into
the aspects of content usability with respect to the amount of
information and its presentation. 25 participants were subjected to
five concepts each with a predefined amount of information and
presentation format. Our findings indicate that too much
information presents the case of information overload in concept
learning. At the same time, providing some learner control on
display of information and providing information in smaller units,
help cognitive processes involved in learning a concept. Though
the results of the study were not found statistically significant, the
trend indicated reduction in work overload and better performance
with learner-controlled progressive display.
Keywords
Content usability, eye tracking, pedagogy, conceptual learning.
1. INTRODUCTION
Technology has completely changed the way instructors and
learners look at the educational/instructional content, delivery,
and accessibility. As technology is taking the front face in
academia and corporate training environment, a lot of emphasis is
being placed on the usability of devices and interfaces for
educational use. Devices and software are being designed with the
latest user research to ensure ease of use, efficiency, and mobility.
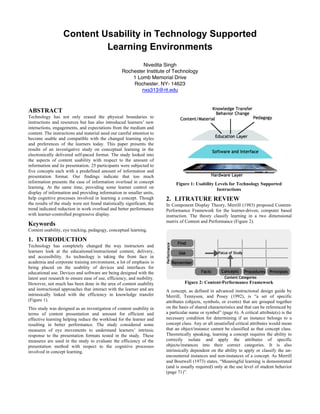
However, not much has been done in the area of content usability
and instructional approaches that interact with the learner and are
intrinsically linked with the efficiency in knowledge transfer
(Figure 1).
This study was designed as an investigation of content usability in
terms of content presentation and amount for efficient and
effective learning helping reduce the workload for the learner and
resulting in better performance. The study considered some
measures of eye movements to understand learners’ intrinsic
response to the presentation formats tested in the study. These
measures are used in the study to evaluate the efficiency of the
presentation method with respect to the cognitive processes
involved in concept learning.
Figure 1: Usability Levels for Technology Supported
Instructions
2. LITRATURE REVIEW
In Component Display Theory, Merrill (1983) proposed Content-
Performance Framework for the learner-driven, computer based
instruction. The theory classify learning in a two dimensional
matrix of Content and Performance (Figure 2).
Figure 2: Content-Performance Framework
A concept, as defined in advanced instructional design guide by
Merrill, Tennyson, and Posey (1992), is “a set of specific
attributes (objects, symbols, or events) that are grouped together
on the basis of shared characteristics and that can be referenced by
a particular name or symbol” (page 6). A critical attribute(s) is the
necessary condition for determining if an instance belongs to a
concept class. Any or all unsatisfied critical attributes would mean
that an object/instance cannot be classified as that concept class.
Theoretically speaking, learning a concept requires the ability to
correctly isolate and apply the attributes of specific
objects/instances into their correct categories. It is also
intrinsically dependent on the ability to apply or classify the un-
encountered instances and non-instances of a concept. As Merrill
and Boutwell (1973) states, “Meaningful learning is demonstrated
(and is usually required) only at the use level of student behavior
(page 71)”.
2. Taking the above interpretations, we focused on the effectiveness
of presentation and amount of information in learning Concept at
the Use level. We presented participants with concept definition,
listing the critical and necessary attributes of that concept in
textual, graphical, or mixed presentation formats and measured
their performance with respect to how well they could apply that
knowledge to new instances of the same concept.
Studies also suggest that a person’s attention is where his eyes are
looking (Christianson et al. 1991). Visual attention is considered
as a directed action by brain to prioritize and identify specific
areas of information that are conducive to fast and relevant
information processing. Studies have shown that in the field of
digital reading devices, people tend to pay more attention to the
areas that are highlighted (VonRestorff, 1933). Chi et.al (2007)
conducted an eye-tracking study to provide evidence of Von
Restorff isolation effect for highlighting interfaces. Their study
suggests that a reader’s attention is directed to the highlighted
areas, regardless of their appropriateness to the task. They found
that there is a direct correlation between different highlight
conditions (no highlighting, keyword highlighting, and sentence
highlighting) in the text and the user’s visual foraging behavior.
(Chi. Ed.H, Gumbrecht. M, and Hong .L, 2007). In early 1973,
Kanheman (Kanheman .D, 1973) suggested that eyes are
unconsciously directed to the areas that are more informative.
However, Kanheman’s theory needs to be seen within the context
of the task especially where the cognitive processes are involved.
As Generative Learning Theory (Wittrock MC, 1974) suggests,
learner actively seeks information to construct meaningful
understanding of information from the environment. This
becomes even more important in the technology supported
learning environment, where learner interacts with the
environment and content through the layer of technology. In this
case, the instructional material needs to take advantage of media
to support cognitive processes of the learner. Also, since
technology enables multiple modes of content presentation, it can
be used to deliver a lot of information in different formats.
However, this also raises the question if there is an optimal
amount of information that can facilitate efficient learning
process? How much highlighting/attention-focus is good or is
required for effective assimilation of information? In the light of
what multi-media can make possible, what are the presentation
strategies that might contribute most to cognition process? To
investigate the above-mentioned areas, this study focused around
how different learners make use of the presented visual stimuli to
learn a concept.
Based on the work of Mayer (2001), we predicted some
possibility of cognitive overload with over-use of certain
information and therefore also used eye-tracking measures such
as, fixation frequency and durations, revisits, and dwell time to
understand the aspects of visual processing and cognition
associated with the components (textual information, graphical
information, attention focusing) used in designing this study.
The questions that we tried to focus this study around were:
• What combination of text, graphics, and annotations is most
effective in learning to generalize the concepts?
• Does learner-controlled progressive presentation of
information has any affect on learning?
• How do learners behave with text and graphical informative
areas when assimilating the information required in learning
to generalize a concept?
• How does learner-controlled progressive presentation of
information change learner’s interaction with the content?
The objective of investigating these questions was to:
• Find if there is an optimal amount of information that works
best for cognitive processes involved in concept learning.
• Explore learner behavior with text and graphical information
and look at possible design implications based on this
behavior for effective instructional strategies in technology
supported learning environments.
3. METHODOLOGY
3.1 Test Material
The test material for this study was designed with the expository
approach as the primary presentation form and attention focusing
(using annotation) as the secondary presentation form. The learner
was introduced to a concept with a list of its critical
attributes/definition (generality) earlier in the sequence, followed
by its examples/non-examples (instances). As the secondary
presentation form, elaborations with varied degree of attention
focusing on graphics/illustrations such as arrows, circles, and
labels were used to guide learner through the critical attributes of
the concepts. The following components of content were used in
creating the primary and the secondary presentation forms for the
study:
• Textual Information (list of critical attributes for concepts)
• Supporting Graphic/Images
• Attention Focus (arrows, circles, and highlights) and Labels
on Graphics
Table 1 lists the concepts that were used in the testing. Table 2
provides the variations tested in this study.
Table 1: Concepts Used in Testing
Table 2: Treatment Variations for Presentation
Five sets of applications were created using Flash/AS3 each with
a different order of concepts and variations.
Note:
• Partial Annotations refers to attention focusing using arrows
and circles on the graphics.
• Complete Annotations refers to attention focusing using
arrows, circles, and labels on the graphics.
3. • Progressive disclosure refers to step-by-step display of
information on the screen with learner control on the pace of
the display.
• In all the variations the textual information was placed on the
left side of the screen and the images/illustrations with their
annotations were located on the right side of the same screen.
• The labels used on the graphics were considered as graphic
elements and not treated as textual information.
3.2 Treatment Design
A repeated measures design was used in which each participant
experienced all the five treatment variations and all five concepts.
To eliminate the influence of order of presentation, concepts and
their variations were counterbalanced into five sets with each set
presenting content in different order of concepts and variations.
Table 3 lists the five sets with the order of concepts (C1 to C5)
and variations (V1 to V5) used.
Table 3: Order of Concepts and Variation
Set 1 Set 2 Set 3 Set 4 Set 5
C1V1 C3V2 C5V3 C2V4 C4V5
C2V2 C4V3 C1V4 C3V5 C5V1
C3V3 C5V4 C2V5 C4V1 C1V2
C4V4 C1V5 C3V1 C5V2 C2V3
C5V5 C2V1 C4V2 C1V3 C3V4
Where, C = Concept and V=Variation
Twenty five participants were tested using one of the five sets in
the order of their participation in the study (Table 4). Therefore,
each set was tested with five participants.
Table 4: Order of Participants and Sets
3.3 Participants Profile
Twenty five participants were recruited from Rochester Institute
of Technology campus and Monroe Community College,
Rochester, NY. They were under-graduate and graduate students
from various majors and disciplines. Participants were screened
for specific characteristics (Table 5) to ensure they met the
following requirements.
Table 5: Participant Profiles
Generic Characteristics
Age -18 to 35 years
Education -High school minimum
Relevant Characteristics
Computer Use -Moderate to high proficiency
Proficiency in English -Intermediate to advance
proficiency
Experience with
eLearning
-Little or no experience
Professional experience
as a bank teller, wine
maker, courier service
-None
Of the 25 participants, 17 were males and 8 were female students.
17 participants were graduate students and the remaining 8 were
undergraduate students.
12 of 25 (48%) participants did not have any prior experience
with eLearning, 10 of 25 participants (40%) participants had
moderate experience with eLearning, and 3 of 25 (12%) had good
experience with eLearning
3.4 Material Equipment and Environment
The SMI Remote Eye-tracking Device (RED) System (iViewX
and Experiment Center) was used to run the study and collect eye-
tracking data. Participants interacted with the application on a
separate 17” TFT monitor. Resolution of the monitor was set to
standard 1280 x 1024 pixels. The tracker was set at the frame rate
of 250 Hz with filter depth of 80ms, and saccade length of 20
pixel. Participants sat at a distance of approximately 65 cm – 70
cm from the display monitor that provided the stimulus.
3.5 Procedure
No practice material was provided to warm up the participants.
The general instructions about the application were given at the
beginning of the session and specific instructions and directions
(if required) were provided on the relevant screen. Participants not
timed for completing the session. However, they were not given
the control to skip any of the questions. Each participant was
subjected to a 5-point calibration for RED at 250 Hz sample rate,
filter depth of 80 ms, and saccade length of 20 pixels. All the
subjects were calibrated on the SMI eye tracker system with a
gray background. Calibration was succeeded by additional
validation procedure to ensure authenticity to the calibration.
Against the accepted calibration error of 0.5, the average
calibration error for the 25 participants in this study came out to
be 0.6 with standard deviation of 0.33 and 0.28 for X and Y
values respectively.
3.6 Data Collection
Data for the 25 experiments was collected at three levels:
1. Performance Data: measure of efficiency in learning
concepts with respect to the presentation variations. Each
concept was followed by four questions and each question
weighted 1 point for the correct answer. Therefore, each
participant went through 20 questions in all with maximum 4
points for each concept. This data was captured using Action
Script 3 on Flash CS5 application.
2. Eye-tracking Data: measure of learner behavior with
presentation variations. The eye-tracking data for each
participant was collected using the SMI-Experiment Center
3.2.
3. Qualitative Data: measure of preferences, opinions, and
perceptions. This data was collected using background
questions and post-session questionnaire.
4. DATA ANALYSIS AND RESULTS
Our first research question was concerned with the
combination of text, graphics, and annotations (attention
focus and labels) that is most effective in learning to generalize
concepts.
4. Participants’ score data indicated that participants performed best
in V2; V4 on the other hand, resulted in worst performance. The
data was subjected to Moods Median Test.
The results of Moods Median test indicate that participants did not
perform particularly better or worse in any of the combinations of
text, graphics, and annotations (attention focus and label). And,
therefore we cannot say that there was a combination that
contributed best to learn generalizing concepts.
Although the scores are not statistically significant, boxplot
(Figure 3) reveals that the average scores were best in variation
V2 and least in V4. It also indicates that between the tested
variations, V4 has the highest variation in scores. This result
presented an opportunity to look at these variations more closely
in relation with learner behavior and is discussed later in this
document.
Figure 3: Box Plot of Scores Data for V1 to V4
Does learner-controlled progressive presentation of
information has any affect on learning?
Participants score data (Figure 4) for Variations 4 and 5 was
analyzed. Variations V4 and V5 presented an interesting case
where both these variations presented most complete information
using text and graphics with complete annotations (attention focus
and labeling). However, in contrast to upfront display of complete
information in V4, V5 presented information progressively with
learner’s control on the pace of display.
Figure 4: Performance Scores for V4 and V5
Figure 5: Box Plot of Scores Data for V1 to V4
Moods Median test was applied on the scores for V4 and V5 to
test if there was any significant difference between them.
Although, we found P-value not indicative of any significant
difference between the scores for V4 and V5, but it is very close
to 0.05 and suggests that there might be a possibility that
progressive presentation with learner control on pace in V5 have
some influence on the better performance in V5 in comparison to
V4. Boxplots (Figure 5) also reveal that both mean and median
scores in V5 are higher than in V4. Also, the variation in scores
for V5 is much less than in V4, indicating more consistent
performance by participants in V5.
Our next point of interest was how learners behave with text
and graphical informative areas when assimilating the
information required in learning to generalize a concept.
To explore learner’s behavior with text and graphics areas, the
content screens were divided into two Areas of Interest (AOI):
text area and graphics area.
Sequence Analysis: area that attracts learner’s attention first.
Figure 7 shows the sequence of visiting text AOI and graphic
AOIs as participants entered the screen on each of the variations.
Figure 7: Sequence Analysis for V2, V3, and V4
The sequence data for the variations V2, V3, and V4 show that
most participants went to look at the graphic AOI first as they
Mood Median Test: Scores vs Variations (V1 to V4)
Mood median test for Scores for V1 to V4
Chi-Square = 3.13 DF = 3 P = 0.373
Individual 95.0% CIs
C2 N<= N> Median Q3-Q1 +---------+---------+---------+------
V1 18 7 3.00 1.00 *
V2 13 12 3.00 1.00 *--------------------------------)
V3 15 10 3.00 2.00 *--------------------------------)
V4 18 7 3.00 2.00 *
+---------+---------+---------+------
3.00 3.30 3.60 3.90
Overall median = 3.00
V4V3V2V1
4
3
2
1
0
Variations
Scores
3
3.32
3.12
2.84
Boxplot of Scores Across Variations V1 to V4
V5V4
90
80
70
60
50
40
30
20
10
0
Variations
Scores
81
71
Performance Scores for V4 and V5
V5V4
4
3
2
1
0
Variations
Scores
4
3
3.24
2.84
Boxplot of Scores in Variations V4 and V5
Where, Red=Mean and Green = Median
Mood Median Test: Scores versus Variation for (V4 and V5)
Mood median test for Scores (V4 and V5)
Chi-Square = 3.00 DF = 1 P = 0.083
Individual 95.0% CIs
Variation N<= N> Median Q3-Q1 +---------+---------+---------+------
V4 18 7 3.00 2.00 *
V5 12 13 4.00 1.00 (--------------------------------*
+---------+---------+---------+------
3.00 3.30 3.60 3.90
Overall median = 3.00
A 95.0% CI for median(V4) - median(V5): (-1.00,0.00)
V2 V3 V4
Text 9 5 6
Grapphics 16 20 19
36%
20%
24%
64%
80%
76%
0
5
10
15
20
25
Number of Participants
First View (Sequence) Trend for V2, V3, V4
5. entered the treatment screen. In variation V2, a relatively higher
number of people looked at the text AOI first. Variation V2 had
textual information displayed on the left with a simple graphic
with no annotations on it on the right of the screen. This suggests
a possibility that more people tend to look at the graphic first
when graphics are accompanied with some annotations on them.
Dwell Time: time learners spend on each of these areas.
Total dwell time data (Figure 8) indicates that participants spent
more time on text than on graphics across all variations.
Figure 8: Total Dwell Time for Text and Graphic AOIs in V1,
V2, V3, V4
Moods Median test for text AOIs for V1, V2, V3, and V4 did not
show any significant difference. However, Moods Median test on
the Dwell Time for graphic AOIs in V2, V3, and V4 gave P-value
of 0.000 indicating a significant difference in the total dwell time
for graphics between V2, V3, and V4.
The total dwell time for text AOI remained consistently greater
than the total dwell time for graphics AOI across variations V2,
V3, and V4. In case of graphic AOI, the total dwell time data for
the graphic AOI in variations V2, V3, and V4 was found to be
significantly different from each other. The results clearly indicate
higher median dwell time in graphic AOI for V4. Higher total
dwell time is considered an indicative measure of more
cognitively demanding activity. As we see in case of V4 there is a
sharp increase in the dwell time on graphic AOI, which might be a
result of more cognitive demand in the graphic AOI in V4. As
explained earlier, V4 presented graphical information in most
complete form with attention focus and labels. This presents a
possible case of information overload in V4.
Revisits: how many times do learners need to revisit text and
graphic areas to assimilate information. Revisit is defined as the
count of visits (or glances) on an AOI.
Figure 9: Revisits Count V1 to V4
The bar chart (Figure 9) indicates that number of revisits in
graphics AOI in V2, V3, and V4 increases as the amount of
information on the graphics (attention focus and labels) increase
from V1 to V4. However, Moods Median tests for text and
graphics AOIs did not find any significant difference in revisit
counts between V1 to V4. Revisits to the text AOI do not show a
lot of variation, however graphics AOI show increasing revisit
counts from V2 to V4. In case of V4, graphic AOIs get slightly
higher number of revisits as the text AOI. This again suggests the
possibility that the amount of information in V4 is probably not
helping to ease out the cognitive workload.
The final question in this study was concerned with the effect
of learner-controlled progressive presentation of information
on the learner’s interaction with the content.
We found that the variation that had most complete information
(V4) did not result in better performance. The performance results
indicated a possibility that participants did better in V5 (learner
controlled progressive display of content) than in V4. To measure
the change in learner behavior between V4 and V5 we compared
time on task and fixation durations and frequency between
variations V4 and V5.
Time on task: how much time did participants spent on content
for variation V4 and V5 (time on task)
Since the amount of information in V4 and V5 was same, the time
that participants spent on treatment screen (time on task) was an
important indicator of learner behavior with these two variations.
The time data that each participant spent on V4 and V5 was
extracted from the time coded video recorded by SMI –
Experiment Center. We considered only the time a participant
entered the treatment screen to the time she clicked Next button to
go to the next screen was recorded for the purpose of this analysis.
It did not include the time spent on examples screens and test
questions screens.
Figure 10: Average Time on Task (in ms) for V4 and V5
V1 V2 V3 V4
Text 514335 435475 516366 444064
Graphics 137301 198623 366062
0
100000
200000
300000
400000
500000
600000
Dwell Time (ms)
Dwell Time for V1, V2, V3, V4
Results for: DwellTimeGraphics_MoodsMedian (V2 to V4)
Mood Median Test: Dwell Time versus Variations for graphics AOI (V2 to V4)
Mood median test for Dwell Time
Chi-Square = 18.35 DF = 2 P = 0.000
Individual 95.0% CIs
Variation N<= N> Median Q3-Q1 ---+---------+---------+---------+---
V2 18 7 3595 6021 (--*-------)
V3 16 9 5999 5843 (------*----)
V4 4 21 14381 5743 (--------*-)
---+---------+---------+---------+---
3500 7000 10500 14000
Overall median = 6774
V1 V2 V3 V4
Text 224 196 206 213
Graphic 110 161 257
0
50
100
150
200
250
300
Revisits Counts
Revisits Count for V1 to V4
V4 V5
Avrage time 48663.08 46799.16
45500
46000
46500
47000
47500
48000
48500
49000
Time (ms)
Average Time on Content
6. However, the results of ANOVA did not indicate any conclusive
evidence of statistical difference in the time spent on the task in
V4 and V5. Therefore, we can say that the time that participants
spent on information for V4 and V5 was approximately the same,
and giving control of pace to the learner did neither increase or
decrese the overall time they needed to process information.
Fixation duration and fixation frequency: how frequently and
for how long did participants had to fixate on the content for
variations V4 and V5 (fixation duration and frequency).
Performance results indicated that participants scored better in V5
than in V4. Since the information in variations V4 and V5 was
equal, and we also know that the overall time on task for V4 and
V5 was the same, our next point of interest was to understand if
the control of pace (in V5) had any change in how learner
assimilated the information. To understand the cognitive activity
with these two variations, we analyzed fixation counts and
fixations durations of the participants on variations V4 and V5.
For the purpose of this analysis, we considered fixations that were
between 100 ms and 600 ms. Fixations below 100 ms and greater
than 600 ms were eliminated as noise.
The bar chart for Fixation Counts between V4 and V5 (Figure 11)
shows that participants had more number of fixations in V5 than
in V4.
Figure 11: Number of Fixations between V4 and V5
On the other hand, the average duration of fixation (Figure 12)
was lesser in V5 than in V4. Therefore, it looks like participants
had more number of shorter fixations in V5 when compared to
V4.
Figure 12: Average Fixation Durations between V4 and V5
One-way ANOVA with Tukey test on the fixation durations for
V4 and V5 indicated a strong difference between the fixation
durations for V4 and V5. V5 received more number of fixations of
shorter durations versus lesser number of fixations of longer
durations in V4. Research show that longer fixations reflect more
cognitive processing (Sweller et all, 2011, pg 81). In this case
reduced durations of fixations in V5 suggest possible decrease in
the cognitive load when presented with more information in
smaller units and with learner controlled pace.
5. DISCUSSION
The research questions for this study were mainly concerned with
the effectiveness of combination of text, graphic, and annotations
and learner behavior with them. We expected to find clear
indications of the effectiveness in variations of text, graphics, and
annotations in concept learning. However, results were not
statistically conclusive to support that any of the tested
combinations resulted in better learning and performance.
Although not proven statistically, we found evidence of the case
where too less (V1) and too much information (V4) did not work
well for participants’ performance. The most interesting case was
found between V2 and V4 where, V2 presented textual
information with no annotations on graphic and V4 with textual
information with heavily annotated graphic. Looking at the
analysis for these two variations comprehensively (Figure 13), we
see that participants scored comparatively well in V2 (mean score
One-way ANOVA: Time on Content in V4 and V5
Source DF SS MS F P
C1 1 43427472 43427472 0.10 0.751
Error 48 20443373693 425903619
Total 49 20486801165
S = 20637 R-Sq = 0.21% R-Sq(adj) = 0.00%
Individual 95% CIs For Mean Based on
Pooled StDev
Level N Mean StDev ---+---------+---------+---------+------
V4 25 48663 22925 (---------------*----------------)
V5 25 46799 18062 (----------------*---------------)
---+---------+---------+---------+------
40000 45000 50000 55000
Pooled StDev = 20637
V4 V5
Number of
Fixations
2894 2988
Number of
Fixations
Number of Fixations
between V4 and V5
V4 V5
Avg Fixation
duration
223.24 217.8
Fixation durations
(ms)
Average Fixation
Durations for V4 and
V5
One-way ANOVA: Average Fixation Durations in V4 and V5
Source DF SS MS F P
C1 1 43531 43531 4.12 0.042
Error 5880 62129404 10566
Total 5881 62172935
S = 102.8 R-Sq = 0.07% R-Sq(adj) = 0.05%
Individual 95% CIs For Mean Based on
Pooled StDev
Level N Mean StDev --------+---------+---------+---------+-
V4 2894 223.2 100.9 (----------*----------)
V5 2988 217.8 104.6 (---------*----------)
--------+---------+---------+---------+-
217.0 220.5 224.0 227.5
Pooled StDev = 102.8
Grouping Information Using Tukey Method
C1 N Mean Grouping
V4 2894 223.2 A
V5 2988 217.8 B
Means that do not share a letter are significantly different.
Tukey 95% Simultaneous Confidence Intervals
All Pairwise Comparisons among Levels of C1
Individual confidence level = 95.00%
C1 = V4 subtracted from:
C1 Lower Center Upper -------+---------+---------+---------+--
V5 -10.7 -5.4 -0.2 (------------*-------------)
-------+---------+---------+---------+--
-8.0 -4.0 0.0 4.0
7. 3.82) than in V4 (mean score 2.84). We also recorded lower dwell
time and revisit counts in V2, which is indicative that participants
experienced lower cognitive workload in V2 in comparison to V4.
Yet, self-reported preference by participants indicated only 4% (1
of 25) participants preferred this variation. Clark (1982) in his
study found evidences of negative correlation between the learner
achievement and what they feel they prefer as an instructional
method/material. In this study we see a similar trend where
learners did not enjoy the presentation format in which they
performed the best.
Figure 13: Comparative Analysis between V2 and V4
On the effect of learner-controlled progressive presentation on
learning a concept, statistical analysis for this variable was found
very close to significance (p-value = 0.083). The mind-eye theory
suggests, the eye remain fixated on an area while the information
is being actively processed (Just and Carpenter, 1980). Therefore,
fixation duration corresponds to the amount of cognitive
processing needed for a piece of information. In this case, we
found the fixation durations in V4 were significantly higher than
the fixation duration in V5, which presented the same information
in smaller units and progressive steps. The results indicate that
when content is too heavy with textual and graphical information,
providing some amount of learner control on the information
display might help learner to assimilate information better.
Additionally, we also found that providing more information on
graphics may not necessarily be helpful in learning concepts. The
results indicated that graphics with more information or
annotations (attention focus and labels) was possibly causing
increased workload for learners and required more revisits and
time to create the mental model of the concept. This is an
interesting finding and needs to be explored further with a more
robust experimental design.
We also saw some interesting learner behavior with the text and
graphic information. The study used eye-tracking measures of
revisit and dwell time on text and graphic areas of content. The
results of these analyses were statistically non-conclusive.
However, we detected a possible pattern in the attention gained by
graphics. We found that while presence of graphics may not
necessarily reduce attention on text or even alter the order of
processing information between text and graphic, most learners
are inclined to look at graphics before the text when presented
with a screen that has both. This finding inclines with the
Mackworth & Morandi’s theory (1967) that human eye is most
likely to be drawn to the perceived informative areas within first
few second of viewing. This finding needs to be further studied
with more detailed experiments to investigate if it also alters or
impacts the order of processing information in the learning
environments.
The qualitative analysis pointed to some other related factors that
influence the effectiveness of eLearning.82% of the participants
who reported that they did not find eLearning to be as effective as
the classroom learning based their opinion on two major factors:
interactions and motivation. Participants reported that they found
eLearning courses to be just content on the screen on which they
have no control, lacks agility of face-to-face interactions, do not
support active discussions, and provides no engagement with the
content. There were also contrasting opinions about the flexibility
offered by eLearning environments. Some participants felt that
too much flexibility in terms of pace and performance in
eLearning environment results in lack of motivation. Classroom
environment creates a pressure to stay attentive in class, peer
competition, and need to actively engage with the content in
classroom and therefore helps them to stay focused and motivated.
On the other hand, participants who reported that they find
eLearning to be as effective as classroom learning based their
opinions on the flexibility of time and content that is offered by
eLearning. They also reported video and audio components being
helpful in the learning process.
Looking at the findings of this study comprehensively, the
observations indicate a clear need for more research and efforts to
understand usability aspects and learner expectations with the
instructional material in technology-supported learning
environments. We also need to look at the design solutions to
minimize cognitive workload associated with higher order
learning.
Following section lists some learning from this study that should
be considered and further investigated to make better learner
experiences and more usable learning systems.
5.1 Possible Recommendations for Design
Based on our learning from this study, we suggest the following
considerations that might help in designing better technology-
supported learning environments:
• Results of this study points to the theory of learner control as
a way to improve learner performance and satisfaction with
the learning material. It is evident that providing some sort of
controlled display of information unclutters the screen and
helps learner not to feel overwhelmed by the amount of
information although he is still going through the same
amount.
• Gradual and step-by-step presentation of attributes helps
learner to create better attribute associations and mental
models of the concepts. As Cooper (1998) suggests
presenting smaller chunks of elements helps facilitate
cognitive processes associated with learning and
remembering.
• When presented with text, annotated graphics demand more
cognitive effort and thus content needs a balance between
textual and graphical information to minimize the load and
still attain efficiency in processing information.
• Content and interactions keep learners motivated and
engaged. These two elements must be designed with care.
Features like annotatable areas, interactions with peers and
instructors can help learner engage better with content and
environment. While navigational elements need to be clearly
available, they must not compete with the interactive
elements of the content.
8. 5.2 Limitations of the Study
The study suffered from some design flaws that contributed to the
inconclusive results.
1. Variations were too many and the differences were too
subtle. The study would have provided better data if there
were fewer variations with more apparent differences in the
presentation of content.
2. The concepts that were chosen for the study were generic and
although care was taken while recruiting the participants to
negate the possibility of pre-knowledge, the concepts were
probably too easy and could not bring out the real difference
in learning. As an improvement for the future studies, the
researcher recommends using stronger concepts.
3. Each concept was followed by examples before subjects took
the questions. The examples helped participants to retain
already easy concepts. As an improvement, the examples
should be removed from the stimulus.
4. Time limitation allowed only four questions per concept.
Having more questions and more participants would help
getting a more robust and normal data for performance
analysis.
5. A more careful screen design with clearly separated text,
graphic, and navigational areas would be helpful to avoid
noise data in areas of interest.
6. The treatment of the content was somewhat predictable in the
study. The placement and treatment of text, graphics, and
annotations was kept the same for all concepts and, although
the order of variations and concepts was changed for each
participant, participants were probably conditioned after the
second concept to expect similar treatment for other
concepts.
5.2.1.1 Noise Data
1. A lot of noise data (long fixations) was recorded by the eye
tracker. This noise was caused by interface elements and
other than the content or the Areas of Interest (AOIs). This
included the Next button located at the bottom right corner of
the screen. Especially, for variations V3, V4, and V5 this
button was too close to the graphic AOI and probably caught
a lot of attention. The fixations on the button were eliminated
from the data.
2. The AOIs on the screen were very closely placed and
considering calibration error, a lot of noise data was
generated due to the overlap near the boundaries of AOIs.
3. Some noise data also resulted from participants asking
questions while not taking their eyes off from the screen. The
questions were like “how long is the session”, “how many
sections are there?”, “can I go back to the previous page?”,
and so on. This data was eliminated from the study by
considering fixations only between 100 ms – 600 ms.
4. Some participants were extra attentive to the content on the
screen since they were aware that they were being eye
tracked and that they will be answering the questions. This
was not a normal behavior in natural learning environment
and resulted in long fixations.
6. CONCLUSION
Although the results of this study did not show strong conclusive
trends or patterns in learner behavior, it did bring out some rather
interesting aspects in content usability, perceptual processing, and
learner behavior that can be explored and researched further with
more directed and robust studies. There is a clear need for
designing better eLearning environments that are conducive to
learning and provide better learner experience with content and
interactions. We cannot change the intrinsic load that is inherent
to the subject or content but with better understanding of learner
behavior with electronically delivered content, we can reduce the
extraneous load that is associated with the design aspects of
content, modality, and delivery. More research is required in
learner behavior with electronically delivered content and its
usability for technology to be able to support effective learning
environments.
7. REFERENCES
[1] Bannert, M. (2002).Managing cognitive load – recent trends
in cognitive load theory.Learning and Instruction. Retrieved
May 21, 2013, from
http://sites.huji.ac.il/science/stc/thj/articles_tj/articles_english
/Learning%20and%20Instruction%2012_1%20%282002%29
/Managing%20cognitive%20load%97recent%20trends%20in
.pdf.
[2] Bonk, C. J. 2004. The perfect e-storm: Emerging
technologies, enhanced pedagogy, enormous learner demand,
and erased budgets. Retrieved May 11, 2013, from
http://www.publicationshare.com/part1.pdf.
[3] Chi, Ed. H., Michelle, G., & Hong, L. 2007. Visual Foraging
of Highlighted Text: An Eye-Tracking Study. Retrieved Nov
27, 2011, from http://www-
users.cs.umn.edu/~echi/papers/2007-HCII/2007-Chi-Visual-
Foraging-Highlighting-Eyetracking.pdf.
[4] Christianson, S. A., Loftus, E. F., Hoffman, &Lofius, G. R.
1991.Eye Fixations and Memory for Emotional Events.
Retrieved Nov 22, 2011, from
http://faculty.washington.edu/gloftus/Downloads/Christianso
nLoftus.pdf.
[5] Christianson, S. A., Loftus, E. F., Hoffman, &Lofius, G. R.
1991.Eye Fixations and Memory for Emotional Events.
Retrieved Nov 22, 2011, from
http://faculty.washington.edu/gloftus/Downloads/Christianso
nLoftus.pdf
[6] Clark, R. E. (1982) Antagonism Between Achievement and
Enjoyment in ATI Studies Educational Psychologist, 17 (2).
[7] Cooper, G., 1998. Research into Cognitive Load Theory and
Instructional Design at UNSW. Sydney, Australia. Retrieved
on June 10th, 2013, from
http://webmedia.unmc.edu/leis/birk/CooperCogLoad.pdf.
[8] Jacob, R. J., &Karn, K. S. 2003. Eye-tracking in human-
computer interaction and usability research: Ready to deliver
the promises. The Mind's eye: Cognitive The Mind's Eye:
Cognitive and Applied Aspects of Eye Movement Research,
573 - 603.
[9] Just, M. A., & Carpenter, P.A., (1980). A Theory of Reading:
From Eye Fixation to Comprehension. Retrieved on June 8th,
2013, from
http://works.bepress.com/cgi/viewcontent.cgi?article=1105&
context=marcel_just_cmu.
[10] Kahneman, D. 1973. Attention and Effort, Englewood,
Cliffs, N.J.: Prentice Hall. Retrieved Nov 22, 2011, from
http://www.princeton.edu/~kahneman/docs/attention_and_eff
ort/Attention_lo_quality.pdf
[11] Kopcha, T.J., Sullivan, H.(2008). Learner preferences and
prior knowledge in learner-controlled computer-based
9. instruction.Education Tech Research Design. Retrieved May
21, 2013, from
http://link.springer.com.ezproxy.rit.edu/content/pdf/10.1007
%2Fs11423-007-9058-1.pdf
[12] Mackworth, N.H. &Morandi, A.J. (1967). The gaze selects
information details within pictures. Perception and
Psychophysics, 2(11), 547-551.
[13] Mayer, R.E., Hegarty, M., Mayer, S.,& Campbell, J., (2005).
When Static Media Promote Active Learning: Annotated
Illustrations Versus Narrated Animations in Multimedia
Instruction. Retrieved May 21, 2013, from
http://www.anitacrawley.net/Articles/When%20Static%20M
edia%20Promote%20Active%20Learning%20Annotated%20
Illustrations.pdf
[14] Mayer, R. (2010). Unique contributions of eye-tracking
research to the study of learning with graphics. Learning and
Instruction, 20(2), 167.
[15] Mayer, R. E., & Massa, L. J. (2003). Three facets of visual
and verbal learners: Cognitive ability, cognitive style, and
learning preference. Journalof Educational Psychology, 95,
833-846. Retrieved May 21, 2013, from
http://www.unco.edu/cetl/sir/sizing_up/documents/Mayer_Vi
sualVerbal.pdf
[16] Merrill, M.D. 1983. Component Display Theory. Retrieved
Dec 05, 2011. Retrieved
fromhttp://kuedtech2.pbworks.com/f/Merrill.pdf
[17] Merrill, M. D., &Boutwell, R. C. 1973. Instructional
Development Methodology and Research, in F. N. Kerlinger
(ed.), Review of Research in Education. Itasca, II1.: Peacock
Publishers.
[18] Merrill, M. D., Tennyson, R. D., & Posey, L. O. (1992).
Teaching Concepts: An Instructional Design Guide (Second
ed.). Englewood Cliffs, NJ: Educational Technology
Publications.
[19] Merrill, M. D., & Wood, N. D. 1975a. Instructional
strategies: A preliminary taxonomy, Technical Report Series,
No. 1R. Orem, Utah: Courseware, Inc.
[20] Nokelainen, P. (2006). An empirical assessment of
pedagogical usability criteria for digital learning material
with elementary school students. Educational Technology &
Society, 9 (2), 178-197. Retrieved from
http://www.ifets.info/journals/9_2/15.pdf on June 4th, 2013.
[21] Pei-Chen, S., Ray, J. T., Glenn, F., Yueh-Yang, C.,
Dowming, Y. (2008). What drives a successful eLearning?
An empirical investigation of the critical factors influencing
learner satisfaction, Computers & Education, Volume 50,
Issue 4, May 2008, Pages 1183-1202, ISSN 0360-1315,
10.1016/j.compedu.2006.11.007.
[22] Sweller, J., Ayres, P., Kalyuga, S. (2011). Cognitive Load
Theory. Springer, ISBN 978-1-4419-8125-7, DOI
10.1007/978-1-4419-8126-4
[23] (http://www.sciencedirect.com/science/article/pii/S03601315
06001874)
[24] Van Gog, T., Ericsson, K. A., Rikers, R. M. J. P., &Paas, F.
(2005). Instructional design for advanced learners:
Establishing connections between the theoretical frameworks
of cognitive load and deliberate practice. Educational
Technology Research and Design. Retrieved May 21, 2013,
http://link.springer.com.ezproxy.rit.edu/content/pdf/10.1007
%2FBF02504799.pdf
[25] Von, R. H. 1933.Uber dieWirkung von Bereichsbildungenim
Spurenfeld (The effects of field formation in the trace
field).PsychologieForschung 18, 299–334
[26] Wittrock, M.C. 1974. Learning as a Generative Process.
Educational Psychologists 11(2), 87-95. Retrieved Jan
11,2012, from RIT library
http://content.epnet.com.ezproxy.rit.edu/pdf23_24/pdf/2010/
EPY/01Jan10/49152722.pdf?T=P&P=AN&K=49152722&E
bscoContent=dGJyMNHX8kSep7A4y9f3OLCmr0qep7FSsq
24SbCWxWXS&ContentCustomer=dGJyMPGutlC1r7dNue
Pfgeyx%2BEu3q64A&D=afh
[27] Yarbus, A.L. (1967). Eye Movements and Vision (B. Haigh,
Trans.). New York: Plenm Press. (Original work published in
1956).