
Recommended
More Related Content
What's hot
What's hot (19)
Similar to Melbourne East West Corridor Trajectory Descent
Similar to Melbourne East West Corridor Trajectory Descent (20)
Recently uploaded
Recently uploaded (20)
Melbourne East West Corridor Trajectory Descent
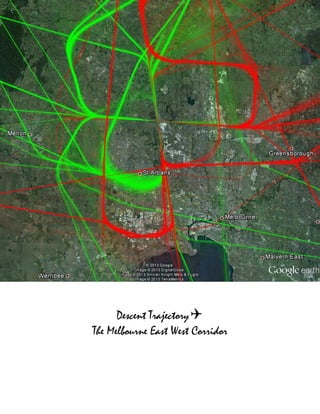
- 1. Descent Trajectory✈ The Melbourne East West Corridor
- 2. Optimal flight descent ✈ | 2 Abstract This paper discourses the descent trajectory in the Melbourne East West Corridor, in the aspect of fuel efficiency for carbon savings. Three top of descent approaches put down the foundation for the research: The Reduced Vertical Separation Minimum, Free Route Experimental Encounter Resolution, and the Continuous Descent Approach that is practiced within the Melbourne airspace. Using a theoretical construct of fuel fraction during loiter, outline of approach and landing the derivative of fuel burn and correlated emissions can be defined. A single aircraft type of the Australian flag bearer, Quantas Airways Limited is to be selected, in a sample size to be determined on the volume of available information. On the overall, this research is typical a case study in a framework of comparative analysis using a single equation. At the given congestion of Melbourne Airport year-on-year 200,000 aircraft movements for 29 million passengers; the outcome of this research is expected to show positive results in fuel efficiency for carbon savings. Ease of approach and reduced time to land are thought to be the substantive variables due the Melbourne East West Corridor.
- 3. Optimal flight descent ✈ | 3 Introduction The Melbourne Airport has preconditioned flight paths defined by the seasons of winds that dominant in summer in a south to south west direction and a north to northwest direction over the winter. A green wedge corridor seats to the north and west, well away the urban region (Melbourne Airiport, 2019). Flight paths depart to the north to northwest and approach the terminal from the east and southeast, overhead the suburban region, with alignment notices at least ten kilometres out and observing a glide slope of three degrees. To ease congestion over the peak hours LT/O delays, Melbourne Airport is to take up landing approaches from west on the east-west Runway 09, and lift off to the south off Runway 16. Crafted as closely as possible to the original, these flight paths are to operate in tandem the rest. Figure 1 Arrival path corridors for Runway 09 (Air Services 2019)
- 4. Optimal flight descent ✈ | 4 Research Statement This research discourses The Melbourne East West Corridor in the aspect of descent trajectory for boosting fuel efficiency for carbon savings, posturing safety to be succeeded by flight performance improvement. Flight descent is executed in a combination of speed and altitude, where the aircraft manoeuvre enables a stable approach from an altitude above ground 3000 feet for the ILS Melbourne Airport: To be able to land safe. Landing an aircraft depletes an immense amount of fuel consequential its respective descent trajectory and existing environment conditions (NATS 2009). Taking aside any other variable such as fatigue and pilot fault, or ATCO interaction and terminal procedure; a top of descent manoeuvre relative to wind forecast accuracy, marks down the direct impact on fuel burn and carbon savings (Bronsvoort et al 2011). To be clear, the descent trajectory to be studied begins from the top of descent, loiter, and landing. As such, fuel efficiency connotes a fraction of the fuel consumption in flight. Research analysis confines to a single type of aircraft of the Australian flag bearer, Quantas; using a sample size of flights relative to the data made available. The Research question Does The Melbourne East West Corridor infer an optimal flight path for fuel efficiency and carbon savings? Literature Review Attitudes to incur fuel efficiency and carbon savings begin with a stable approach, otherwise the descent trajectory. An approach subscribes to varying techniques practiced within the specific airspace as applicable. Those that boost fuel efficiency for carbon savings are: Reduced Vertical Separation Minimum, Free Route Experimental Encounter Resolution, and the Continuous Descent Approach.
- 5. Optimal flight descent ✈ | 5 Reduced Vertical Separation Minimum The concept of Reduced Vertical Separation Minimum, otherwise RVSM was initially employed in the North Atlantic in 1997, and later on practiced across Europe. The RVSM technique using a minimum separation of 1000 feet, permits the aircraft on a flight path of preferred altitude to raise airspace utilisation efficiency as prescribed by ICAO, because it enables tighter approaches thus reduces distance flown (Hansman, 2010). On an RVSM flight, descent trajectory can begin at 10,000 feet with sink rate of 900 miles per minute. For congested airspaces adjacent terminals, the synchronisation of arrivals regulates airspeed at altitudes. ATCO contributes to stable flight approaches and descents by prescribed exchanges of distance and speed. Of course safety which is only succeeded by flight performance improvements considers situations such as a slower aircraft following behind by faster moving flight vehicle that entails lateral otherwise vertical diversion and corresponding fuel burn absorption (Cao, 2011). The North Pacific region finds a beneficial return of RVSM of about one percent in terms of fuel optimisation with a saving valued at USD8 million, while Europe finds a USD60 million savings per annum. Its correlated carbon savings is about 1.6 percent in CO2 emissions, one percent less on NOx emissions and 260 tons less in sulphur oxide per annum (International Civil Aviation Organization, 2019). Continuous Descent Approach The Continuous Descent Approach technique provides arrivals the freedom to pan out a preferred continuous descent trajectory. The practice encourages the reduction of fuel burn and noise; carbon emissions and flight duration. A CDA vertical profile requires more vectoring space and a large portion of the airspace is restricted to other descending flights. As a result, landing intervals take up 3.2 minutes from the average of 1.8 minutes (European Organisation for the Safety of Air Navigation, 2011). Resolving CDA conflicts in highly congested terminals use a combination of trajectory and holding techniques. This developed the FACET which applies CDA profiles by assigning TOD on arrivals, specific to aircraft type. On the average, the glide slope uses a three degree descent for low levels of fuel burn throughout its trajectory (Civil Aviation Authority, 2016).
- 6. Optimal flight descent ✈ | 6 FuelBurnandSpeedBrake(kgs/min) 10000 20000 30000 Flightaltitude(feet) Top of descent Level off •Holding or level off •CDA •CDA fuel burn rate •Holding fuel burn rate Distance from runway to threshold (NM) 100 80 60 40 20 0 20 40 60 80 100 Figure 2 Continuous Descent Approach showing fuel burn (Cao 2011) Free Route Experimental Encounter Resolution The concept of autonomous aircraft operations perceives free-flight airspace. FREER is an experimental solution for converging aircrafts by practicing precedent flight rules in the physical airspace structure. For this technique, airspace vertical separation is managed to specific arrival descent profiles, from a suitable higher altitude (European Organisation for the Safety of Air Navigation, 2011). FREER postulates to devolve certain functions to the flight crew, otherwise an Autonomous Aircraft Operations or AAO using automation. FREER supports fuel optimisation and increases airspace capacity; which encourages concentrated freedom of movement and flexibility for flight operations. With this innovation, the airspace user reduces operating cost at the same time ensures safety but is explorative in form (Civil Aviation Authority, 2016).
- 7. Optimal flight descent ✈ | 7 Fuel burn implications on carbon emission A Pilot in Command has full responsibility to proceed with a stabilised approach and optimal descent. Nearly 85 percent of the potential fuel reduction result from optimised descent trajectories at altitudes above MSL and below 20 000 feet. A single level off consumes about 15 percent of flight fuel burn and reduces the impact on environment without sacrificing safety. This is achievable through the invention of practices other than ground-to-air services across the flight traffic region. Reversely, touch down delay waste about 20.96 percent of the potential fuel savings. On the aspect of aviation gas fuel burn emissions the table below summarises these factors (Gwiggner, 2010). Table 1: Default fuel use and emissions factors for LTO cycle in kg/LTO (IPCC Guidelines on National Greenhouse Gas Inventories) Aircraft type CO2 CH4 N2O NOx CO NMVOCs SO2 Fuel A300 5470 1.0 0.2 27.21 34.4 9.3 1.7 1730 A310 4900 0.4 0.2 22.7 19.6 3.4 1.5 1550 A320 2560 0.04 0.1 11.0 5.3 0.4 0.8 810 BAC1-11 2150 6.8 0.1 4.9 67.8 61.6 0.7 680 BAe 146 1800 0.16 0.1 4.2 11.2 1.2 0.6 570 B707* 5880 9.8 0.2 10.8 92.4 87.8 1.9 1860 B727 4455 0.3 0.1 12.6 9.1 3.0 1.4 1410 B727* 3980 0.7 0.1 9.2 24.5 6.3 1.3 1260 B737-300 2905 0.2 0.1 8.0 6.2 2.0 0.9 920 B737* 2750 0.5 0.1 6.7 16.0 4.0 0.9 870 B737-400 2625 0.08 0.1 8.2 12.2 0.6 0.8 830 B747-200 10680 3.6 0.3 53.2 91.0 32.0 3.4 3380 B747* 10145 4.8 0.3 49.2 115 43.6 3.2 3210 B747-400 10710 1.2 0.3 56.5 45.0 10.8 3.4 3390 B757 4110 0.1 0.1 21.6 10.6 0.8 1.3 1300 B767 5405 0.4 0.2 26.7 20.3 3.2 1.7 1710 Caravelle* 2655 0.5 0.1 3.2 16.3 4.1 0.8 840 DC8 5890 5.8 0.2 14.8 65.2 52.2 1.9 1860 DC9 2780 0.8 0.1 7.2 7.3 7.4 0.9 880 DC10 7460 2.1 0.2 41.0 59.3 19.2 2.4 2360 F28 2115 5.5 0.1 5.3 54.8 49.3 0.7 670 F100 2340 0.2 0.1 5.7 13.0 1.2 0.7 740 L1011* 8025 7.3 0.3 29.7 112 65.4 2.5 2540 SAAB 340 945 1.4(E) 0.03(E) 0.3(E) 22.1(E) 12.7(E) 0.3(E) 300 (E) Tupolev154 6920 8.3 0.2 14.0 116.81 75.9 2.2 2190 Concorde 20290 10.7 0.6 35.2 385 96 6.4 6420 GAjet 2150 0.1 0.1 5.6 8.5 1.2 0.7 680
- 8. Optimal flight descent ✈ | 8 The emission factors for aviation have been derived from an average of a number of typical aircraft. For domestic aircraft, the average fleet is represented by Airbus A320, Boeing 727, Boeing 737-400, Mc Donell Douglas DC9 and MD 80 aircraft. The old fleet is represented by Boeing B737 and Mc Donell Douglas DC9. For international traffic the average fleet is represented by Airbus A300, Boeing 767, B747 and Mc Donell Douglas DC10, whilst the old fleet is represented by the Boeing B707, Boeing 747 and Mc Donell Douglas DC8. Sulphur content of the fuel is assumed to be 0.05% S for both LTO and cruise activities. Total CO2 emissions ( ) ( ) ( ) Total CO2 emissions ( )( ) ( ) ( ) Where W payload = Payload mass Payload mass = (Passenger traffic or demand) (Average load factor) (Fleet mix aircraft size) Average load factor = Available seats/ Passengers Fleet mix aircraft size = nf flights / available seats W empty = empty mass R/V = Range and speed SFC = Special fuel consumption (propulsion) D/L = Drag/Lift ratio
- 9. Optimal flight descent ✈ | 9 Proposed Methodology The methodology has a shell of a case study, by comparative analysis of fuel efficiency for carbon savings between two scenarios: With and without The Melbourne East West Corridor. Data is to be gathered from the Melbourne Airport authorities and Qantas Airways Limited. Figure 3 Research Structure The case study methodology evaluates a specific case and is non-generic in form. The theoretical construct is used to surface details and insights from the aviation community in the specific terminal (European Commission, 2013). For purpose of fuel consumption during landing, the proposed equation borrows the equation of Professor Tulapurkara on computation of fuel consumption for a fraction of the flight (Tulapurkara, 2019) dWf = TSFC x T x dt Where T = W (Coefficient of drag/Coefficient of lift) TSFC is the specific fuel consumption in N/N-hr dt is the time interval from top of descent in hours: deriving distance covered in kilometres and where V is the equivalent flight speed in m/s 1 Analysis & synthesis Define & Describe Learn & Use Investigate LITERATURE REVIEW /SYNTHESIS AND ANYSIS OF DATA CASE METHOD / CBO RESULTS CONCLUSION 2 3 4 Give recommendations on how the technique can improve on fuel efficiency and descend trajectory Investigate the present trajectory in use by the Melbourne East West Corridor Evaluate the quantity fuel burn saved in relation to descend trajectory. Outline potential areas of conflict or inaccuracy
- 10. Optimal flight descent ✈ | 10 Expected Research Outcomes The expected outcome is that there is good fuel efficiency and carbon savings using the Melbourne East West Corridor, when compared to that as of the previous. First off is that landing in Melbourne Airport is typically delayed, which by itself is fuel consumption. Second is that the decongestion eases on the flight path descent trajectory with more pilot command over the combination of airspeed and altitude; effectually consuming more fuel.
- 11. Optimal flight descent ✈ | 11 References Bloem, M. and Sridhar, M. (2011). Optimally and equitably distributing delays with the aggregate flow model. 9th Proceeding of digital avionics systems conference. Dubai: ATM RDS. Cao, Y., Kotegawa, T., Post, J., Sun, D., and De Laurenti, J. (2011). Evaluation of continuous descent approach as a standard terminal airspace operation. Ninth USA-Europe Air Traffic Management Research and Development Seminar (pp. 1-10). New York: ATCO. Civil Air Navigation Services Organisation. (2011). Unstable approaches ATC considerations. London: FAA-ATO. Civil Aviation Authority. (2016). Basic principles of the Continuous Descent Approach (CDA) for the Non-Aviation Community . London: CAA. Clarke, J. and Ren, L. (2011). Operational measures mitigating local emissions through operational procedures: Continuous descent approach flight test results. Georgia: Georgia Institute of Technology. European Organisation for the Safety of Air Navigation. (2011). A guide to implementing Continuous Descent. Brussels: Airports Council International. Gwiggner, C. and Nagaoka, S. (2010). Analysis of fuel efficiency in highly congested arrival flows. Asia-Pacific International Symposium on Aerospace Technology. Tokyo: ATCO. Hansman, J. L. (2010). Workshop on strategies for addressing carbon constraints in commercial aviation. Abu Dhabi: ATCO. International Civil Aviation Organization. (2019). Appendix G to Part 91—Operations in Reduced Vertical Separation Minimum (RVSM) Airspace. Montreal: ICAO. Khan, Z., Idris, H., Vivona, R., Woods, S. and Lanier, R. (2009). Ground automation impact on enabling continuous descent in high density operations. 9th AIAA Aviation Technology, Integration, and Operations Conference . New York: ATIO. Melbourne Airiport. (2019). Melbourne airport runway mode and flight path changes. Melbourne: Melbourne Airport. Senzig, D. F. (2009). Modeling of terminal area airplane fuel consumption. Journal of Aircraft, 1089-1093. Tulapurkara, E. (2019). Estimation of fuel fraction. Madras: Indian Institute of Technology.