SlideShare a Scribd company logo
1 of 7
Download to read offline
Nonlinear Analysis: The Intermodulated Diļ¬€erential Immittance
Spectroscopy
Alberto Battistel* and Fabio La Mantia*
Analytische Chemie āˆ’ Zentrum fuĢˆr Elektrochemie, Ruhr-UniversitaĢˆt Bochum, UniversitaĢˆtsstrasse 150, D-44780 Bochum, Germany
*
S Supporting Information
ABSTRACT: Intermodulation is used for the analysis of the
nonlinear behavior of electrochemical and electronic systems. As
a matter of fact, diļ¬€erent than the passive elements, electro-
chemical systems have a highly nonlinear character, which can be
used to obtain information on the reaction mechanism and
structure of the double layer. The setup for measuring and
analyzing the intermodulated sidebands is discussed in detail,
using a commercial Schottky diode as the ideal system. A general
intermodulated diļ¬€erential immitance spectroscopy technique
was consequently deļ¬ned as the analysis of the variation of the
immittance elements as a function of the stimulus frequency, and
its transfer function was called diļ¬€erential immittance spectrum.
Through a simple model, it was possible to precisely calculate the
ļ¬‚at band voltage and the doping level of the Schottky diode from a single diļ¬€erential immittance spectrum. The diļ¬€erential
immitance spectra of a dummy cell containing passive elements demonstrated the resolution limits of the technique.
If a linear system is perturbed by a single sinusoidal input, the
output will be composed by a single sine wave with the same
frequency of the input, scaled in modulus, and shifted in phase.
In the frequency domain (F-domain) this can be visualized by
both the input and output Fourier transform containing only
one peak at the frequency of the input signal (Figure 1, panels a
and b). If the system is nonlinear, as in electrochemical systems,
the output Fourier transform shows additional peaks,
corresponding to the higher-order harmonics (Figure 1c).
The higher-order harmonics are intrinsically connected with the
nonlinearity of the system; the intensity and the order depend
on the nonlinearity, which can be approximated by higher order
polynomials of the Taylor series. Eventually, the intensity of the
higher order harmonics will be buried in the noise level. To
avoid higher-order harmonics, a small input signal is used, as is
done in electrochemical impedance spectroscopy (EIS). A
spectrum is then obtained by spanning a large range of
frequencies of the input signal.
The intermodulation consists in perturbing the system with
an input composed by two sine waves of diļ¬€erent frequencies
(Figure 1d), which will be called for simplicity stimulus (lower
frequency, fs) and probe (higher frequency, fp). Under such
conditions, the output of a linear system will be composed by
two sine waves with the same frequencies, fs and fp, scaled in
modulus and shifted in phase (Figure 1e), as for a single
sinusoidal perturbation. However, for the nonlinear systems,
the situation is considerably diļ¬€erent: in addition to the higher-
order harmonics of the stimulus and probe, symmetric peaks
around the probe frequency are observed (see Figure 1f), which
are called sidebands. The sidebands are generated by the
second order term of the systemā€™s Taylor series and are located
at fp āˆ’ fs and fp + fs. The output of the probe and the sidebands
in the time domain (t-domain) represent the envelope of the
amplitude modulation (AM) of the stimulus on the probe
signal (i.e., the modulation of the amplitude of the probe
output according to the frequency of the stimulus). This is the
so-called phenomenon of the intermodulation, and it contains
information coming from the stimulus, the probe, and the
characteristics of the system. An important feature of the
sidebands is that the intensity of these signals is in general
higher than the intensity of second harmonics.1
In 1962, Neeb ļ¬rst applied the concept of the intermodu-
lation to an electrochemical system,2
by using intermodulation
polarography to study the nonlinear behavior of the polar-
ization resistance of an electrochemical system. In the 70s,
Rangarajan created a theoretical framework and a mathematical
formalism in which to pose the second-order impedance
spectroscopy.3
Rao et al. proposed to exploit the higher-order
harmonics and the intermodulation signals to recover the
kinetic parameters in corrosion science.4
They provided the
mathematical treatment to obtain the corrosion current and the
Tafel coeļ¬ƒcients. A more detailed treatment was proposed by
Devay and Meszaros.5
They suggested that the measurement of
the intermodulation components is more advantageous than
that of the harmonics components because it is not aļ¬€ected by
instrumental distortions. Bosch et al. applied the intermodu-
lation technique and the theoretical framework proposed by
Received: March 27, 2013
Accepted: June 10, 2013
Published: June 10, 2013
Article
pubs.acs.org/ac
Ā© 2013 American Chemical Society 6799 dx.doi.org/10.1021/ac400907q | Anal. Chem. 2013, 85, 6799āˆ’6805
Devay, Meszaros, and Rao on a real corrosion system.1,6
They
implemented the treatment, adding some considerations about
the error arising from the uncompensated resistance and the
double layer capacitance. So far the study of nonlinearity was
restricted to the faradic reaction of the electrochemical system.
AntanĢƒo-Lopez and co-workers were the ļ¬rst to apply the
intermodulation technique to the study of the double layer.7
They implemented an original setup to perform the experiment
and proposed a new name: the modulation of interface
capacitance transfer function (MICTF) technique. The key
point of this setup was to employ a lock-in ampliļ¬er to
demodulate the intermodulation sidebands. Their idea was to
prove that to consider the double layer capacitance as
independent of the potential was an oversimpliļ¬cation. They
applied their model to the study of a system with ion transfer
and to the study of the interface between TiO2 and SnO2 in a
dye-sensitized nanocrystalline solar cell (DSSC).8
Starting from the treatment of AntanĢƒo-Lopez and co-
workers,7
this work is focused on the development of a
technique for the analysis of the nonlinear behavior of
electrochemical systems, using a diode as a relatively ideal
nonlinear system; the diode is stable, reproducible, and the
intermodulation can be predicted. In fact, the diode is
equivalent to a conductance in parallel with a capacitance,
which is dependent on the polarization potential. Additionally,
a diode represents a fairly challenging benchmark for
electrochemical instrumentation, due to its high impedance.
Based on the intermodulation sidebands, we deļ¬ned a general
transfer function called diļ¬€erential immittance spectrum.
Results from a dummy cell containing only passive elements
(linear system) were used to validate the results and to show
the resolution limit of our instrumentation.
ā–  THEORETICAL BACKGROUND
In the intermodulated diļ¬€erential immittance spectroscopy
(IDIS), the system is perturbed by an input that contains two
sine waves: the probe signal at angular frequency Ī© and the
stimulus signal at angular frequency Ļ‰. Following Figure 1f and
removing the higher-order harmonics of the probe and
stimulus, but keeping the sidebands, one can describe the
output as composed by four sine waves: the probe response at
frequency fp, the stimulus response at frequency fs, and the two
sidebands generated by the intermodulation at frequencies fp āˆ’
fs and fp + fs. If the input is the potential and the output is the
current, the admittance at the angular frequencies Ī© and Ļ‰ can
be calculated at once from
Ī© =
Ī©
Ī©
Y( )
I( )
U( ) (1)
Ļ‰
Ļ‰
Ļ‰
=
Y( )
I( )
U( ) (2)
where I and U represent the Fourier transforms of the current
and potential at the angular frequencies Ī© or Ļ‰. We want to
stress that the conductance, G, is equal to Re(Y), and the
susceptance, B, is equal to Im(Y). From eqs 1 and 2, the
diļ¬€erential conductance, dG, diļ¬€erential susceptance, dB, and
diļ¬€erential admittance, dY, can be deļ¬ned in a general sense as
Ļ‰
Ļ‰
Ļ‰
Ī© = Ī©
G
d ( , )
G ( )
U( ) (3)
Ļ‰
Ļ‰
Ļ‰
Ī© = Ī©
B
d ( , )
B ( )
U( ) (4)
Ļ‰ Ļ‰ Ļ‰
Ī© = Ī© + Ī©
Y G B
d ( , ) d ( , ) jd ( , ) (5)
where GĪ©, BĪ©, and YĪ© are the Fourier transforms of the probe
conductance, susceptance, and admittance at the stimulus
angular frequency Ļ‰, respectively, and j is the imaginary unit. It
has to be stressed that Re(dY) is equal to Re(dG) āˆ’ Im(dB),
and Im(dY) is equal to Im(dG) + Re(dB). The conductance
Figure 1. Schematic of the Fourier transform for a single (ļ¬rst row) and double input measurement (second row) on a linear (second column) and
nonlinear system (third column). Ī” represents the fundamental harmonic, ā–” the higher-order harmonics, and ā—‹ the intermodulation sidebands.
Analytical Chemistry Article
dx.doi.org/10.1021/ac400907q | Anal. Chem. 2013, 85, 6799āˆ’6805
6800
and susceptance can be measured in the time domain by the
lock-in ampliļ¬er, as done by AntanĢƒo-Lopez and co-workers.7
However, their Fourier transform at Ļ‰ can be calculated
directly from the sidebands rising from the intermodulation
(see appendix A of the Supporting Information). The general
term intermodulated diļ¬€erential immittance spectroscopy was
used to describe both diļ¬€erential admittance and diļ¬€erential
impedance. In appendix B of the Supporting Information, the
treatment for the intermodulated diļ¬€erential impedance
spectroscopy is reported. The diļ¬€erential conductance and
the diļ¬€erential susceptance both respond to the Kramerāˆ’
Kronig relations.
The equivalent circuit of a diode in reverse bias is
represented by a capacitance in parallel to a conductance.
The capacitance takes into account the accumulation of charge
in the space charge region, and its dependence on the
polarization potential is given by the Mottāˆ’Schottky equation.9
The parallel conductance represents the leakage current due to
thermo-emission of electrons and movement of the holes in the
valence band; the conductance is weakly dependent on the
polarization potential. The stimulus aļ¬€ects the potential across
the diode, and as consequence, the value of the capacitance of
the diode, which is the origin of the amplitude modulation of
the probe current at the stimulus frequency. The Fourier
transform of the current is very similar to that depicted by
Figure 1f. Following eqs 3, 4, and 5 and the equivalent circuit of
the Schottky diode, dG should be negative and imaginary, and
dB should be negative and real (see appendix C of the
Supporting Information). Both terms are correlated to the
variation of the capacitance with the potential; however, the
value of dG is proportional to Ļ‰, while the value of dB is
proportional to Ī©. From the Mottāˆ’Schottky analysis, it is
possible to derive the ļ¬‚at band voltage and, knowing the
relative permittivity Īµr, the dopant concentration of the
semiconductor in the diode. The same information is obtained
by the intermodulated diļ¬€erential admittance spectroscopy. We
want to stress that Mottāˆ’Schottky analysis is done acquiring
several EIS at diļ¬€erent potential values and plotting the
reciprocal of the square of the calculated capacitance against the
potential, while the diļ¬€erential admittance spectrum is obtained
at a single potential.
ā–  EXPERIMENTAL SECTION
The Instrument. The instrument was composed by a
potentiostat PG_310USB (HEKA Elektronik), a 2-channel
lock-in ampliļ¬er HF2LI (Zurich Instruments), a 4-channel
oscilloscope PicoScope 4424 (Pico Technology), two sine wave
generators (included in the lock-in ampliļ¬er), and a personal
computer equipped with Matlab. The main characteristic of the
potentiostat is a wide bandwidth associated with a low noise
level, so that only small distortions are introduced at high
frequencies. Figure 2 shows a schematic of the instrument.
Generator 1 provides the sine wave of the stimulus at frequency
fs and generator 2 the sine wave of the probe at frequency fp (fp
> fs); the latter was also used as a reference for the lock-in
ampliļ¬er. The signals produced by the generators were
summed and sent to the potentiostat, which was connected
to the investigated system. The current and potential outputs of
the potentiostat were sent to the ļ¬rst two channels of the
oscilloscope; the current output was sent also to the lock-in
ampliļ¬er, where it was demodulated according to the reference
signal (the probe signal). The in-phase and out-of-phase
components of the current were ampliļ¬ed and sent to the
remaining two channels of the oscilloscope. The immittance
and the diļ¬€erential immittance are obtained by the PC, using
homemade Matlab-based software and calculating the Fourier
transform of the signals recorded by the four channels of the
oscilloscope.
Investigated Systems. Two systems were investigated: a
Schottky diode 80SQ040 (International Rectiļ¬er), as an ideal
nonlinear system and a dummy cell composed by a 9.4 MĪ©
resistor in parallel with a 2 nF capacitor, as an ideal linear
system. Cyclic voltammetry and electrochemical impedance
spectroscopy (EIS) were performed on the Schottky diode
using a Zahner Zennium (Zahner) potentiostat between 0 and
2 V. A scan rate of 10 mV sāˆ’1
was used for the cyclic
voltammetry. The impedance spectra were measured between
100 kHz and 100 mHz, with 10 points per decade, using a 10
mV amplitude voltage sine wave, and an impedance spectrum
was recorded each 100 mV. The diode was connected to the
potentiostat using the IUPAC oļ¬ƒcial setup, with the cathode
attached to the working electrode and the anode to the
reference and counter electrodes. For the measurement of the
diļ¬€erential immittance, the probe frequency was kept constant
at 1 kHz, and the stimulus frequency was scanned between 100
Hz and 100 mHz, at 10 points per decade. The amplitude of
the probe and the stimulus were 20 and 40 mV, respectively.
These are optimized values that provide good signal-to-noise
ratios. Ten cycles of the stimulus signal were recorded with 20
points per period of the probe signal. A polarization voltage of
0.5 V was chosen for both systems.
ā–  RESULTS AND DISCUSSION
Cyclic Voltammetry and EIS on the Diode. Figure 3a
shows the cyclic voltammogramm of the diode at a scan rate of
10 mV sāˆ’1
, performed between 0 and 2 V. This voltage window
corresponds to the inverse region of the diode; its ļ¬‚at band
voltage is a located at āˆ’0.53 V. The leakage current is equal to
ca. 400 nA at a 0.5 V polarization voltage. In the same voltage
window an impedance spectrum was recorded each 100 mV.
Calculating the parallel capacitance from the imaginary part of
the admittance at 100 kHz for each potential, it was possible to
use the Mottāˆ’Schottky analysis to obtain the ļ¬‚at band voltage
Figure 2. Schematic of the instrument setup. Generator 1 outputs the
stimulus signal and generator 2 the probe signal. The potentiostat
sends the potential output and the current output to the ļ¬rst two
channels of the oscilloscope and current output to the input of the
lock-in ampliļ¬er. The lock-in demodulates the current and sends the
in-phase and out-of-phase components to the second two channels of
the oscilloscope.
Analytical Chemistry Article
dx.doi.org/10.1021/ac400907q | Anal. Chem. 2013, 85, 6799āˆ’6805
6801
and the dopant concentration. The Mottāˆ’Schottky analysis is
based on the following equation (for n-type semiconductors):
Īµ Īµ
=
| |
āˆ’ āˆ’
| |
āˆ’
āŽ›
āŽ
āŽœ
āŽž
āŽ 
āŽŸ
C N
U U
k T
1 2
e e
SC
2
r 0 D
E fb
B
(6)
where CSC is the capacitance of the Schottky diode, Īµr the
relative dielectric constant, Īµ0 the permittivity of vacuum, e the
charge of the electron, ND the concentration of dopants, UE the
polarization voltage, Ufb the ļ¬‚at band voltage, kB the Boltzmann
constant, T the absolute temperature. In Figure 3b, the Mottāˆ’
Schottky plot for the diode is reported. From the linear
regression, a ļ¬‚at band potential of āˆ’0.536 Ā± 0.005 V and a
dopant concentration of 3.61 Ɨ 1017
Ā± 1015
cmāˆ’3
were
calculated (Īµr = 11.68). The same results were achieved using
lower frequencies (down to 1 kHz) and restricting the potential
range from 0.2 to 2 V.
Intermodulated Diļ¬€erential Immittance Spectrosco-
py (IDIS) on the Schottky Diode. For measuring the
diļ¬€erential immitance spectra, two conļ¬gurations are possible:
the current and potential output of the potentiostat are
connected to a 2-channel oscilloscope and the diļ¬€erential
immittance is calculated from the Fourier transform of the
current at Ī© āˆ’ Ļ‰ and Ī© + Ļ‰ (oscilloscope setup) or the current
output is demodulated at angular frequency Ī© by a lock-in
ampliļ¬er and the in-phase and out-of-phase components are
recorded by an oscilloscope (lock-in setup). In the latter case, a
4-channel oscilloscope is necessary: potential, current, in-phase
component, and out-of-phase component have to be recorded
as a function of time, and the diļ¬€erential immittance is
calculated from the Fourier transform of the in-phase and out-
of-phase components at Ļ‰. In the next paragraph, we will
discuss the oscilloscope setup and its limitations.
The diļ¬€erential immittance spectra were measured at a
polarization voltage of 0.5 V, using a probe frequency of 1 kHz
and a stimulus frequency scanning from 100 Hz to 100 mHz,
with 10 points per decade. Ten cycles of the stimulus signal and
20 points per period of the probe signal were recorded with two
channels of the oscilloscope. The Fourier transform was
performed on the potential at angular frequencies Ī© and Ļ‰ and
on the current at angular frequencies Ī©, Ļ‰, Ī© āˆ’ Ļ‰, and Ī© + Ļ‰,
using a Blackmanāˆ’Harris window function (see appendix D of
the Supporting Information). The result of the Fourier
transform of the current in the whole range of frequencies is
reported in Figure 4b for the stimulus frequency of 10 Hz. The
sidebands are located at 990 and 1010 Hz, as expected for the
intermodulation eļ¬€ect. The impedance spectrum at 0.5 V can
be calculated from the Fourier transform of the potential and
current at Ļ‰. This is reported in the Nyquist plot of Figure 4a,
together with the impedance measured previously at 0.5 V with
the Zahner Zennium. The two curves are very close, thus
indicating the good quality of data. The resistance measured by
the IDIS is smaller because of the higher amplitude of the
stimulus oscillation. By ļ¬tting the impedance spectrum with a
capacitance parallel to a resistance, the values of 1.76 nF and
7.74 MĪ© are obtained. The good quality of the ļ¬tting also
conļ¬rms that the data respond to the Kramerāˆ’Kronig relations.
The measurement of IDIS can be aļ¬€ected by the control
loop of the potentiostat and bandwidth of the current follower.
First, the control loop of the potentiostat can introduce a delay
and an attenuation of the applied sine wave potential at high
frequencies (the probe frequency) with respect to the
Figure 3. (a) Cyclic voltammetry of the diode between 0 and 2 V at 10
mV sāˆ’1
. (b) Mottāˆ’Schottky plot of the capacitance of the diode
measured at 100 kHz and linear regression.
Figure 4. (a) Nyquist plot of the EIS of the diode performed with a
commercial instrument and that recorded with the oscilloscope setup.
(b) Fourier transform of the current of the diode with a stimulus
frequency of 10 Hz and a probe frequency of 1 kHz.
Analytical Chemistry Article
dx.doi.org/10.1021/ac400907q | Anal. Chem. 2013, 85, 6799āˆ’6805
6802
generated one; this error is easily compensated because the real
applied potential is measured. The bandwidth of the current
follower also introduces a delay and an attenuation of the
measured current with respect to the real current ļ¬‚owing
through the system. The correction of this distortion requires
the knowledge of the transfer function of the current followers.
In general, the lower is the current range (the higher is the
current ampliļ¬cation), the lower is the bandwidth of the
current follower. In this work, rather low current ranges (10
Ī¼A) had to be used to enhance the signal of the sidebands. The
transfer function of the current ampliļ¬er is obtained by means
of a calibrated resistor and measuring its impedance in the
frequency range from 100 kHz to 100 mHz. The normalized
admittance represents the transfer function of the current
follower.
In Figure 5a, the diļ¬€erential conductance, dG, and the
diļ¬€erential susceptance, dB, are reported in their real and
imaginary part, as a function of the stimulus frequency. As
expected (see appendix C of the Supporting Information), the
value of dG is imaginary, negative, and increases with increasing
fs, while the value of dB is real, negative, and constant with fs. In
Figure 5b, the diļ¬€erential admittance, dY, is reported as a
function of the stimulus frequency. dY is composed only by the
imaginary part, while the real part remains mostly near 0.
Im(dY) increases at higher stimulus frequencies, in accordance
with the value of Im(dG) becoming larger. The diļ¬€erential
susceptance for the diode is given by:
Īµ Īµ
= āˆ’Ī©
| |
āˆ’ āˆ’
| |
āˆ’
āŽ›
āŽ
āŽœ
āŽž
āŽ 
āŽŸ
B
N
U U
k T
d
1
2
e
2 e
r 0 D
E fb
B
3/2
(7)
More details on eq 7 can be found in appendix C of the
Supporting Information. Equation 7 can be used together with
eq 6 for calculating the ļ¬‚at band voltage and the dopant level,
with results equal to āˆ’0.535 Ā± 0.01 V and 3.92 Ɨ 1017
Ā± 8 Ɨ
1015
cmāˆ’3
, respectively. Table 1 presents a summary of the
results obtained with the diļ¬€erent techniques compared with
the tabulated data. They all show to be in good agreement.
The advantage of using the oscilloscope setup is of course a
reduction of the costs and connections required. However, care
has to be taken that high resolution in the F-domain is
obtained, which is achieved by long time recording; this is
necessary to visualize precisely the sidebands and separate them
from the sidelobes of the probe frequency, as explained in more
detail in appendix D of the Supporting Information. For this
reason, up to 10 cycles of the stimulus signal are acquired.
Moreover, to avoid the high frequency noise, 20 points per
period of the probe signal are recorded. The restriction in the
ratio Ī©/Ļ‰ rises from the fact that the number of points
recorded at each stimulus frequency is equal to some 200 Ī©/Ļ‰,
and that due to limitations in the calculation power of the PC,
ļ¬les larger than 10 million points are diļ¬ƒcult to handle. If lower
frequencies have to be reached, the lock-in ampliļ¬er in
combination with four low-pass ļ¬lters has to be used to
demodulate the current with respect to the probe frequency.
Moreover, as will be shown below, the lock-in ampliļ¬er has a
slightly higher resolution and better signal-to-noise ratio, with
respect to the oscilloscope and could be necessary for extremely
low values of the diļ¬€erential immittance.
Use of the Lock-in Ampliļ¬er for Measuring the IDIS. A
lock-in ampliļ¬er can be used to measure directly the
conductance and the susceptance of the system at the probe
frequency. Under these conditions, additionally to the current
and potential at fs, the measured conductance and susceptance
can also be recorded by a 4-channels oscilloscope (lock-in
setup). After the acquisition, the diļ¬€erential conductance and
susceptance can be calculated from the Fourier transform of the
conductance and susceptance at angular frequency, Ļ‰,
respectively, as explained in the Theoretical Background by
eqs 3āˆ’5. However, a lock-in ampliļ¬er may be a source of
distortion in the measured diļ¬€erential immittance: ļ¬rst, the
phase of the demodulator of the current has to be adjusted to
avoid delays between the real current ļ¬‚owing through the
system and the measured current; moreover, the lock-in
ampliļ¬er tries to cut oļ¬€ the intermodulation, as it considers it as
noise. The advantage of using the lock-in ampliļ¬er is that the
conductance and the susceptance are directly measured and it
allows exploring a larger range of stimulus frequencies because
Figure 5. (a) Bode plot of the real (empty symbols) and imaginary
part (solid symbols) of the diļ¬€erential conductance (ā— and ā—‹) and of
the diļ¬€erential susceptance (ā–³ and ā–²). (b) Bode plot of the real (ā—‹)
and imaginary part (ā—) of the diļ¬€erential admittance.
Table 1. Flat Band Potential, Ufb, and Dopant
Concentration, ND, of the Diode Calculated with the
Diļ¬€erential Admittance Measured by the Oscilloscope Setup
and the Lock-in Setup, with the Mott-Schottky (M-S)
Analysis, and Reported in the Datasheet
Ufb (V) ND (1017
cmāˆ’3
)
oscilloscope setup āˆ’0.535 Ā± 0.01 3.92 Ā± 0.08
lock-in setup āˆ’0.527 Ā± 0.006 3.88 Ā± 0.01
M-S analysis āˆ’0.536 Ā± 0.005 3.61 Ā± 0.01
tabulated data āˆ’0.53 not reported
Analytical Chemistry Article
dx.doi.org/10.1021/ac400907q | Anal. Chem. 2013, 85, 6799āˆ’6805
6803
high frequency signals do not need to be recorded. The setup in
this paper consists of a 2-channel lock-in ampliļ¬er; before
starting the experiment, the software automatically forces the
lock-in to detect the phase shift between the generated and the
applied probe signal (the delay introduced by the control loop
of the potentiostat) and then adds it to the shift in phase of the
current follower (measured as in paragraph 4.2) and sets it as
the phase of the demodulator. In this way, the distortion
between the measured and the real current ļ¬‚owing through the
system is removed, apart from a proportional factor that can be
calculated later from the transfer function of the potentiostat.
A lock-in ampliļ¬er is designed to demodulate the input signal
with respect to a reference signal, which can be external or
internal. The demodulation consists in measuring the
correlation between the input and reference signal (in a
mathematical sense). The correlation can be then used to
calculate the in-phase and out-of-phase components of the
input signal with respect to the reference signal. After the
demodulation, the in-phase and out-of-phase components pass
through a low-pass ļ¬lter and an ampliļ¬er. The series of the
demodulation and low-pass ļ¬lter is equivalent to a band-pass
ļ¬lter. Because of the low-pass ļ¬lter, the lock-in ampliļ¬er
introduces a distortion to the diļ¬€erential immittance through
its own transfer function. The low-pass ļ¬lter has a bandwidth
that is given by the time constant of the lock-in ampliļ¬er and
the order of the ļ¬lter: a long time constant and a high-order
ļ¬lter attenuate all the signals away from the reference, including
the intermodulation eļ¬€ect and a short time constant and a low
order ļ¬lter allow demodulating the sidebands properly at
expenses of high noise level. This eļ¬€ect generates a limitation
on the higher stimulus frequency that can be measured: in the
proposed setup, with a fourth-order ļ¬lter (24 db/octave), the
upper limit in fs is equal to 0.1fp.
If we name Ī”Ļ‰ the bandwidth of the lock-in in rad sāˆ’1
, the
relevant parameter that controls the transfer function of the
lock-in ampliļ¬er with respect to the stimulus frequency is given
by Ļ‰/Ī”Ļ‰. The relation between the time constant, tC, and the
bandwidth is
Ļ‰
Ī” =
A
tC (8)
where A is a constant that depends on the low-pass ļ¬lter order.
The transfer function of the lock-in, H(Ļ‰/Ī”Ļ‰), was obtained
from the ratio of the diļ¬€erential admittance measured from the
lock-in setup and the one measured by the oscilloscope setup
for the Schottky diode, recorded for diļ¬€erent values of Ī”Ļ‰ and
Ļ‰/Ī”Ļ‰. In Figure 6, the measured transfer function of the lock-
in ampliļ¬er is reported in the Bode representation. The
experimental data (empty dots) were ļ¬tted with a fourth-order
inverse polynomial (line), which was thereafter used for the
proper correction. For Ļ‰/Ī”Ļ‰ = 1, the attenuation is 3 db, and
the phase-shift is ca. 90 degrees. For Ļ‰/Ī”Ļ‰ > 1, H attenuates
and strongly delays the intermodulation signal; however, larger
frequencies are measurable. For Ļ‰/Ī”Ļ‰ < 1, H tends to unity
and the phase-shift tends to 0 degrees, but frequencies near fp
are not accessible. A good compromise was obtained with Ļ‰/
Ī”Ļ‰ = 0.2. The homemade software automatically sets Ī”Ļ‰ = 5Ļ‰
each time the stimulus frequency is changed. In this way, it is
possible to measure dG and dB with higher precision than by
using the oscilloscope setup. In Table 1, the analysis of the
diļ¬€erential immitance of the diode measured with the lock-in
setup, maintaining Ī”Ļ‰ = 5Ļ‰ is reported and is in very good
agreement with the previous results obtained with the
oscilloscope setup, with the Mottāˆ’Schottky analysis and
reported in the database.
The Ideal Linear System: The Dummy Cell. A dummy
cell composed by passive elements is the ideal linear system. A
dummy cell consisting of a 9.4 MĪ© resistor in parallel to a 2 nF
capacitor was built and tested. The diļ¬€erential admittance was
measured at 0.5 V potential using a probe signal of 1 kHz,
having amplitude of 20 mV and a stimulus signal ranging from
100 Hz to 100 mHz, with 40 mV of amplitude. The
measurement was performed with both oscilloscope setup
and lock-in setup. In Figure 7a, the Fourier transform of the
current signal in a large range of frequencies is reported for fs
equal to 10 Hz. For comparison, the same result for the
Schottky diode is reported. It can be immediately observed that,
while for the Schottky diode the intermodulation sidebands are
clearly visible, for the dummy cell, the intermodulation
sidebands are completely buried under the noise level. The
diļ¬€erential admittance of the dummy cell is a measure of the
noise level of the device. In Figure 7b, the noise level of the
IDIS for the oscilloscope setup and for the lock-in setup,
measured though the diļ¬€erential admittance of the dummy cell,
is shown. We want to stress that the noise level is very low and
less than 1% of the measured value in the diode. Also, it can be
observed that in the range between 1 and 10 Hz, the lock-in
setup works better than the oscilloscope setup. Under these
conditions, the limit of detectability of the diļ¬€erential
admittance is equal to ca. 20 nS Vāˆ’1
.
ā–  CONCLUSIONS
The intermodulation eļ¬€ect can be used to study the
nonlinearity of electrochemical and electronic systems. To
measure it, it is possible to proceed with a simpliļ¬ed approach,
using a 2-channel oscilloscope to record the current and the
Figure 6. Bode plots of the lock-in ampliļ¬er transfer function H,
experimental data (ā—‹), and fourth-order inverse polynomial ļ¬t (line):
(a) absolute value and (b) phase-shift of H.
Analytical Chemistry Article
dx.doi.org/10.1021/ac400907q | Anal. Chem. 2013, 85, 6799āˆ’6805
6804
potential in the system (oscilloscope setup), or measure directly
the conductance and susceptance of the system by demodulat-
ing the current with a lock-in ampliļ¬er and recording the
signals with a 4-channel oscilloscope (lock-in setup). Both
conļ¬gurations have advantages and disadvantages. The
oscilloscope setup is less complicated, but a limitation rises in
the maximum value of Ī©/Ļ‰ that can be explored, mainly due to
the limited calculation power of the personal computer. The
lock-in setup has the advantage to make lower stimulus
frequencies accessible; however, it has a limited higher stimulus
frequency (fs < 0.1fp) due to the correlation between the time
constant of the lock-in ampliļ¬er and noise rejection. Moreover,
the transfer function of the lock-in ampliļ¬er, H, has to be
measured. We proposed to measure H by comparison of the
diļ¬€erential immittances of a Schottky diode obtained by the
lock-in setup and the oscilloscope setup in the range of stimulus
frequencies that are available for both conļ¬gurations. The
diļ¬€erential immittance of a diode (an ideal nonlinear system)
was measured. From the data, it was possible to obtain the ļ¬‚at
band voltage and the dopant concentrations, which showed
good agreement with the values tabulated and obtained with
classical techniques (such as the Mottāˆ’Schottky analysis).
Measuring the diļ¬€erential admittance on a dummy cell
composed by passive elements, it was possible to quantify the
detectability limit of the setups; the error on the values of dY
obtained for the diode was estimated to be less than 1%. We
can foresee the importance of such a technique to study the
reaction mechanism of electro-catalytic reactions, the transport
and trapping of carriers in semiconductors, the electron transfer
in surface-conļ¬ned species, the corrosion behavior of metals,
and in other ļ¬elds.
ā–  ASSOCIATED CONTENT
*
S Supporting Information
The Supporting Information contains four appendixes: A,
correlation between diļ¬€erential admittance and sidebands; B,
correlation between diļ¬€erential impedance and diļ¬€erential
admittance; C, diļ¬€erential admittance of the Schottky diode;
and D, the window function and the sidelobes. This material is
available free of charge via the Internet at http://pubs.acs.org.
ā–  AUTHOR INFORMATION
Corresponding Author
*A.B.: e-mail, alberto.battistel@rub.de. F.L.M.: e-mail, fabio.
lamantia@rub.de.
Notes
The authors declare no competing ļ¬nancial interest.
ā–  ACKNOWLEDGMENTS
The ļ¬nancial support by the Federal Ministry of Education and
Research (BMBF) in the framework of the project ā€œEnergies-
peicherā€ (Grant FKZ 03EK3005) and the funding of the
Centre for Electrochemical Sciences (CES) by the European
Commission and the state North Rhine-Westphalia (NRW) in
the framework of the HighTech.NRW program are gratefully
acknowledged.
ā–  REFERENCES
(1) Bosch, R. W.; Bogaerts, W. F. Corrosion 1996, 52 (3), 204āˆ’212.
(2) Neeb, R. Naturwissenschaften 1962, 49 (19), 447āˆ’447.
(3) (a) Rangarajan, S. K. J. Electroanal. Chem. Interfacial Electrochem.
1974, 56 (1), 1āˆ’25. (b) Rangarajan, S. K. J. Electroanal. Chem.
Interfacial Electrochem. 1974, 56 (1), 27āˆ’53. (c) Rangarajan, S. K. J.
Electroanal. Chem. Interfacial Electrochem. 1974, 55 (3), 337āˆ’361.
(d) Rangarajan, S. K. J. Electroanal. Chem. Interfacial Electrochem. 1974,
55 (3), 363āˆ’374.
(4) Rao, P. G.; Mishra, A. K. J. Electroanal. Chem. Interfacial
Electrochem. 1977, 77 (1), 121āˆ’125.
(5) Devay, J.; Meszaros, L. Acta Chim. Acad. Sci. Hung. 1980, 104,
311.
(6) Bosch, R. W.; Hubrecht, J.; Bogaerts, W. F.; Syrett, B. C.
Corrosion 2001, 57 (1), 60āˆ’70.
(7) (a) AntanĢƒo-Lopez, R.; Keddam, M.; Takenouti, H. Electrochim.
Acta 2001, 46 (24āˆ’25), 3611āˆ’3617. (b) AntanĢƒo-Lopez, R.; Keddam,
M.; Takenouti, H. Corros. Eng., Sci. Technol. 2004, 39 (1), 59āˆ’64.
(c) Larios-DuraĢn, E. R.; AntanĢƒo-LoĢpez, R.; Keddam, M.; Meas, Y.;
Takenouti, H.; Vivier, V. Electrochim. Acta 2010, 55 (21), 6292āˆ’6298.
(8) Cachet, H.; Keddam, M.; Takenouti, H.; AntanĢŒo-Lopez, R.;
Stergiopoulos, T.; Falaras, P. Electrochim. Acta 2004, 49 (16), 2541āˆ’
2549.
(9) Dewald, J. F. J. Phys. Chem. Solids 1960, 14 (0), 155āˆ’161.
Figure 7. (a) Fourier transform of the current of the diode (line) and
of the dummy cell (ā—‹) with a stimulus frequency of 10 Hz and a probe
frequency of 1 kHz. (b) Bode plot of the absolute value of the
diļ¬€erential admittance measured by the oscilloscope setup (ā—‹) and
the lock-in setup (line).
Analytical Chemistry Article
dx.doi.org/10.1021/ac400907q | Anal. Chem. 2013, 85, 6799āˆ’6805
6805

More Related Content

Similar to Nonlinear Analysis of Electrochemical Systems Using Intermodulation Spectroscopy

High Impedance Fault Detection in Power Distribution Networks with Use of Cur...
High Impedance Fault Detection in Power Distribution Networks with Use of Cur...High Impedance Fault Detection in Power Distribution Networks with Use of Cur...
High Impedance Fault Detection in Power Distribution Networks with Use of Cur...ijeei-iaes
Ā 
Electronic Transport Calculation of a Selective Gas Sensor Based on an InAs/I...
Electronic Transport Calculation of a Selective Gas Sensor Based on an InAs/I...Electronic Transport Calculation of a Selective Gas Sensor Based on an InAs/I...
Electronic Transport Calculation of a Selective Gas Sensor Based on an InAs/I...Sebastian Caicedo Davila
Ā 
Overview Of Spintronics
Overview Of SpintronicsOverview Of Spintronics
Overview Of Spintronicschakuli259
Ā 
Microwave advancement
Microwave advancementMicrowave advancement
Microwave advancementHai Tun Struck
Ā 
2. Introduction to Spectroscopy 2022.pptx
2. Introduction to Spectroscopy 2022.pptx2. Introduction to Spectroscopy 2022.pptx
2. Introduction to Spectroscopy 2022.pptxWilliamkambi
Ā 
Performance Comparison of Power Quality Evaluation Using Advanced High Resolu...
Performance Comparison of Power Quality Evaluation Using Advanced High Resolu...Performance Comparison of Power Quality Evaluation Using Advanced High Resolu...
Performance Comparison of Power Quality Evaluation Using Advanced High Resolu...IOSRJEEE
Ā 
Integrated ring resonator system analysis to Optimize the soliton transmission
Integrated ring resonator system analysis to Optimize the soliton transmissionIntegrated ring resonator system analysis to Optimize the soliton transmission
Integrated ring resonator system analysis to Optimize the soliton transmissionPremier Publishers
Ā 
Harmoni resonance mode analysis
Harmoni resonance mode analysisHarmoni resonance mode analysis
Harmoni resonance mode analysisJose Rubens Macedo Jr
Ā 
Development of A 3d Model Eddy Current Testing
Development of A 3d Model Eddy Current TestingDevelopment of A 3d Model Eddy Current Testing
Development of A 3d Model Eddy Current Testinginventionjournals
Ā 
My Presentation @Ryerson University
My Presentation @Ryerson UniversityMy Presentation @Ryerson University
My Presentation @Ryerson UniversityJagdish Bhatt
Ā 
Optical interferometery to detect sound waves as an analogue for gravitationa...
Optical interferometery to detect sound waves as an analogue for gravitationa...Optical interferometery to detect sound waves as an analogue for gravitationa...
Optical interferometery to detect sound waves as an analogue for gravitationa...Thomas Actn
Ā 
Iisrt 4-study on 20 and 50 gbps soliton transmission in conventional single m...
Iisrt 4-study on 20 and 50 gbps soliton transmission in conventional single m...Iisrt 4-study on 20 and 50 gbps soliton transmission in conventional single m...
Iisrt 4-study on 20 and 50 gbps soliton transmission in conventional single m...IISRTJournals
Ā 
Study on 20 and 50 gbps soliton transmission in conventional single mode fiber
Study on 20 and 50 gbps soliton transmission in conventional single mode fiberStudy on 20 and 50 gbps soliton transmission in conventional single mode fiber
Study on 20 and 50 gbps soliton transmission in conventional single mode fiberIISRT
Ā 
Study on 20 and 50 gbps soliton transmission in conventional single mode fiber
Study on 20 and 50 gbps soliton transmission in conventional single mode fiberStudy on 20 and 50 gbps soliton transmission in conventional single mode fiber
Study on 20 and 50 gbps soliton transmission in conventional single mode fiberRamesh Patriotic
Ā 
Pseudoperiodic waveguides with selection of spatial harmonics and modes
Pseudoperiodic waveguides with selection of spatial harmonics and modesPseudoperiodic waveguides with selection of spatial harmonics and modes
Pseudoperiodic waveguides with selection of spatial harmonics and modesVictor Solntsev
Ā 
POSTER PeterSchwarz
POSTER PeterSchwarzPOSTER PeterSchwarz
POSTER PeterSchwarzPeter Schwarz
Ā 
Some possible interpretations from data of the CODALEMA experiment
Some possible interpretations from data of the CODALEMA experimentSome possible interpretations from data of the CODALEMA experiment
Some possible interpretations from data of the CODALEMA experimentAhmed Ammar Rebai PhD
Ā 

Similar to Nonlinear Analysis of Electrochemical Systems Using Intermodulation Spectroscopy (20)

High Impedance Fault Detection in Power Distribution Networks with Use of Cur...
High Impedance Fault Detection in Power Distribution Networks with Use of Cur...High Impedance Fault Detection in Power Distribution Networks with Use of Cur...
High Impedance Fault Detection in Power Distribution Networks with Use of Cur...
Ā 
Electronic Transport Calculation of a Selective Gas Sensor Based on an InAs/I...
Electronic Transport Calculation of a Selective Gas Sensor Based on an InAs/I...Electronic Transport Calculation of a Selective Gas Sensor Based on an InAs/I...
Electronic Transport Calculation of a Selective Gas Sensor Based on an InAs/I...
Ā 
Overview Of Spintronics
Overview Of SpintronicsOverview Of Spintronics
Overview Of Spintronics
Ā 
REU_paper
REU_paperREU_paper
REU_paper
Ā 
Microwave advancement
Microwave advancementMicrowave advancement
Microwave advancement
Ā 
EIS.ppt
EIS.pptEIS.ppt
EIS.ppt
Ā 
EIS
EISEIS
EIS
Ā 
2. Introduction to Spectroscopy 2022.pptx
2. Introduction to Spectroscopy 2022.pptx2. Introduction to Spectroscopy 2022.pptx
2. Introduction to Spectroscopy 2022.pptx
Ā 
Performance Comparison of Power Quality Evaluation Using Advanced High Resolu...
Performance Comparison of Power Quality Evaluation Using Advanced High Resolu...Performance Comparison of Power Quality Evaluation Using Advanced High Resolu...
Performance Comparison of Power Quality Evaluation Using Advanced High Resolu...
Ā 
Integrated ring resonator system analysis to Optimize the soliton transmission
Integrated ring resonator system analysis to Optimize the soliton transmissionIntegrated ring resonator system analysis to Optimize the soliton transmission
Integrated ring resonator system analysis to Optimize the soliton transmission
Ā 
Harmoni resonance mode analysis
Harmoni resonance mode analysisHarmoni resonance mode analysis
Harmoni resonance mode analysis
Ā 
Development of A 3d Model Eddy Current Testing
Development of A 3d Model Eddy Current TestingDevelopment of A 3d Model Eddy Current Testing
Development of A 3d Model Eddy Current Testing
Ā 
My Presentation @Ryerson University
My Presentation @Ryerson UniversityMy Presentation @Ryerson University
My Presentation @Ryerson University
Ā 
Optical interferometery to detect sound waves as an analogue for gravitationa...
Optical interferometery to detect sound waves as an analogue for gravitationa...Optical interferometery to detect sound waves as an analogue for gravitationa...
Optical interferometery to detect sound waves as an analogue for gravitationa...
Ā 
Iisrt 4-study on 20 and 50 gbps soliton transmission in conventional single m...
Iisrt 4-study on 20 and 50 gbps soliton transmission in conventional single m...Iisrt 4-study on 20 and 50 gbps soliton transmission in conventional single m...
Iisrt 4-study on 20 and 50 gbps soliton transmission in conventional single m...
Ā 
Study on 20 and 50 gbps soliton transmission in conventional single mode fiber
Study on 20 and 50 gbps soliton transmission in conventional single mode fiberStudy on 20 and 50 gbps soliton transmission in conventional single mode fiber
Study on 20 and 50 gbps soliton transmission in conventional single mode fiber
Ā 
Pseudoperiodic waveguides with selection of spatial harmonics and modes
Pseudoperiodic waveguides with selection of spatial harmonics and modesPseudoperiodic waveguides with selection of spatial harmonics and modes
Pseudoperiodic waveguides with selection of spatial harmonics and modes
Ā 
POSTER PeterSchwarz
POSTER PeterSchwarzPOSTER PeterSchwarz
POSTER PeterSchwarz
Ā 
Some possible interpretations from data of the CODALEMA experiment
Some possible interpretations from data of the CODALEMA experimentSome possible interpretations from data of the CODALEMA experiment
Some possible interpretations from data of the CODALEMA experiment
Ā 

Recently uploaded

Presiding Officer Training module 2024 lok sabha elections
Presiding Officer Training module 2024 lok sabha electionsPresiding Officer Training module 2024 lok sabha elections
Presiding Officer Training module 2024 lok sabha electionsanshu789521
Ā 
Introduction to ArtificiaI Intelligence in Higher Education
Introduction to ArtificiaI Intelligence in Higher EducationIntroduction to ArtificiaI Intelligence in Higher Education
Introduction to ArtificiaI Intelligence in Higher Educationpboyjonauth
Ā 
Hybridoma Technology ( Production , Purification , and Application )
Hybridoma Technology  ( Production , Purification , and Application  ) Hybridoma Technology  ( Production , Purification , and Application  )
Hybridoma Technology ( Production , Purification , and Application ) Sakshi Ghasle
Ā 
EPANDING THE CONTENT OF AN OUTLINE using notes.pptx
EPANDING THE CONTENT OF AN OUTLINE using notes.pptxEPANDING THE CONTENT OF AN OUTLINE using notes.pptx
EPANDING THE CONTENT OF AN OUTLINE using notes.pptxRaymartEstabillo3
Ā 
Kisan Call Centre - To harness potential of ICT in Agriculture by answer farm...
Kisan Call Centre - To harness potential of ICT in Agriculture by answer farm...Kisan Call Centre - To harness potential of ICT in Agriculture by answer farm...
Kisan Call Centre - To harness potential of ICT in Agriculture by answer farm...Krashi Coaching
Ā 
Proudly South Africa powerpoint Thorisha.pptx
Proudly South Africa powerpoint Thorisha.pptxProudly South Africa powerpoint Thorisha.pptx
Proudly South Africa powerpoint Thorisha.pptxthorishapillay1
Ā 
Paris 2024 Olympic Geographies - an activity
Paris 2024 Olympic Geographies - an activityParis 2024 Olympic Geographies - an activity
Paris 2024 Olympic Geographies - an activityGeoBlogs
Ā 
A Critique of the Proposed National Education Policy Reform
A Critique of the Proposed National Education Policy ReformA Critique of the Proposed National Education Policy Reform
A Critique of the Proposed National Education Policy ReformChameera Dedduwage
Ā 
Class 11 Legal Studies Ch-1 Concept of State .pdf
Class 11 Legal Studies Ch-1 Concept of State .pdfClass 11 Legal Studies Ch-1 Concept of State .pdf
Class 11 Legal Studies Ch-1 Concept of State .pdfakmcokerachita
Ā 
POINT- BIOCHEMISTRY SEM 2 ENZYMES UNIT 5.pptx
POINT- BIOCHEMISTRY SEM 2 ENZYMES UNIT 5.pptxPOINT- BIOCHEMISTRY SEM 2 ENZYMES UNIT 5.pptx
POINT- BIOCHEMISTRY SEM 2 ENZYMES UNIT 5.pptxSayali Powar
Ā 
Science 7 - LAND and SEA BREEZE and its Characteristics
Science 7 - LAND and SEA BREEZE and its CharacteristicsScience 7 - LAND and SEA BREEZE and its Characteristics
Science 7 - LAND and SEA BREEZE and its CharacteristicsKarinaGenton
Ā 
internship ppt on smartinternz platform as salesforce developer
internship ppt on smartinternz platform as salesforce developerinternship ppt on smartinternz platform as salesforce developer
internship ppt on smartinternz platform as salesforce developerunnathinaik
Ā 
CARE OF CHILD IN INCUBATOR..........pptx
CARE OF CHILD IN INCUBATOR..........pptxCARE OF CHILD IN INCUBATOR..........pptx
CARE OF CHILD IN INCUBATOR..........pptxGaneshChakor2
Ā 
Sanyam Choudhary Chemistry practical.pdf
Sanyam Choudhary Chemistry practical.pdfSanyam Choudhary Chemistry practical.pdf
Sanyam Choudhary Chemistry practical.pdfsanyamsingh5019
Ā 
How to Make a Pirate ship Primary Education.pptx
How to Make a Pirate ship Primary Education.pptxHow to Make a Pirate ship Primary Education.pptx
How to Make a Pirate ship Primary Education.pptxmanuelaromero2013
Ā 
Science lesson Moon for 4th quarter lesson
Science lesson Moon for 4th quarter lessonScience lesson Moon for 4th quarter lesson
Science lesson Moon for 4th quarter lessonJericReyAuditor
Ā 
Alper Gobel In Media Res Media Component
Alper Gobel In Media Res Media ComponentAlper Gobel In Media Res Media Component
Alper Gobel In Media Res Media ComponentInMediaRes1
Ā 

Recently uploaded (20)

Presiding Officer Training module 2024 lok sabha elections
Presiding Officer Training module 2024 lok sabha electionsPresiding Officer Training module 2024 lok sabha elections
Presiding Officer Training module 2024 lok sabha elections
Ā 
Introduction to ArtificiaI Intelligence in Higher Education
Introduction to ArtificiaI Intelligence in Higher EducationIntroduction to ArtificiaI Intelligence in Higher Education
Introduction to ArtificiaI Intelligence in Higher Education
Ā 
Hybridoma Technology ( Production , Purification , and Application )
Hybridoma Technology  ( Production , Purification , and Application  ) Hybridoma Technology  ( Production , Purification , and Application  )
Hybridoma Technology ( Production , Purification , and Application )
Ā 
EPANDING THE CONTENT OF AN OUTLINE using notes.pptx
EPANDING THE CONTENT OF AN OUTLINE using notes.pptxEPANDING THE CONTENT OF AN OUTLINE using notes.pptx
EPANDING THE CONTENT OF AN OUTLINE using notes.pptx
Ā 
Kisan Call Centre - To harness potential of ICT in Agriculture by answer farm...
Kisan Call Centre - To harness potential of ICT in Agriculture by answer farm...Kisan Call Centre - To harness potential of ICT in Agriculture by answer farm...
Kisan Call Centre - To harness potential of ICT in Agriculture by answer farm...
Ā 
Proudly South Africa powerpoint Thorisha.pptx
Proudly South Africa powerpoint Thorisha.pptxProudly South Africa powerpoint Thorisha.pptx
Proudly South Africa powerpoint Thorisha.pptx
Ā 
Paris 2024 Olympic Geographies - an activity
Paris 2024 Olympic Geographies - an activityParis 2024 Olympic Geographies - an activity
Paris 2024 Olympic Geographies - an activity
Ā 
A Critique of the Proposed National Education Policy Reform
A Critique of the Proposed National Education Policy ReformA Critique of the Proposed National Education Policy Reform
A Critique of the Proposed National Education Policy Reform
Ā 
Class 11 Legal Studies Ch-1 Concept of State .pdf
Class 11 Legal Studies Ch-1 Concept of State .pdfClass 11 Legal Studies Ch-1 Concept of State .pdf
Class 11 Legal Studies Ch-1 Concept of State .pdf
Ā 
TataKelola dan KamSiber Kecerdasan Buatan v022.pdf
TataKelola dan KamSiber Kecerdasan Buatan v022.pdfTataKelola dan KamSiber Kecerdasan Buatan v022.pdf
TataKelola dan KamSiber Kecerdasan Buatan v022.pdf
Ā 
Staff of Color (SOC) Retention Efforts DDSD
Staff of Color (SOC) Retention Efforts DDSDStaff of Color (SOC) Retention Efforts DDSD
Staff of Color (SOC) Retention Efforts DDSD
Ā 
POINT- BIOCHEMISTRY SEM 2 ENZYMES UNIT 5.pptx
POINT- BIOCHEMISTRY SEM 2 ENZYMES UNIT 5.pptxPOINT- BIOCHEMISTRY SEM 2 ENZYMES UNIT 5.pptx
POINT- BIOCHEMISTRY SEM 2 ENZYMES UNIT 5.pptx
Ā 
Science 7 - LAND and SEA BREEZE and its Characteristics
Science 7 - LAND and SEA BREEZE and its CharacteristicsScience 7 - LAND and SEA BREEZE and its Characteristics
Science 7 - LAND and SEA BREEZE and its Characteristics
Ā 
internship ppt on smartinternz platform as salesforce developer
internship ppt on smartinternz platform as salesforce developerinternship ppt on smartinternz platform as salesforce developer
internship ppt on smartinternz platform as salesforce developer
Ā 
Model Call Girl in Bikash Puri Delhi reach out to us at šŸ”9953056974šŸ”
Model Call Girl in Bikash Puri  Delhi reach out to us at šŸ”9953056974šŸ”Model Call Girl in Bikash Puri  Delhi reach out to us at šŸ”9953056974šŸ”
Model Call Girl in Bikash Puri Delhi reach out to us at šŸ”9953056974šŸ”
Ā 
CARE OF CHILD IN INCUBATOR..........pptx
CARE OF CHILD IN INCUBATOR..........pptxCARE OF CHILD IN INCUBATOR..........pptx
CARE OF CHILD IN INCUBATOR..........pptx
Ā 
Sanyam Choudhary Chemistry practical.pdf
Sanyam Choudhary Chemistry practical.pdfSanyam Choudhary Chemistry practical.pdf
Sanyam Choudhary Chemistry practical.pdf
Ā 
How to Make a Pirate ship Primary Education.pptx
How to Make a Pirate ship Primary Education.pptxHow to Make a Pirate ship Primary Education.pptx
How to Make a Pirate ship Primary Education.pptx
Ā 
Science lesson Moon for 4th quarter lesson
Science lesson Moon for 4th quarter lessonScience lesson Moon for 4th quarter lesson
Science lesson Moon for 4th quarter lesson
Ā 
Alper Gobel In Media Res Media Component
Alper Gobel In Media Res Media ComponentAlper Gobel In Media Res Media Component
Alper Gobel In Media Res Media Component
Ā 

Nonlinear Analysis of Electrochemical Systems Using Intermodulation Spectroscopy

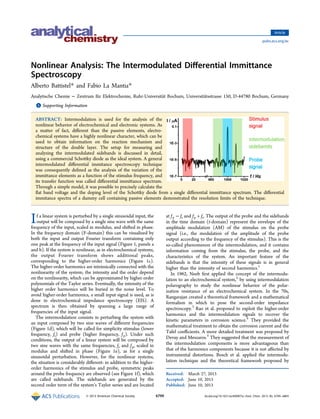
  • 1. Nonlinear Analysis: The Intermodulated Diļ¬€erential Immittance Spectroscopy Alberto Battistel* and Fabio La Mantia* Analytische Chemie āˆ’ Zentrum fuĢˆr Elektrochemie, Ruhr-UniversitaĢˆt Bochum, UniversitaĢˆtsstrasse 150, D-44780 Bochum, Germany * S Supporting Information ABSTRACT: Intermodulation is used for the analysis of the nonlinear behavior of electrochemical and electronic systems. As a matter of fact, diļ¬€erent than the passive elements, electro- chemical systems have a highly nonlinear character, which can be used to obtain information on the reaction mechanism and structure of the double layer. The setup for measuring and analyzing the intermodulated sidebands is discussed in detail, using a commercial Schottky diode as the ideal system. A general intermodulated diļ¬€erential immitance spectroscopy technique was consequently deļ¬ned as the analysis of the variation of the immittance elements as a function of the stimulus frequency, and its transfer function was called diļ¬€erential immittance spectrum. Through a simple model, it was possible to precisely calculate the ļ¬‚at band voltage and the doping level of the Schottky diode from a single diļ¬€erential immittance spectrum. The diļ¬€erential immitance spectra of a dummy cell containing passive elements demonstrated the resolution limits of the technique. If a linear system is perturbed by a single sinusoidal input, the output will be composed by a single sine wave with the same frequency of the input, scaled in modulus, and shifted in phase. In the frequency domain (F-domain) this can be visualized by both the input and output Fourier transform containing only one peak at the frequency of the input signal (Figure 1, panels a and b). If the system is nonlinear, as in electrochemical systems, the output Fourier transform shows additional peaks, corresponding to the higher-order harmonics (Figure 1c). The higher-order harmonics are intrinsically connected with the nonlinearity of the system; the intensity and the order depend on the nonlinearity, which can be approximated by higher order polynomials of the Taylor series. Eventually, the intensity of the higher order harmonics will be buried in the noise level. To avoid higher-order harmonics, a small input signal is used, as is done in electrochemical impedance spectroscopy (EIS). A spectrum is then obtained by spanning a large range of frequencies of the input signal. The intermodulation consists in perturbing the system with an input composed by two sine waves of diļ¬€erent frequencies (Figure 1d), which will be called for simplicity stimulus (lower frequency, fs) and probe (higher frequency, fp). Under such conditions, the output of a linear system will be composed by two sine waves with the same frequencies, fs and fp, scaled in modulus and shifted in phase (Figure 1e), as for a single sinusoidal perturbation. However, for the nonlinear systems, the situation is considerably diļ¬€erent: in addition to the higher- order harmonics of the stimulus and probe, symmetric peaks around the probe frequency are observed (see Figure 1f), which are called sidebands. The sidebands are generated by the second order term of the systemā€™s Taylor series and are located at fp āˆ’ fs and fp + fs. The output of the probe and the sidebands in the time domain (t-domain) represent the envelope of the amplitude modulation (AM) of the stimulus on the probe signal (i.e., the modulation of the amplitude of the probe output according to the frequency of the stimulus). This is the so-called phenomenon of the intermodulation, and it contains information coming from the stimulus, the probe, and the characteristics of the system. An important feature of the sidebands is that the intensity of these signals is in general higher than the intensity of second harmonics.1 In 1962, Neeb ļ¬rst applied the concept of the intermodu- lation to an electrochemical system,2 by using intermodulation polarography to study the nonlinear behavior of the polar- ization resistance of an electrochemical system. In the 70s, Rangarajan created a theoretical framework and a mathematical formalism in which to pose the second-order impedance spectroscopy.3 Rao et al. proposed to exploit the higher-order harmonics and the intermodulation signals to recover the kinetic parameters in corrosion science.4 They provided the mathematical treatment to obtain the corrosion current and the Tafel coeļ¬ƒcients. A more detailed treatment was proposed by Devay and Meszaros.5 They suggested that the measurement of the intermodulation components is more advantageous than that of the harmonics components because it is not aļ¬€ected by instrumental distortions. Bosch et al. applied the intermodu- lation technique and the theoretical framework proposed by Received: March 27, 2013 Accepted: June 10, 2013 Published: June 10, 2013 Article pubs.acs.org/ac Ā© 2013 American Chemical Society 6799 dx.doi.org/10.1021/ac400907q | Anal. Chem. 2013, 85, 6799āˆ’6805
  • 2. Devay, Meszaros, and Rao on a real corrosion system.1,6 They implemented the treatment, adding some considerations about the error arising from the uncompensated resistance and the double layer capacitance. So far the study of nonlinearity was restricted to the faradic reaction of the electrochemical system. AntanĢƒo-Lopez and co-workers were the ļ¬rst to apply the intermodulation technique to the study of the double layer.7 They implemented an original setup to perform the experiment and proposed a new name: the modulation of interface capacitance transfer function (MICTF) technique. The key point of this setup was to employ a lock-in ampliļ¬er to demodulate the intermodulation sidebands. Their idea was to prove that to consider the double layer capacitance as independent of the potential was an oversimpliļ¬cation. They applied their model to the study of a system with ion transfer and to the study of the interface between TiO2 and SnO2 in a dye-sensitized nanocrystalline solar cell (DSSC).8 Starting from the treatment of AntanĢƒo-Lopez and co- workers,7 this work is focused on the development of a technique for the analysis of the nonlinear behavior of electrochemical systems, using a diode as a relatively ideal nonlinear system; the diode is stable, reproducible, and the intermodulation can be predicted. In fact, the diode is equivalent to a conductance in parallel with a capacitance, which is dependent on the polarization potential. Additionally, a diode represents a fairly challenging benchmark for electrochemical instrumentation, due to its high impedance. Based on the intermodulation sidebands, we deļ¬ned a general transfer function called diļ¬€erential immittance spectrum. Results from a dummy cell containing only passive elements (linear system) were used to validate the results and to show the resolution limit of our instrumentation. ā–  THEORETICAL BACKGROUND In the intermodulated diļ¬€erential immittance spectroscopy (IDIS), the system is perturbed by an input that contains two sine waves: the probe signal at angular frequency Ī© and the stimulus signal at angular frequency Ļ‰. Following Figure 1f and removing the higher-order harmonics of the probe and stimulus, but keeping the sidebands, one can describe the output as composed by four sine waves: the probe response at frequency fp, the stimulus response at frequency fs, and the two sidebands generated by the intermodulation at frequencies fp āˆ’ fs and fp + fs. If the input is the potential and the output is the current, the admittance at the angular frequencies Ī© and Ļ‰ can be calculated at once from Ī© = Ī© Ī© Y( ) I( ) U( ) (1) Ļ‰ Ļ‰ Ļ‰ = Y( ) I( ) U( ) (2) where I and U represent the Fourier transforms of the current and potential at the angular frequencies Ī© or Ļ‰. We want to stress that the conductance, G, is equal to Re(Y), and the susceptance, B, is equal to Im(Y). From eqs 1 and 2, the diļ¬€erential conductance, dG, diļ¬€erential susceptance, dB, and diļ¬€erential admittance, dY, can be deļ¬ned in a general sense as Ļ‰ Ļ‰ Ļ‰ Ī© = Ī© G d ( , ) G ( ) U( ) (3) Ļ‰ Ļ‰ Ļ‰ Ī© = Ī© B d ( , ) B ( ) U( ) (4) Ļ‰ Ļ‰ Ļ‰ Ī© = Ī© + Ī© Y G B d ( , ) d ( , ) jd ( , ) (5) where GĪ©, BĪ©, and YĪ© are the Fourier transforms of the probe conductance, susceptance, and admittance at the stimulus angular frequency Ļ‰, respectively, and j is the imaginary unit. It has to be stressed that Re(dY) is equal to Re(dG) āˆ’ Im(dB), and Im(dY) is equal to Im(dG) + Re(dB). The conductance Figure 1. Schematic of the Fourier transform for a single (ļ¬rst row) and double input measurement (second row) on a linear (second column) and nonlinear system (third column). Ī” represents the fundamental harmonic, ā–” the higher-order harmonics, and ā—‹ the intermodulation sidebands. Analytical Chemistry Article dx.doi.org/10.1021/ac400907q | Anal. Chem. 2013, 85, 6799āˆ’6805 6800
  • 3. and susceptance can be measured in the time domain by the lock-in ampliļ¬er, as done by AntanĢƒo-Lopez and co-workers.7 However, their Fourier transform at Ļ‰ can be calculated directly from the sidebands rising from the intermodulation (see appendix A of the Supporting Information). The general term intermodulated diļ¬€erential immittance spectroscopy was used to describe both diļ¬€erential admittance and diļ¬€erential impedance. In appendix B of the Supporting Information, the treatment for the intermodulated diļ¬€erential impedance spectroscopy is reported. The diļ¬€erential conductance and the diļ¬€erential susceptance both respond to the Kramerāˆ’ Kronig relations. The equivalent circuit of a diode in reverse bias is represented by a capacitance in parallel to a conductance. The capacitance takes into account the accumulation of charge in the space charge region, and its dependence on the polarization potential is given by the Mottāˆ’Schottky equation.9 The parallel conductance represents the leakage current due to thermo-emission of electrons and movement of the holes in the valence band; the conductance is weakly dependent on the polarization potential. The stimulus aļ¬€ects the potential across the diode, and as consequence, the value of the capacitance of the diode, which is the origin of the amplitude modulation of the probe current at the stimulus frequency. The Fourier transform of the current is very similar to that depicted by Figure 1f. Following eqs 3, 4, and 5 and the equivalent circuit of the Schottky diode, dG should be negative and imaginary, and dB should be negative and real (see appendix C of the Supporting Information). Both terms are correlated to the variation of the capacitance with the potential; however, the value of dG is proportional to Ļ‰, while the value of dB is proportional to Ī©. From the Mottāˆ’Schottky analysis, it is possible to derive the ļ¬‚at band voltage and, knowing the relative permittivity Īµr, the dopant concentration of the semiconductor in the diode. The same information is obtained by the intermodulated diļ¬€erential admittance spectroscopy. We want to stress that Mottāˆ’Schottky analysis is done acquiring several EIS at diļ¬€erent potential values and plotting the reciprocal of the square of the calculated capacitance against the potential, while the diļ¬€erential admittance spectrum is obtained at a single potential. ā–  EXPERIMENTAL SECTION The Instrument. The instrument was composed by a potentiostat PG_310USB (HEKA Elektronik), a 2-channel lock-in ampliļ¬er HF2LI (Zurich Instruments), a 4-channel oscilloscope PicoScope 4424 (Pico Technology), two sine wave generators (included in the lock-in ampliļ¬er), and a personal computer equipped with Matlab. The main characteristic of the potentiostat is a wide bandwidth associated with a low noise level, so that only small distortions are introduced at high frequencies. Figure 2 shows a schematic of the instrument. Generator 1 provides the sine wave of the stimulus at frequency fs and generator 2 the sine wave of the probe at frequency fp (fp > fs); the latter was also used as a reference for the lock-in ampliļ¬er. The signals produced by the generators were summed and sent to the potentiostat, which was connected to the investigated system. The current and potential outputs of the potentiostat were sent to the ļ¬rst two channels of the oscilloscope; the current output was sent also to the lock-in ampliļ¬er, where it was demodulated according to the reference signal (the probe signal). The in-phase and out-of-phase components of the current were ampliļ¬ed and sent to the remaining two channels of the oscilloscope. The immittance and the diļ¬€erential immittance are obtained by the PC, using homemade Matlab-based software and calculating the Fourier transform of the signals recorded by the four channels of the oscilloscope. Investigated Systems. Two systems were investigated: a Schottky diode 80SQ040 (International Rectiļ¬er), as an ideal nonlinear system and a dummy cell composed by a 9.4 MĪ© resistor in parallel with a 2 nF capacitor, as an ideal linear system. Cyclic voltammetry and electrochemical impedance spectroscopy (EIS) were performed on the Schottky diode using a Zahner Zennium (Zahner) potentiostat between 0 and 2 V. A scan rate of 10 mV sāˆ’1 was used for the cyclic voltammetry. The impedance spectra were measured between 100 kHz and 100 mHz, with 10 points per decade, using a 10 mV amplitude voltage sine wave, and an impedance spectrum was recorded each 100 mV. The diode was connected to the potentiostat using the IUPAC oļ¬ƒcial setup, with the cathode attached to the working electrode and the anode to the reference and counter electrodes. For the measurement of the diļ¬€erential immittance, the probe frequency was kept constant at 1 kHz, and the stimulus frequency was scanned between 100 Hz and 100 mHz, at 10 points per decade. The amplitude of the probe and the stimulus were 20 and 40 mV, respectively. These are optimized values that provide good signal-to-noise ratios. Ten cycles of the stimulus signal were recorded with 20 points per period of the probe signal. A polarization voltage of 0.5 V was chosen for both systems. ā–  RESULTS AND DISCUSSION Cyclic Voltammetry and EIS on the Diode. Figure 3a shows the cyclic voltammogramm of the diode at a scan rate of 10 mV sāˆ’1 , performed between 0 and 2 V. This voltage window corresponds to the inverse region of the diode; its ļ¬‚at band voltage is a located at āˆ’0.53 V. The leakage current is equal to ca. 400 nA at a 0.5 V polarization voltage. In the same voltage window an impedance spectrum was recorded each 100 mV. Calculating the parallel capacitance from the imaginary part of the admittance at 100 kHz for each potential, it was possible to use the Mottāˆ’Schottky analysis to obtain the ļ¬‚at band voltage Figure 2. Schematic of the instrument setup. Generator 1 outputs the stimulus signal and generator 2 the probe signal. The potentiostat sends the potential output and the current output to the ļ¬rst two channels of the oscilloscope and current output to the input of the lock-in ampliļ¬er. The lock-in demodulates the current and sends the in-phase and out-of-phase components to the second two channels of the oscilloscope. Analytical Chemistry Article dx.doi.org/10.1021/ac400907q | Anal. Chem. 2013, 85, 6799āˆ’6805 6801
  • 4. and the dopant concentration. The Mottāˆ’Schottky analysis is based on the following equation (for n-type semiconductors): Īµ Īµ = | | āˆ’ āˆ’ | | āˆ’ āŽ› āŽ āŽœ āŽž āŽ  āŽŸ C N U U k T 1 2 e e SC 2 r 0 D E fb B (6) where CSC is the capacitance of the Schottky diode, Īµr the relative dielectric constant, Īµ0 the permittivity of vacuum, e the charge of the electron, ND the concentration of dopants, UE the polarization voltage, Ufb the ļ¬‚at band voltage, kB the Boltzmann constant, T the absolute temperature. In Figure 3b, the Mottāˆ’ Schottky plot for the diode is reported. From the linear regression, a ļ¬‚at band potential of āˆ’0.536 Ā± 0.005 V and a dopant concentration of 3.61 Ɨ 1017 Ā± 1015 cmāˆ’3 were calculated (Īµr = 11.68). The same results were achieved using lower frequencies (down to 1 kHz) and restricting the potential range from 0.2 to 2 V. Intermodulated Diļ¬€erential Immittance Spectrosco- py (IDIS) on the Schottky Diode. For measuring the diļ¬€erential immitance spectra, two conļ¬gurations are possible: the current and potential output of the potentiostat are connected to a 2-channel oscilloscope and the diļ¬€erential immittance is calculated from the Fourier transform of the current at Ī© āˆ’ Ļ‰ and Ī© + Ļ‰ (oscilloscope setup) or the current output is demodulated at angular frequency Ī© by a lock-in ampliļ¬er and the in-phase and out-of-phase components are recorded by an oscilloscope (lock-in setup). In the latter case, a 4-channel oscilloscope is necessary: potential, current, in-phase component, and out-of-phase component have to be recorded as a function of time, and the diļ¬€erential immittance is calculated from the Fourier transform of the in-phase and out- of-phase components at Ļ‰. In the next paragraph, we will discuss the oscilloscope setup and its limitations. The diļ¬€erential immittance spectra were measured at a polarization voltage of 0.5 V, using a probe frequency of 1 kHz and a stimulus frequency scanning from 100 Hz to 100 mHz, with 10 points per decade. Ten cycles of the stimulus signal and 20 points per period of the probe signal were recorded with two channels of the oscilloscope. The Fourier transform was performed on the potential at angular frequencies Ī© and Ļ‰ and on the current at angular frequencies Ī©, Ļ‰, Ī© āˆ’ Ļ‰, and Ī© + Ļ‰, using a Blackmanāˆ’Harris window function (see appendix D of the Supporting Information). The result of the Fourier transform of the current in the whole range of frequencies is reported in Figure 4b for the stimulus frequency of 10 Hz. The sidebands are located at 990 and 1010 Hz, as expected for the intermodulation eļ¬€ect. The impedance spectrum at 0.5 V can be calculated from the Fourier transform of the potential and current at Ļ‰. This is reported in the Nyquist plot of Figure 4a, together with the impedance measured previously at 0.5 V with the Zahner Zennium. The two curves are very close, thus indicating the good quality of data. The resistance measured by the IDIS is smaller because of the higher amplitude of the stimulus oscillation. By ļ¬tting the impedance spectrum with a capacitance parallel to a resistance, the values of 1.76 nF and 7.74 MĪ© are obtained. The good quality of the ļ¬tting also conļ¬rms that the data respond to the Kramerāˆ’Kronig relations. The measurement of IDIS can be aļ¬€ected by the control loop of the potentiostat and bandwidth of the current follower. First, the control loop of the potentiostat can introduce a delay and an attenuation of the applied sine wave potential at high frequencies (the probe frequency) with respect to the Figure 3. (a) Cyclic voltammetry of the diode between 0 and 2 V at 10 mV sāˆ’1 . (b) Mottāˆ’Schottky plot of the capacitance of the diode measured at 100 kHz and linear regression. Figure 4. (a) Nyquist plot of the EIS of the diode performed with a commercial instrument and that recorded with the oscilloscope setup. (b) Fourier transform of the current of the diode with a stimulus frequency of 10 Hz and a probe frequency of 1 kHz. Analytical Chemistry Article dx.doi.org/10.1021/ac400907q | Anal. Chem. 2013, 85, 6799āˆ’6805 6802
  • 5. generated one; this error is easily compensated because the real applied potential is measured. The bandwidth of the current follower also introduces a delay and an attenuation of the measured current with respect to the real current ļ¬‚owing through the system. The correction of this distortion requires the knowledge of the transfer function of the current followers. In general, the lower is the current range (the higher is the current ampliļ¬cation), the lower is the bandwidth of the current follower. In this work, rather low current ranges (10 Ī¼A) had to be used to enhance the signal of the sidebands. The transfer function of the current ampliļ¬er is obtained by means of a calibrated resistor and measuring its impedance in the frequency range from 100 kHz to 100 mHz. The normalized admittance represents the transfer function of the current follower. In Figure 5a, the diļ¬€erential conductance, dG, and the diļ¬€erential susceptance, dB, are reported in their real and imaginary part, as a function of the stimulus frequency. As expected (see appendix C of the Supporting Information), the value of dG is imaginary, negative, and increases with increasing fs, while the value of dB is real, negative, and constant with fs. In Figure 5b, the diļ¬€erential admittance, dY, is reported as a function of the stimulus frequency. dY is composed only by the imaginary part, while the real part remains mostly near 0. Im(dY) increases at higher stimulus frequencies, in accordance with the value of Im(dG) becoming larger. The diļ¬€erential susceptance for the diode is given by: Īµ Īµ = āˆ’Ī© | | āˆ’ āˆ’ | | āˆ’ āŽ› āŽ āŽœ āŽž āŽ  āŽŸ B N U U k T d 1 2 e 2 e r 0 D E fb B 3/2 (7) More details on eq 7 can be found in appendix C of the Supporting Information. Equation 7 can be used together with eq 6 for calculating the ļ¬‚at band voltage and the dopant level, with results equal to āˆ’0.535 Ā± 0.01 V and 3.92 Ɨ 1017 Ā± 8 Ɨ 1015 cmāˆ’3 , respectively. Table 1 presents a summary of the results obtained with the diļ¬€erent techniques compared with the tabulated data. They all show to be in good agreement. The advantage of using the oscilloscope setup is of course a reduction of the costs and connections required. However, care has to be taken that high resolution in the F-domain is obtained, which is achieved by long time recording; this is necessary to visualize precisely the sidebands and separate them from the sidelobes of the probe frequency, as explained in more detail in appendix D of the Supporting Information. For this reason, up to 10 cycles of the stimulus signal are acquired. Moreover, to avoid the high frequency noise, 20 points per period of the probe signal are recorded. The restriction in the ratio Ī©/Ļ‰ rises from the fact that the number of points recorded at each stimulus frequency is equal to some 200 Ī©/Ļ‰, and that due to limitations in the calculation power of the PC, ļ¬les larger than 10 million points are diļ¬ƒcult to handle. If lower frequencies have to be reached, the lock-in ampliļ¬er in combination with four low-pass ļ¬lters has to be used to demodulate the current with respect to the probe frequency. Moreover, as will be shown below, the lock-in ampliļ¬er has a slightly higher resolution and better signal-to-noise ratio, with respect to the oscilloscope and could be necessary for extremely low values of the diļ¬€erential immittance. Use of the Lock-in Ampliļ¬er for Measuring the IDIS. A lock-in ampliļ¬er can be used to measure directly the conductance and the susceptance of the system at the probe frequency. Under these conditions, additionally to the current and potential at fs, the measured conductance and susceptance can also be recorded by a 4-channels oscilloscope (lock-in setup). After the acquisition, the diļ¬€erential conductance and susceptance can be calculated from the Fourier transform of the conductance and susceptance at angular frequency, Ļ‰, respectively, as explained in the Theoretical Background by eqs 3āˆ’5. However, a lock-in ampliļ¬er may be a source of distortion in the measured diļ¬€erential immittance: ļ¬rst, the phase of the demodulator of the current has to be adjusted to avoid delays between the real current ļ¬‚owing through the system and the measured current; moreover, the lock-in ampliļ¬er tries to cut oļ¬€ the intermodulation, as it considers it as noise. The advantage of using the lock-in ampliļ¬er is that the conductance and the susceptance are directly measured and it allows exploring a larger range of stimulus frequencies because Figure 5. (a) Bode plot of the real (empty symbols) and imaginary part (solid symbols) of the diļ¬€erential conductance (ā— and ā—‹) and of the diļ¬€erential susceptance (ā–³ and ā–²). (b) Bode plot of the real (ā—‹) and imaginary part (ā—) of the diļ¬€erential admittance. Table 1. Flat Band Potential, Ufb, and Dopant Concentration, ND, of the Diode Calculated with the Diļ¬€erential Admittance Measured by the Oscilloscope Setup and the Lock-in Setup, with the Mott-Schottky (M-S) Analysis, and Reported in the Datasheet Ufb (V) ND (1017 cmāˆ’3 ) oscilloscope setup āˆ’0.535 Ā± 0.01 3.92 Ā± 0.08 lock-in setup āˆ’0.527 Ā± 0.006 3.88 Ā± 0.01 M-S analysis āˆ’0.536 Ā± 0.005 3.61 Ā± 0.01 tabulated data āˆ’0.53 not reported Analytical Chemistry Article dx.doi.org/10.1021/ac400907q | Anal. Chem. 2013, 85, 6799āˆ’6805 6803
  • 6. high frequency signals do not need to be recorded. The setup in this paper consists of a 2-channel lock-in ampliļ¬er; before starting the experiment, the software automatically forces the lock-in to detect the phase shift between the generated and the applied probe signal (the delay introduced by the control loop of the potentiostat) and then adds it to the shift in phase of the current follower (measured as in paragraph 4.2) and sets it as the phase of the demodulator. In this way, the distortion between the measured and the real current ļ¬‚owing through the system is removed, apart from a proportional factor that can be calculated later from the transfer function of the potentiostat. A lock-in ampliļ¬er is designed to demodulate the input signal with respect to a reference signal, which can be external or internal. The demodulation consists in measuring the correlation between the input and reference signal (in a mathematical sense). The correlation can be then used to calculate the in-phase and out-of-phase components of the input signal with respect to the reference signal. After the demodulation, the in-phase and out-of-phase components pass through a low-pass ļ¬lter and an ampliļ¬er. The series of the demodulation and low-pass ļ¬lter is equivalent to a band-pass ļ¬lter. Because of the low-pass ļ¬lter, the lock-in ampliļ¬er introduces a distortion to the diļ¬€erential immittance through its own transfer function. The low-pass ļ¬lter has a bandwidth that is given by the time constant of the lock-in ampliļ¬er and the order of the ļ¬lter: a long time constant and a high-order ļ¬lter attenuate all the signals away from the reference, including the intermodulation eļ¬€ect and a short time constant and a low order ļ¬lter allow demodulating the sidebands properly at expenses of high noise level. This eļ¬€ect generates a limitation on the higher stimulus frequency that can be measured: in the proposed setup, with a fourth-order ļ¬lter (24 db/octave), the upper limit in fs is equal to 0.1fp. If we name Ī”Ļ‰ the bandwidth of the lock-in in rad sāˆ’1 , the relevant parameter that controls the transfer function of the lock-in ampliļ¬er with respect to the stimulus frequency is given by Ļ‰/Ī”Ļ‰. The relation between the time constant, tC, and the bandwidth is Ļ‰ Ī” = A tC (8) where A is a constant that depends on the low-pass ļ¬lter order. The transfer function of the lock-in, H(Ļ‰/Ī”Ļ‰), was obtained from the ratio of the diļ¬€erential admittance measured from the lock-in setup and the one measured by the oscilloscope setup for the Schottky diode, recorded for diļ¬€erent values of Ī”Ļ‰ and Ļ‰/Ī”Ļ‰. In Figure 6, the measured transfer function of the lock- in ampliļ¬er is reported in the Bode representation. The experimental data (empty dots) were ļ¬tted with a fourth-order inverse polynomial (line), which was thereafter used for the proper correction. For Ļ‰/Ī”Ļ‰ = 1, the attenuation is 3 db, and the phase-shift is ca. 90 degrees. For Ļ‰/Ī”Ļ‰ > 1, H attenuates and strongly delays the intermodulation signal; however, larger frequencies are measurable. For Ļ‰/Ī”Ļ‰ < 1, H tends to unity and the phase-shift tends to 0 degrees, but frequencies near fp are not accessible. A good compromise was obtained with Ļ‰/ Ī”Ļ‰ = 0.2. The homemade software automatically sets Ī”Ļ‰ = 5Ļ‰ each time the stimulus frequency is changed. In this way, it is possible to measure dG and dB with higher precision than by using the oscilloscope setup. In Table 1, the analysis of the diļ¬€erential immitance of the diode measured with the lock-in setup, maintaining Ī”Ļ‰ = 5Ļ‰ is reported and is in very good agreement with the previous results obtained with the oscilloscope setup, with the Mottāˆ’Schottky analysis and reported in the database. The Ideal Linear System: The Dummy Cell. A dummy cell composed by passive elements is the ideal linear system. A dummy cell consisting of a 9.4 MĪ© resistor in parallel to a 2 nF capacitor was built and tested. The diļ¬€erential admittance was measured at 0.5 V potential using a probe signal of 1 kHz, having amplitude of 20 mV and a stimulus signal ranging from 100 Hz to 100 mHz, with 40 mV of amplitude. The measurement was performed with both oscilloscope setup and lock-in setup. In Figure 7a, the Fourier transform of the current signal in a large range of frequencies is reported for fs equal to 10 Hz. For comparison, the same result for the Schottky diode is reported. It can be immediately observed that, while for the Schottky diode the intermodulation sidebands are clearly visible, for the dummy cell, the intermodulation sidebands are completely buried under the noise level. The diļ¬€erential admittance of the dummy cell is a measure of the noise level of the device. In Figure 7b, the noise level of the IDIS for the oscilloscope setup and for the lock-in setup, measured though the diļ¬€erential admittance of the dummy cell, is shown. We want to stress that the noise level is very low and less than 1% of the measured value in the diode. Also, it can be observed that in the range between 1 and 10 Hz, the lock-in setup works better than the oscilloscope setup. Under these conditions, the limit of detectability of the diļ¬€erential admittance is equal to ca. 20 nS Vāˆ’1 . ā–  CONCLUSIONS The intermodulation eļ¬€ect can be used to study the nonlinearity of electrochemical and electronic systems. To measure it, it is possible to proceed with a simpliļ¬ed approach, using a 2-channel oscilloscope to record the current and the Figure 6. Bode plots of the lock-in ampliļ¬er transfer function H, experimental data (ā—‹), and fourth-order inverse polynomial ļ¬t (line): (a) absolute value and (b) phase-shift of H. Analytical Chemistry Article dx.doi.org/10.1021/ac400907q | Anal. Chem. 2013, 85, 6799āˆ’6805 6804
  • 7. potential in the system (oscilloscope setup), or measure directly the conductance and susceptance of the system by demodulat- ing the current with a lock-in ampliļ¬er and recording the signals with a 4-channel oscilloscope (lock-in setup). Both conļ¬gurations have advantages and disadvantages. The oscilloscope setup is less complicated, but a limitation rises in the maximum value of Ī©/Ļ‰ that can be explored, mainly due to the limited calculation power of the personal computer. The lock-in setup has the advantage to make lower stimulus frequencies accessible; however, it has a limited higher stimulus frequency (fs < 0.1fp) due to the correlation between the time constant of the lock-in ampliļ¬er and noise rejection. Moreover, the transfer function of the lock-in ampliļ¬er, H, has to be measured. We proposed to measure H by comparison of the diļ¬€erential immittances of a Schottky diode obtained by the lock-in setup and the oscilloscope setup in the range of stimulus frequencies that are available for both conļ¬gurations. The diļ¬€erential immittance of a diode (an ideal nonlinear system) was measured. From the data, it was possible to obtain the ļ¬‚at band voltage and the dopant concentrations, which showed good agreement with the values tabulated and obtained with classical techniques (such as the Mottāˆ’Schottky analysis). Measuring the diļ¬€erential admittance on a dummy cell composed by passive elements, it was possible to quantify the detectability limit of the setups; the error on the values of dY obtained for the diode was estimated to be less than 1%. We can foresee the importance of such a technique to study the reaction mechanism of electro-catalytic reactions, the transport and trapping of carriers in semiconductors, the electron transfer in surface-conļ¬ned species, the corrosion behavior of metals, and in other ļ¬elds. ā–  ASSOCIATED CONTENT * S Supporting Information The Supporting Information contains four appendixes: A, correlation between diļ¬€erential admittance and sidebands; B, correlation between diļ¬€erential impedance and diļ¬€erential admittance; C, diļ¬€erential admittance of the Schottky diode; and D, the window function and the sidelobes. This material is available free of charge via the Internet at http://pubs.acs.org. ā–  AUTHOR INFORMATION Corresponding Author *A.B.: e-mail, alberto.battistel@rub.de. F.L.M.: e-mail, fabio. lamantia@rub.de. Notes The authors declare no competing ļ¬nancial interest. ā–  ACKNOWLEDGMENTS The ļ¬nancial support by the Federal Ministry of Education and Research (BMBF) in the framework of the project ā€œEnergies- peicherā€ (Grant FKZ 03EK3005) and the funding of the Centre for Electrochemical Sciences (CES) by the European Commission and the state North Rhine-Westphalia (NRW) in the framework of the HighTech.NRW program are gratefully acknowledged. ā–  REFERENCES (1) Bosch, R. W.; Bogaerts, W. F. Corrosion 1996, 52 (3), 204āˆ’212. (2) Neeb, R. Naturwissenschaften 1962, 49 (19), 447āˆ’447. (3) (a) Rangarajan, S. K. J. Electroanal. Chem. Interfacial Electrochem. 1974, 56 (1), 1āˆ’25. (b) Rangarajan, S. K. J. Electroanal. Chem. Interfacial Electrochem. 1974, 56 (1), 27āˆ’53. (c) Rangarajan, S. K. J. Electroanal. Chem. Interfacial Electrochem. 1974, 55 (3), 337āˆ’361. (d) Rangarajan, S. K. J. Electroanal. Chem. Interfacial Electrochem. 1974, 55 (3), 363āˆ’374. (4) Rao, P. G.; Mishra, A. K. J. Electroanal. Chem. Interfacial Electrochem. 1977, 77 (1), 121āˆ’125. (5) Devay, J.; Meszaros, L. Acta Chim. Acad. Sci. Hung. 1980, 104, 311. (6) Bosch, R. W.; Hubrecht, J.; Bogaerts, W. F.; Syrett, B. C. Corrosion 2001, 57 (1), 60āˆ’70. (7) (a) AntanĢƒo-Lopez, R.; Keddam, M.; Takenouti, H. Electrochim. Acta 2001, 46 (24āˆ’25), 3611āˆ’3617. (b) AntanĢƒo-Lopez, R.; Keddam, M.; Takenouti, H. Corros. Eng., Sci. Technol. 2004, 39 (1), 59āˆ’64. (c) Larios-DuraĢn, E. R.; AntanĢƒo-LoĢpez, R.; Keddam, M.; Meas, Y.; Takenouti, H.; Vivier, V. Electrochim. Acta 2010, 55 (21), 6292āˆ’6298. (8) Cachet, H.; Keddam, M.; Takenouti, H.; AntanĢŒo-Lopez, R.; Stergiopoulos, T.; Falaras, P. Electrochim. Acta 2004, 49 (16), 2541āˆ’ 2549. (9) Dewald, J. F. J. Phys. Chem. Solids 1960, 14 (0), 155āˆ’161. Figure 7. (a) Fourier transform of the current of the diode (line) and of the dummy cell (ā—‹) with a stimulus frequency of 10 Hz and a probe frequency of 1 kHz. (b) Bode plot of the absolute value of the diļ¬€erential admittance measured by the oscilloscope setup (ā—‹) and the lock-in setup (line). Analytical Chemistry Article dx.doi.org/10.1021/ac400907q | Anal. Chem. 2013, 85, 6799āˆ’6805 6805