SlideShare a Scribd company logo
1 of 13
Download to read offline
Contents lists available at ScienceDirect
Tourism Management
journal homepage: www.elsevier.com/locate/tourman
Examining the relationship between tourist motivation and satisfaction by
two competing methods
Tahir Albayraka,∗
, Meltem Caberb
a
Akdeniz University, Tourism Faculty, Tourism Management Department, Campus, Antalya, Turkey
b
Akdeniz University, Tourism Faculty, Tourism Guidance Department, Campus, Antalya, Turkey
A R T I C L E I N F O
Keywords:
tourist motivation
Satisfaction
Motivation-satisfaction relationship
Rafting
A B S T R A C T
The relationship between tourist motivation and satisfaction has a long history of research, but continues to
show contrary results. Based on two surveys on tourists undertaking a rafting activity while on holiday, the
current study compares two approaches classified here as the Classic and Performance methods to clarify the
relationship between motivation and satisfaction. The results of the Classic model which assumes a direct re-
lationship between motivation and overall satisfaction show that motivation is not a significant determinant of
overall satisfaction, if it is measured before the experience. In the Performance model, post experience moti-
vation evaluation is introduced as the determinant of overall satisfaction. The results supported this proposition.
A comparison of the models also reveals that the Performance model outperforms Classic model in terms of
explaining overall satisfaction.
1. Introduction
Motivation, as an important determinant of tourist behaviour, has
been widely investigated by academics since the 1940s. Although some
researchers have attempted to explore tourism and travel motivations
of tourists, others have investigated its relationships with other con-
structs, such as destination image (e.g. Li, Cai, Lehto, & Huang, 2010),
destination loyalty (e.g. Huang & Hsu, 2009; Lee, 2010; Yoon & Uysal,
2005), destination brand personality (e.g. Murphy, Benckendorff, &
Moscardo, 2007), and destination choice (e.g. Awaritefe, 2004; Devesa,
Laguna, & Palacios, 2010). In particular, the motivation-satisfaction
relationship has been a popular research interest of many scholars,
since satisfaction has proven to have a positive influence on tourists’
post-purchase behaviour such as recommendations (e.g. Hui, Wan, &
Ho, 2007; Prebensen, Skallerud, & Chen, 2010) and intention to revisit
(e.g. Alegre & Cladera, 2009; Bigné, Andreu, & Gnoth, 2005).
However, a literature review shows that researchers have used
different approaches so far with the aim of investigating the relation-
ship between tourist motivation and satisfaction. While one group of
researchers tends to use motivation as the sole determinant of overall
satisfaction (OS), a second group of researchers prefers to employ
motivation and other variables together as the antecedents of OS. A
third group of researchers seems to use the same items belonging to
motivation for the measurement of respondents’ satisfaction. All of
these approaches assume that there is a linear relationship between
motivation and satisfaction. The review of previous literature obviously
shows that determining the appropriate method(s) for explaining the
motivation-OS relationship has become necessary today. The present
paper focuses on the first and third approaches, since we did not at-
tempt to examine any other variables (than motivation) that may have
an influence on OS. We named the first approach as the Classic, and the
third as the Performance methods. Accordingly, the first objective of
this study is to compare Classic and Performance methods in terms of
their explanatory power for OS.
Another issue with the previous studies is the measurement time of
motivation. While some researchers measure the motivation construct
before the subject activity, others measure it afterwards. To the best of
the authors’ knowledge, no published study addressed the importance
of measurement time in identifying tourist motivations (whether it
should be before or after the activity/experience). Thus, the need for a
comprehensive study arises where the effect of measurement time of
motivation on findings is particularly examined. Therefore, the second
objective of this study is to investigate how motivation measurements
before and after the activity affect research results.
For achieving the aims of the study, two separate studies were
conducted. In the first study (Study 1), both motivation and satisfaction
were assessed after the activity. In the second study (Study 2), moti-
vation was measured before the activity, while respondents’ satisfaction
was determined after the activity. Such a research design enabled the
authors to compare two methods (Classic and Performance), as well as
https://doi.org/10.1016/j.tourman.2018.06.015
Received 6 March 2017; Received in revised form 11 June 2018; Accepted 14 June 2018
∗
Corresponding author.
E-mail addresses: tahiralbayrak@akdeniz.edu.tr (T. Albayrak), meltemcaber@akdeniz.edu.tr (M. Caber).
Tourism Management 69 (2018) 201–213
0261-5177/ © 2018 Elsevier Ltd. All rights reserved.
T
to test the effect of measurement time of motivation on research find-
ings.
The paper continues with the description of the motivation and
customer satisfaction concepts. Following this, the literature that in-
vestigates the motivation-satisfaction relationship is summarised by
clustering the studies into groups. Next, two competing methods which
are derived from the literature are introduced. Then, the method of the
research is explained. After the presentation of results from Study 1 and
Study 2, the paper is concluded with a discussion of the theoretical and
practical implications in regard to the findings.
2. The concept of tourist motivation and the methods used for its
measurement
Pincus (2004) notes that motivation had been a popular research
topic in the ‘psychoanalytic studies in the 1950s and 1960s, and con-
tinued to be investigated in the era of psychophysiology (1970s and
1980s)’. However, Dann (1981) criticised the previous studies about
motivation, since this concept has been defined by ‘various allied terms,
often employed as synonyms’ and there was no consensus about its
definition. He suggested that ‘motivation tells us why an individual or
group have behaved or are about to perform an action’ (Dann, 1981).
Hence, motivations are generally considered to determine why people
behave in a certain way, and to occur when people expect service
providers to satisfy their needs (Mill & Morrison, 1998). Con-
ceptualisation of motivation clearly shows that need, expectation, and
satisfaction are closely related concepts with motivation. In particular,
satisfaction and motivation terms are often confused (Dann, 1981).
Although, satisfaction and motivation are distinct constructs, there is an
indirect relationship between them (Fluker & Turner, 2000).
A literature review by Kay (2003) shows that four main approaches
were followed by the researchers in the examination of motivation:
needs-based, values-based, benefits sought or realised, and expectancy
theory. The needs-based approach suggests that a wide variety of needs
motivate behaviour. The best-known examples of this school are
Maslow's (1943; 1970) hierarchical needs theory, Murray's (1938)
classification of needs theory, and McClelland's (1955) theory of
learned needs. A values-based approach attempts to clarify motivations
through the investigation and measurement of personal values. That
approach enables researchers to predict the influence of personal values
on motivation or behaviour, and to make market segmentations. A
‘benefits sought or realised’ approach considers an association between
motivations and sought benefits from a purchase decision. These ben-
efits may be attribute-based (e.g. tangible attributes of a destination),
psychologically-based (e.g. emotional benefits expected from the ser-
vice), or a combination of both. Expectancy theory, which is formulated
in the work motivation context (Vroom, 1964), has been adapted to
tourist motivation research. According to this approach, ‘people's mo-
tivation to perform an activity is a function of the expectation that they
will be able to perform the activity and obtain the desired outcomes,
and the personal value of all outcomes associated with that activity’
(Hsu, Cai, & Li, 2010). Such a perspective enables the researchers to
clarify which motivations related to values and expectations affect
tourists' travel decisions and satisfaction.
In addition to the above-mentioned approaches, the pull-push fra-
mework (Dann, 1977) has been one of the most popular methods for
identifying tourist motivations. In this theory, people are assumed to
travel while they are ‘pushed by their own internal forces (push/in-
trinsic factors), and pulled by the external forces of destination attri-
butes (pull/extrinsic factors)’ (Khuong & Ha, 2014). In the tourism
motivation studies that adapt a pull-push framework, ‘demand refers to
motives (push factors) that sustain tourists’ desire, while supply relates
to destination's characteristics (pull factors)’ (Mohammad & Som,
2010). Similarly, Iso-Ahola's (1982) motivational theory, which is
known as Optimal Arousal Theory, suggests that people ‘seek’ activities
that provide novel experiences and psychological rewards (internal/
seeking factors), allowing them to ‘escape’ from personal problems in
their interpersonal world (external/escaping factors). This theory pro-
poses a multi-motive approach, since both seeking and escaping moti-
vations have personal and interpersonal components (Biswas, 2008).
Iso-Ahola also suggested linking the internal factors to potential sa-
tisfaction (Wolfe & Hsu, 2004).
In the tourism and travel literature, tourist motivations are seen as
determinants of tourist activities in respect of (i) the reasons for tra-
velling, (ii) why a specific destination is selected, (iii) and the overall
satisfaction with the trip (Castaňo, Moreno, García, & Crego, 2003).
Herewith, tourist motivation measurement is seen as the key to sa-
tisfying current visitors, to attracting more visitors, to predicting future
demand, and to developing products to meet tourists' needs (Wolfe &
Hsu, 2004). However, Bright (2008) notes that tourist motivation is an
extremely complex area of research within the context of psychological
theories. For this reason, theories of tourist motivation should be dy-
namic and flexible across situations and tourists’ individual circum-
stances (Pearce, 1993).
3. The concept of satisfaction and the methods used for its
measurement
Similar to the definition of motivation, there is no consensus re-
garding the definition of satisfaction. Tian-Cole and Cromption (2003)
noted two approaches in the conceptualisation of satisfaction, where
the first is needs-based, and the second is appraisal-based. According to
the needs-based definition, suggesting a close relationship between
motivation and satisfaction, satisfaction ‘results from corresponding
needs or motives being met’ (Tian-Cole & Cromption, 2003). This ap-
proach emphasises satisfaction as a static state of fulfilment of needs or
motives. For example, researchers (e.g. Herzberg, 1968) who suggest
that employees' satisfaction is highest when job structures and duties
are consistent with their personality needs, conceptualise job satisfac-
tion as a need fulfilment (Hurlbert, 1991).
In contrast, the appraisal approach does not consider motivation-
satisfaction relationships. In this perspective, satisfaction has long been
seen as ‘a comparison process between the expected and perceived
experiences derived from participation in activities’ (Bultena & Klessig,
1969). This perspective gave inspiration to the expectancy-dis-
confirmation paradigm (Oliver, 1980), in which satisfaction or dis-
satisfaction has been measured by positive (confirmation: satisfaction)
or negative (disconfirmation: dissatisfaction) gaps between expectancy
and outcome levels. This approach suggests that satisfaction is a psy-
chological outcome of a process where tourists compare their ex-
pectations to their experiences or perceived benefits. Therefore, sa-
tisfaction is described by the followers of appraisal theories as ‘an
emotion resulting from appraisals (including disconfirmation, per-
ceived performance, etc.) of a set of experiences’ (Babin & Griffin,
1998).
Researchers have proposed several satisfaction theories (Oh &
Parks, 1997), whereas Oliver (1980; 1981), and LaTour and Peat (1979)
played leading roles in early literature (Woodruff, Cadotte, & Jenkins,
1983). One of these theories is Oliver's (1980) expectancy-dis-
confirmation paradigm, as previously mentioned. Equity theory, which
concerns people's sense of fairness, represents satisfaction as the ‘trade-
off between what the customers sacrifice and what they obtain’ (Oliver
& Swan, 1989). Attribution theory indicates a consideration of the
locus. Other relevant theories are assimilation or cognitive dissonance,
contrast, assimilation-contrast, comparison-level, generalised nega-
tivity, and value-precept (Pizam & Ellis, 1999).
In accordance with these theories, satisfaction construct can be
conceptualised within both cognitive and emotional perspectives.
While the cognitive perspective considers satisfaction as a post-ex-
perience evaluation (which includes the antecedents of expectations,
performance, disconfirmation, attribution, and equity/inequity)
(Bowen & Clarke, 2002), the emotional perspective considers it as a
T. Albayrak, M. Caber Tourism Management 69 (2018) 201–213
202
Table
1
Previous
studies
about
motivation
satisfaction
relationship.
Authors
Study
context
Highlights
Variance
explained
(%)
Data
Collection
Phase
Classification
in
this
paper
Battour
et
al.
(2012)
Examines
the
mediating
effect
of
overall
tourist
satisfaction
between
travel
motivations
(push
and
pull)
and
destination
loyalty
of
Muslim
tourists
visiting
Malaysia
Push
and
pull
factors
were
significant
predictors
of
OS
44
During
the
vacation
Motivation
as
the
sole
determinant
of
OS
Lee
and
Hsu
(2013)
Examines
the
causal
relationship
between
motivation,
satisfaction
and
loyalty
among
Taiwanese
tourists
attending
aboriginal
festivals
All
motivation
factors
were
significant
predictors
of
OS
38
and
43
After
the
festivals
Motivation
as
the
sole
determinant
of
OS
Qiao,
Chen,
Guan,
and
Kim
(2008)
Identification
of
the
Chinese
tourists'
motivations,
satisfaction
and
the
determinants
of
thier
revisit
intentions
to
Korea
Push
and
pull
factors
were
significant
predictors
of
OS
43.3
and
40.8
After
the
vacation
Motivation
as
the
sole
determinant
of
OS
Lee
et
al.
(2014)
Investigates
the
relationship
between
volunteer
motivation
and
support
for
the
Expo
2012
Korea
through
mediating
effects
of
satisfaction
and
attitudes
toward
volunteering.
2
out
of
5
motivation
factors
were
significant
predictors
of
OS
35.5
During
event
Motivation
as
the
sole
determinant
of
OS
Schofield
and
Thompson
(2007)
Investigates
the
motivations,
satisfactions,
and
intentions
to
revisit
of
domestic
and
international
visitors
at
2005
Naadam
Festival
in
Mongolia.
3
out
of
5
motivation
factors
were
significant
predictors
of
OS
24.1
During
the
festival
Motivation
as
the
sole
determinant
of
OS
Yoon
and
Uysal
(2005)
Examines
the
relationships
among
the
push
and
pull
motivations,
satisfaction,
and
destination
loyalty
of
tourists
in
Northern
Cyprus
While
pull
motivations
affect
OS,
push
motivations
do
not
influence
12
During
the
vacation
Motivation
as
the
sole
determinant
of
OS
Pan
and
Ryan
(2007)
Identifies
the
visit
patterns,
motivations,
expectation
of
and
satisfaction
with
destination
attributes,
overall
satisfaction,
intent
to
revisit
and
recommendation
of
the
visitors
in
Pirongia
Forest
Park
in
New
Zealand.
Three
separate
regression
analyses.
1
out
of
5
push
motivation
factors;
1
out
of
2
pull
motivation
factors;
2
out
of
7
motivation
factors
influenced
OS
12,
13,
and
16
After
the
visit
Motivation
as
the
sole
determinant
of
OS
Prebensen
et
al.
(2010)
Investigates
the
causal
relationships
between
travel
motivations,
satisfaction,
and
intention
to
communicate
with
others
by
word-of-
mouth
(WOM)
of
charter
tourists
from
Norway
2
out
of
4
motivation
factors
were
significant
predictors
of
OS
4
After
the
vacation
Motivation
as
the
sole
determinant
of
OS
Savinovic
et
al.
(2012)
Examines
the
relationships
among
motivation,
satisfaction,
and
re-
visit
intentions
of
the
audience
members
at
the
2009
Festa–Croatian
Food
and
Wine
Festival
in
Adelaide,
Southˆ
Australia
2
out
of
8
motivation
factors
were
significant
predictors
of
OS
5.8
During
the
festival
Motivation
as
the
sole
determinant
of
OS
Caber
and
Albayrak
(2016)
Identifies
the
motivations
of
rock
climbing
tourists
in
Antalya,
Turkey
and
investigation
of
the
relationship
between
motivation
and
overall
satisfaction
Two
separate
regression
analyses.
2
out
of
6
push
motivation
factors;
4
out
of
5
pull
motivation
factors
influenced
OS
9.2
and
16.8
During
the
activity
Motivation
as
the
sole
determinant
of
OS
Tang
(2014)
Investigates
the
relationships
between
travel
motivation,
destination
image
and
OS
of
international
tourists
visiting
Sichuan
province
after
the
Wenchuan
earthquake
of
2008.
Overall
travel
motivation
which
consist
of
4
dimensions
affects
OS
n.r.
During
the
visit
Motivation
and
additional
variables
as
the
determinant
of
OS
Meng
et
al.
(2008)
Investigates
the
relationship
between
destination
attribute
importance
and
performance,
travel
motivation,
and
satisfaction
of
visitors
at
a
nature-based
resort
destination
located
in
Southwest
Virginia,
USA
Out
of
4
motivation,
4
performance,
4
importance
factors;
1
motivation,
2
performance,
1
importance
factors
were
significant
predictors
of
OS
30.1
During
the
vacation
Motivation
and
additional
variables
as
the
determinant
of
OS
Huang
et
al.
(2014)
Examines
the
relationships
between
motivation,
performance
evaluation,
satisfaction,
and
behavioural
intentions
of
tourists
at
‘Impressions
of
Liusanjie’
theatrical
performance
in
China
Motivation
does
not
directly
influence
satisfaction.
Motivation
only
affects
tourists'
satisfaction
indirectly,
via
experiential
evaluation
and
attribute
evaluation.
No
direct
influence
After
the
experience
Motivation
and
additional
variables
as
the
determinant
of
OS
Ross
and
Iso-Ahola
(1991)
Identifies
daily
tour
participants'
motivations
and
satisfaction,
visiting
Washington
They
only
report
mean
scores
of
motivation
and
satisfaction
dimensions.
n.a.
Motivation
before,
satisfaction
after
the
tour
Usage
of
motivation
items
for
measuring
satisfaction
Thomas
and
Butts
(1998)
Evaluates
the
leisure
motivations
and
satisfactions
of
International
Elderhostel
participants
on
a
trip
to
Budapest,
Hungary
They
only
report
mean
scores
of
motivation
and
satisfaction
dimensions.
n.a.
During
the
visit
Usage
of
motivation
items
for
measuring
satisfaction
Severt
et
al.
(2007)
Assesses
convention
attendee
motivations,
performance
evaluation,
satisfaction,
and
behavioural
intentions
in
a
conference
at
United
States
9
motivation
items
were
used
to
measure
conference
performance.
2
performance
factors
related
to
motivation
were
significant
predictors
of
OS.
45
During
the
conference
Usage
of
motivation
items
for
measuring
satisfaction
(continued
on
next
page)
T. Albayrak, M. Caber Tourism Management 69 (2018) 201–213
203
response derived from an experience (del Bosque & San Martín, 2008).
Some researchers consider satisfaction to be a subjective concept in
relation to expectations, but objective in relation to product attributes
or outcomes (Pizam & Ellis, 1999). A few researchers assume that sa-
tisfaction is subjective in both the expectation and perception stages,
and therefore is a totally psychological concept (Pizam & Ellis, 1999). In
the recent cognitive-emotional perspective, satisfaction is ‘regarded as a
multidimensional construct that contains both psychological and emo-
tional factors’ (Correia, Kozak, & Ferradeira, 2013).
In general, two different approaches for the measurement of sa-
tisfaction are observed in the literature. The first one is unidimensional,
and the other is a multidimensional method. Researchers who adopt a
unidimensional framework generally use single or a few numbers of
items for identifying overall satisfaction (mostly by reflecting ‘very
satisfied’ to ‘very dissatisfied’ options). In this framework, overall sa-
tisfaction reflects the cumulative experience of tourists that is generated
by the weight of various attributes (Pizam, Neuman, & Reichel, 1978).
In particular, researchers increasingly began to use multi-attribute
methods in recent years which enable them to evaluate product or
service attributes by relying on their impacts on overall satisfaction. In
addition, an attribute-based approach enables researchers to consider
customers' mixed feelings towards a product or a service (Mittal, Ross,
& Baldasare, 1998). Because a customer can be both satisfied and dis-
satisfied with different aspects of the same product (Vargo, Nagao, He,
& Morgan, 2007).
4. The causal relationship between tourist motivation and
satisfaction
By following the needs-based approach, the motivation variable has
been employed as the direct antecedent of tourist satisfaction by a
number of researchers in tourism and travel literature (e.g. Battour,
Battor, & Ismail, 2012; Lee & Hsu, 2013). These studies may be cate-
gorized into three major groups. In the first group of studies, tourist
motivation was used as the sole determinant of tourist satisfaction by
the researchers. In the second group of studies, researchers used nu-
merous variables that may affect satisfaction, in addition to motivation,
for clarifying the motivation-satisfaction relationship. In the last group,
researchers used the same items for measuring both motivation and
satisfaction of the respondents. Table 1 summarises previous studies
based on this categorisation.
4.1. Motivation as the sole determinant of overall satisfaction
In the first group of studies, many researchers found a direct and
significant relationship between tourist motivation and overall sa-
tisfaction (OS). For example, Battour et al. (2012), who conducted a
survey on Muslim tourists visiting Malaysia, highlighted that tourist
motivation significantly affects OS. Their results showed that pull and
push motivation factors explained 44% of the variation in OS. Lee and
Hsu's (2013) study, conducted at two aboriginal festivals in Taiwan,
confirms this relationship. The explained ratios of satisfaction by mo-
tivation were 38% and 43% for these festivals, respectively. Another
high explanation ratio of customer satisfaction by motivation was found
in Qiao, Chen, Guan, and Kim's (2008) study which focused on Chinese
tourists' motivations to visit South Korea. Two separate regression
analyses showed that while 43.3% of OS was explained by five push
motivation factors, the ratio was 40.8% for four pull motivation factors.
Although these authors aimed to measure tourists' travel motivations,
their study data were collected at the airport while participants were
leaving South Korea. In another study, Lee, Reisinger, Kim, and Yoon
(2014) – after identifying the volunteer motivation in Expo 2012 Korea
– examined the relationships amongst motivation, satisfaction, and
participants' attitudes towards volunteering by using a research model.
Their findings showed that altruism, patriotism, extrinsic and intrinsic
factors were the dimensions of motivation to volunteer in that mega-
Table
1
(continued)
Authors
Study
context
Highlights
Variance
explained
(%)
Data
Collection
Phase
Classification
in
this
paper
Kao
et
al.
(2008)
Explores
the
motivations
and
satisfactions
of
Taiwanese
visitors
to
Australia
by
using
push
and
pull
framework
They
compared
the
motivations
and
satisfactions
(related
to
motivations)
of
the
respondents.
n.a.
Motivation
before,
satisfaction
after
the
visit
Usage
of
motivation
items
for
measuring
satisfaction
Fluker
and
Turner
(2000)
Compares
the
needs,
motivations,
and
expectations
of
the
experienced
and
non-experienced
rafting
participants
Same
motivation
items
were
used
in
the
past
tense
after
the
activity
to
find
out
whether
the
respondents'
expectations
had
been
met
or
not.
n.a.
Motivation
before,
satisfaction
after
the
experience
Usage
of
motivation
items
for
measuring
satisfaction
Correia,
Kozak,
and
Ferredeira
(2013)
Explores
the
concept
of
push
and
pull
satisfaction
and
relates
it
with
OS
by
using
tourists
visiting
Lisbon
Same
motivation
items
were
used
for
measuring
satisfaction.
3
satisfaction
factors
related
to
motivation
were
significant
predictors
of
OS
n.r.
After
the
visit
Usage
of
motivation
items
for
measuring
satisfaction
n.a.:
not
applicable;
n.r.:
not
reported.
T. Albayrak, M. Caber Tourism Management 69 (2018) 201–213
204
event. However, out of four motivation factors, only patriotism and
intrinsic motivation had a significant impact on satisfaction, explaining
35.5% of this construct. In the sample from Mongolia, Schofield and
Thompson (2007) investigated festival attendants' motivations. The
results showed that only three factors out of five (sport attractions,
exploration of culture, and local activities) had significant influences
and explained 24% of OS.
Contrary to the above-mentioned studies that found a strong re-
lationship between tourist motivation and OS, a number of studies re-
vealed a weak relationship between these variables. For example, Yoon
and Uysal (2005) who investigated the impact of the pull and push
motivations of 148 tourists visiting Northern Cyprus, both on satisfac-
tion and loyalty, found that visitors' motivation explained 12% of the
variance in tourist satisfaction. Interestingly, while tourist satisfaction
was negatively affected by pull motivations, the data did not support
the effect of push motivations. In another study, Pan and Ryan (2007)
measured the motivations of 205 tourists visiting a forest park in New
Zealand by using a push and pull motivation framework, and examined
the impact of motivational factors on OS with three separate regression
analyses. In the first regression model, which explains 12% of OS, only
‘relaxation’ out of the five push motivation factors was found to have a
statistically significant impact. In the second model, the authors used
two pull motivation factors as the determinant of OS. While ‘infra-
structure’ was found to be the sole significant predictor of OS, the
model explained 13% of OS. The authors used both push and pull
motivation factors in the third regression model which explained only
16% of OS.
In the case of the Norway sample, Prebensen et al. (2010) in-
vestigated tourist motivation to visit sun and sand destinations, and its
effect on satisfaction. They conceptualised motivation as a body and
mind related construct. Their study findings showed that two mind-
related motivations (i.e. escapism, or culture and nature) were the
antecedents of OS by explaining 4% of this variable. In contrast, body-
related motivations (i.e. sun and warmth, or fitness and health) did not
have any significant impact on OS. In the context of an ethnic minority
cultural festival, Savinovic, Kim, and Long (2012) obtained similar
findings to Prebensen et al. (2010) regarding the effect of motivation on
satisfaction. Their results indicated that only 5.8% of the total variance
for the estimation of festival visitors' OS was explained by two out of
eight motivation factors (‘knowledge and education’ and ‘family to-
getherness’). In a recent study, by using pull and push motivation fac-
tors, Caber and Albayrak (2016) also obtained low explained variance
for OS. Two separate regression analyses results revealed that 9.2% and
16.8% of OS were explained by push and pull motivation factors, re-
spectively.
The common characteristics of the first group of studies are (i) using
motivation as the sole determinant of OS, and (ii) collecting data either
during or after the activity (see Table 1). However, most of such studies
fail to explain the direct effect of motivation on OS, since they obtained
very low explained variance ratios for OS as mentioned above.
Schofield and Thompson (2007) explain the reason for obtaining low
explanation ratios in terms of the indirect relation between motivations
and OS. In other words, as Huang, Luo, Ding, and Scott (2014) noted,
motivations influence product evaluations, which in turn affect OS.
4.2. Motivation and additional variables as the determinants of OS
To shed light on the basis of customer satisfaction, the second group
of researchers have used motivation and some additional variables in
their research models. For example, Tang (2014) examined the re-
lationships among tourist motivation, destination image, and satisfac-
tion after the 2008 Sichuan, China earthquake. Results showed that
tourist motivation was influenced both by positive and negative images
of the destination. In addition, tourist motivation and positive/negative
images were identified as the significant predictors of tourist satisfac-
tion.
However, apart from Tang (2014), researchers in this group could
not find a relationship between motivation and satisfaction. For ex-
ample, Meng, Tepanon, and Uysal (2008) proposed that overall tourist
satisfaction was a function of destination attributes’ importance, their
performance, and tourist motivation. They conducted regression ana-
lysis for examining this hypothesis by using four importance, four
performance, and four motivation factors as the independent variables,
and customer satisfaction as the dependent variable. Their findings
showed that out of 12 determinants, only two performance factors, one
importance factor, and one motivation factor significantly associated
with customer satisfaction. However, the significance level of the mo-
tivation factor was 0.096. Thus, it can be concluded that the motivation
factors were not predictors of customer satisfaction, since that sig-
nificance value - which is above 0.05 – is not considered acceptable by
most researchers. In a recent study in China, Huang et al. (2014) in-
vestigated the relationships amongst motivation, experimental evalua-
tion, attribute evaluation, satisfaction, and behavioural intention, using
a structured model. They found that motivation had no direct, but an
indirect and significant impact on satisfaction via experimental eva-
luation, and attribute evaluation.
4.3. Usage of motivation items for measuring attribute-level satisfaction
The third group of researchers attempted to explain the motivation-
satisfaction relationship by using the same motivation items for asses-
sing respondents' satisfaction with the experience (e.g. Ross & Iso-
Ahola, 1991; Thomas & Butts, 1998). For example, Thomas and Butts
(1998) evaluated the leisure motivations and satisfaction levels of in-
ternational Elderhostel tourists. In the first stage, leisure motivations of
the participants were measured before the experience by using a leisure
motivation scale. After the experience, interestingly, the researchers
used the same motivation items for assessing participants' satisfaction.
Similarly, Severt, Wang, Chen, and Breiter (2007) measured congress
attendants' performance perceptions with nine items selected from 20
motivation items. Then, by using factor analysis with these nine per-
formance items, they obtained ‘educational benefits’ and ‘activities and
opportunities’ as the underlying dimensions of the attendees' evaluation
of the conference performance. Finally, the influence of these dimen-
sions on attendants' OS was examined by a research model.
Another interesting approach was used by Kao, Patterson, Scott, and
Li (2008), who investigated the motivation and satisfaction of Taiwa-
nese tourists visiting Australia. The researchers measured participants'
motivation before their arrivals to Australia by using the pull-push
motivation framework. Then, during the return flight, participants were
requested to state their satisfaction by answering the same items that
were already used for the measurement of motivation. By using parti-
cipants’ motivation means as the importance levels, and their satisfac-
tion means as the performance levels, the researchers conducted an
importance-performance analysis.
By using the SERVQUAL Model, Fluker and Turner (2000) aimed to
explore whether the needs, motivations, and expectations of the ex-
perienced and inexperienced rafting participants were met after the
activity. With this purpose, the researchers measured participants'
motivation before the experience as the expectation variable. After the
experience, they measured the same participants’ perceptions about the
experience by using the same motivation items in the past tense. Re-
cently, Correia et al. (2013) measured the push and pull motivations
and satisfaction of 400 tourists visiting Lisbon by using the same items.
Then, they investigated the effect of push and pull satisfaction factors
on OS by using a structural equation model. Their results showed that
all factors were significant predictors of OS. One interesting result in
their study was that tourist motivation and satisfaction, which were
measured simultaneously after the visit, were found to be significantly
correlated at a 0.01 level. To summarise, in some previous studies,
items that were used for the measurement of motivation were also
employed for clarifying the satisfaction of the respondents.
T. Albayrak, M. Caber Tourism Management 69 (2018) 201–213
205
5. Competing methods for the examination of motivation-
satisfaction relationship
The current study, which aims to better understand the relationship
between motivation and satisfaction, compares two competing
methods, namely the Classic and the Performance Methods. These
methods are explained below, respectively.
Classic Method suggests a direct relationship between motivation
and satisfaction (see Fig. 1). According to this method, motivations of
tourists through an activity (M) directly influence their overall sa-
tisfactions (OS).
This method can be depicted as:
OS = f (M)
Performance Method assumes that the post-experience motivation
evaluation (PostME) of tourists about an activity determines overall
satisfaction (see Fig. 2).
This method can be written as:
OS = f (PostME)
6. Method
6.1. Research setting
For achieving the objectives of the research, data were collected
from tourists who took a daily rafting tour in Köprülü Canyon in
Antalya, Turkey. Köprülü Canyon became a National Park in 1973, and
has almost 36,614 ha of forest area. Along its valley, which is 14 km
long and 100 m high, visitors join the rafting tours organised by local
travel agencies. It is estimated that almost 7000 people in a day come to
the Canyon in the summer season, mainly for rafting. The majority of
the international tourists who raft in Köprülü Canyon are from the
Russian Federation and Germany. This National Park was selected as a
suitable area for carrying out a comparative study as the interviewers
were able to reach tourists at the starting (before the experience) and
finishing points (after the experience) of the rafting tours.
6.2. Research design
Since motivation is a psychological need or desire that stimulates a
person's behaviour (Dann, 1981), it should intrinsically be measured
before the experience. However, it is sometimes difficult to reach
people before their experiences. Thus, most researchers (see Table 1)
have measured respondents' motivations during or after the activities.
In order to assess how the measurement time of motivation affects the
obtained results, in the present research, two separate studies were
performed. In the first study, both the motivations and the post-ex-
perience motivation evaluations of the respondents were measured si-
multaneously after the experience. In the second study, while re-
spondents' motivations were measured before the experience, post-
experience motivation evaluations were identified after the experience.
By using data obtained from both studies, we were able to separately
test two competing methods (which are explained in the previous
section) and compare their capacities to explain overall satisfaction.
Fig. 3 reflects the research design used in this study.
6.3. Measures
The respondents' rafting participation motivations were identified
using a shorter form of Beard and Ragheb's (1983) Leisure Motivation
Scale which consists of 32 items. This scale was selected for several
reasons. First, rafting participants had limited time to complete the
questionnaire. Second, this scale is widely used, and its validity in
identifying participant motivations has already been confirmed by re-
searchers in various research settings, such as long-distance nature
trekking (den Breejen, 2007), natural park visits (Pan & Ryan, 2007),
holidays (Mohsin, 2008), sports (Yusof, Omar-Fauzee, Shah, & Geok,
2009), and adventure activities (Inui, Lankford, & Lankford, 2004).
Third, it has high validity and reliability in exploring tourist motiva-
tions (Ryan & Glendon, 1998).
To measure the post-experience motivation evaluations of the par-
ticipants, motivation items were structured in the past tense, as Fluker
and Turner (2000) did in their study. For example, motivation item of
‘to explore new ideas’ was changed into ‘I explored new ideas’. In ad-
dition, three items that measured participants' overall satisfaction with
rafting activity were derived from Wu and Liang's (2011) study.
Participants' motivation, post-experience motivation evaluations,
and overall satisfaction were measured with a 7-point Likert-type scale
(1: completely disagree, 7: completely agree). The original English
scales were translated into German by a professional translator.
Translation equivalence was established by another translator's back
translation of the items into English from German, and by the com-
parison of items with their originals. Since Germany is the major market
for Antalya in terms of international tourist arrivals, the target sample
of this study was German tourists. Selection of one nationality as the
sample also enabled the authors to avoid any equivalence problems that
may occur in case of using cross-national data. After the translations,
three questionnaires were designed to collect data in Study 1 and Study
2. Questionnaire 1 comprises motivation, post-experience motivation
evaluation, overall satisfaction items, and six demographic questions.
Questionnaire 2 includes motivation items and demographic questions.
Questionnaire 3 consists of post-experience motivation evaluation and
overall satisfaction items.
Before the data collection in both studies, a pilot study was con-
ducted with the participation of 40 tourists in order to test the appro-
priateness, and applicability of the research instruments. Based on the
pilot study results, some items were modified, and the questionnaires
were made ready for the data collection phase.
7. Study 1
7.1. Research design
In the first study, respondents’ motivations, post-experience moti-
vation evaluations, and overall satisfaction were measured simulta-
neously after the rafting activity by using Questionnaire 1, which
contains all of these variables.
The reason for measuring motivations after the activity was to in-
vestigate the effect of measurement time of motivations on the results.
With this purpose, the results of Study 1 (whereas motivations were
measured afterwards) and Study 2 (whereas motivations were mea-
sured beforehand) were planned to be compared to each other.
7.2. Data collection procedure
To collect empirical data for the Study 1, a convenience sampling
method was used with the support of five local travel agencies. The
manager of each company was informed about the aim of the research
and data collection process. After the authors got approval from the
Fig. 1. Classic method.
Fig. 2. Performance method.
T. Albayrak, M. Caber Tourism Management 69 (2018) 201–213
206
companies, Study 1 was performed in the period from 15th August to
15th October 2015.
While tourists were having lunch after the experience at a restaurant
in the area, two graduate students, who received training regarding the
data collection, approached, and explained the aim of the research to
them. Volunteer German tourists were requested to participate to the
study. Although 349 questionnaires were collected in total, after the
elimination of incomplete forms, 319 questionnaires remained, which
were analysed by SPSS 18.0 and LISREL 8.80.
7.3. Sample characteristics
Participants’ demographic characteristics are shown in Table 2.
Results indicated that the majority of the respondents were married
(55.4%) males (56.7%) who had a high school level education (48.4%).
Many of the participants were working as company employees (33.0%)
or were retired people (32.1%). Surprisingly, 40.3% of the sample
consisted of people aged 53 and above. They preferred to raft mostly
with their friends (38.9%) and family members (37.2%). Moreover,
73.7% of the participants had no previous experience in rafting.
7.4. Results of study 1
First, with the purpose of obtaining the underlying dimensions of
rafting motivation, 32 motivation items were factor analysed using
principal component analysis with varimax rotation. Items with cross
loadings or low communalities were dropped. Moreover, items that had
below 0.707 (square root of 0.5) factor loadings were eliminated to
ensure construct validity (Shimp & Sharma, 1987). This reduced the
original number of 32 motivation items to 13. By using these items, four
Fig. 3. Research Design.
M: motivation; PostME: post-experience motivation evaluation; OS: overall satisfaction.
Table 2
Sample characteristics of study 1 (N = 319).
Characteristics %
Gender Male 56.7
Female 43.3
Marital status Married 55.4
Single 44.6
Occupation Company employee 33.0
Public services 6.6
Student 7.9
Employer 6.3
Retired 32.1
Other 14.1
Age Below than 18 1.0
Between 18 and 34 years 35.8
Between 35 and 52 years 22.9
53 and above 40.3
Education level Secondary school and below 17.4
High school 48.4
University 22.2
Other 4.1
Companion Family member(s) 37.2
Friend(s) 38.9
Relative(s) 5.7
Alone 18.1
Previous experience Yes 26.3
No 73.7
T. Albayrak, M. Caber Tourism Management 69 (2018) 201–213
207
factors were obtained, which explained 74.46% of the variance in
motivation. The factors were named according to the items that they
contained. The eigenvalues ranged from 3.41 to 1.65. The internal
consistency of the factors was evaluated by using Cronbach's alpha, and
all met the cut off value of 0.70, ranging from 0.775 to 0.881 (see
Table 3). In addition to factor analysis results, Table 3 presents the
mean values belonging to motivation items (M).
To compare the competing methods, structural equation modelling
was employed. Two research models were constructed one for evalu-
ating classic method and other for performance method by using the
same factorial structure obtained from principal component analysis.
While in the first model motivation dimensions were used as the de-
terminant of OS, in the second model post-experience motivation eva-
luation dimensions were used. The research models were separately
tested using a two stage analysis, as suggested by Anderson and Gerbing
(1988). First, the measurement model was developed by conducting a
confirmatory factor analysis (CFA) to validate the constructs. While the
initial goodness-of-fit indices were not acceptable, adding a covariance
between “relax physically” and “relax mentally” error terms which is
suggested by modification indices allowed to obtain a better model fit.
Since both items contain the word “relax”, they might have similar
error in their measurement. The modified goodness-of-fit indices of the
CFA for both classic (χ2
= 213.37, df = 93, GFI = 0.93,
RMSEA = 0.070, NFI = 0.95, and CFI = 0.97) and performance
(χ2
= 220.22, df = 93, GFI = 0.92, RMSEA = 0.064, NFI = 0.95, and
CFI = 0.97) models were satisfactory (Iacobucci, 2010). For both
models, composite reliability, convergent and discriminant validity of
the constructs are displayed in Appendix 1.
Second, the structural equation paths were estimated to test the
research models. The structural models displayed a good fit with the
data, compared with the suggested fit criteria (for classic model:
χ2
= 213.37, df = 93, GFI = 0.92, RMSEA = 0.064, NFI = 0.95, and
CFI = 0.97; for performance model: χ2
= 220.22, df = 93, GFI = 0.92,
RMSEA = 0.066, NFI = 0.95, and CFI = 0.97). In addition, classic and
performance models were compared with their nested models.
Exogenous variables were removed respectively from the full model
(i.e. research model) in order to build a series of nested models. χ2/df
and RMSEA indices clearly show that full models are the best fitted
models. Appendix 2 presents the comparisons of the nested models.
Table 4 shows beta values of the exogenous variables and explained
variance of the endogenous variable (OS), as well as the means of
exogenous variables for both models. Classic model results indicate that
three motivation factors are positively related, and one factor is
negatively related to OS, explaining 39% of the variance. As depicted in
Table 4, for the performance model, three out of four predictors have
direct effect on OS by explaining 37% of the variability.
As both Classic and Performance models explain almost equal var-
iation in customer satisfaction, the relationships between the in-
dependent variables in both models were investigated. As shown in
Table 5, all calculated correlation coefficients are significant, and vary
between 0.259 and 0.508. These coefficients show a strong relationship
(as suggested by Hair, Anderson, Tatham, & Black, 1998) between
motivation (M) and post-experience motivation evaluations (PostME),
which were measured simultaneously.
Table 3
Factor Analysis Results of Study 1.
(in which motivations were measured after the rafting activity).
M
Mean
Intellectual Social Competence/Mastery Stimulus avoidance
To explore new ideas 4.64 .798
To learn about myself 4.66 .878
To expand my knowledge 4.66 .839
To be socially competent and skilful 4.63 .812
To gain a feeling of belonging 4.86 .882
To develop physical skills and abilities 4.63 .779
To keep in shape physically 4.70 .855
To use my physical abilities 4.70 .803
To relax physically 4.44 .824
To relax mentally 4.50 .815
To avoid the hustle and bustle of daily activities 4.28 .828
To rest 4.39 .855
To relieve stress and tension 4.53 .782
Variance explained (%) 18.24 12.74 17.18 26.30
Cronbach Alpha Reliability .855 .775 .812 .881
KMO: 0.788; Bartlett's Test of Sphericity: 2001.33 (0.000); M: motivation.
Table 4
Results of model comparison for study 1.
Classic Model Performance Model
Path/Fit M
Mean
Beta
values
t values PostME
Mean
Beta
values
t values
Intellectual 4.66 .14 2.18** 4.80 .05 .85 (n.s.)
Social 4.75 .18 2.55** 4.97 .22 2.73*
Competence/
Mastery
4.68 .43 6.05* 4.81 .41 5.57*
Stimulus
avoidance
4.43 −.20 −3.77* 4.55 −.32 −5.56*
χ2
/df 2.29 2.36
RMSEA .064 .066
GFI .92 .92
R2
(OS) .39 .37
*p < .01; **p < .05; n.s.: not significant; M: motivation; PostME: post-ex-
perience motivation evaluation.
OS: overall satisfaction.
Table 5
Relationships between constructs.
Correlation coefficient
M (Intellectual) - PostME (Intellectual) .508*
M (Social) - PostME (Social) .331*
M (Competence/Mastery) - PostME (Competence/
Mastery)
.259*
M (Stimulus avoidance) - PostME (Stimulus avoidance) .482*
*p < .01.
T. Albayrak, M. Caber Tourism Management 69 (2018) 201–213
208
8. Study 2
8.1. Research design
In Study 2, participant motivations were measured before the
rafting activity by using Questionnaire 2, containing motivation items
and demographic questions. Then, the same participants’ post-experi-
ence motivation evaluations and overall satisfactions were identified
after the activity by using Questionnaire 3.
8.2. Data collection procedure
Five local travel agencies which supported Study 1 also gave per-
mission to the authors for the data collection in Study 2. Two graduate
students joined all of the tourist transfers from hotels to the rafting area,
organised by supporting travel agencies. Students explained the ob-
jectives of the study to German tourists and solicited their participation,
which began with completing Questionnaire 2 prior to the rafting trip.
Participants wrote their names on forms so that the researchers could
match the questionnaires completed by the same participants at pre-
and post-activity. After the rafting experience, Questionnaire 3 was
distributed to the same participants during the lunch break. In total,
425 questionnaires were obtained between 15th June and 15th
September 2015 by using a convenience sampling method. After the
elimination of incomplete forms, 375 fully answered questionnaires
remained for the analyses, conducted by SPSS 18.0 and LISREL 8.80.
8.3. Sample characteristics
The main demographic characteristics of the respondents are pre-
sented in Table 6. Gender distribution of the respondents was 59.1%
males, and 40.9% females, and the majority of participants (55.6%)
were single. Most participants had a high school (45.2%) or university
(38.7%) level of education, and 44.2% were working as company em-
ployees. The majority of the participants were participating in the
rafting activity with their family members (57.2%). Half of the re-
spondents were aged between 18 and 34 years (50.9%). A considerable
share of tourists had no previous experience in rafting (71.3%).
8.4. Results of study 2
Following the same procedure as in Study 1, an exploratory factor
analysis was conducted on data obtained in Study 2 using the same
items from the Study 1 analysis. The results yielded four factors ex-
plaining 79.19% of the variance. The Cronbach's alpha coefficients
ranged from 0.820 to 0.900, indicating strong internal reliability.
Table 7 shows mean values belonging to motivation items (M), as well
as factor analysis results.
As in Study 1, to compare the competing methods, two research
models were constructed one for classic method other for performance
method. For classic method, the measurement model comprised four
motivation dimensions and OS, for performance method, it consists of
four post-experience motivation evaluation dimensions and OS. Similar
to Study 1, a covariance was added between “relax physically” and
“relax mentally” error terms. The obtained CFA results for both classic
(χ2
= 244.84, df = 93, GFI = 0.92, RMSEA = 0.066, NFI = 0.97, and
CFI = 0.98) and performance (χ2
= 298.86, df = 93, GFI = 0.91,
RMSEA = 0.077, NFI = 0.94, and CFI = 0.96) models provided a good
fit for each measurement model. Appendix 3 shows composite relia-
bility, convergent and discriminant validity of both models.
Following the confirmatory factor analyses, the structural models
were tested. The goodness of fit indices for both research models in-
dicated that the models fitted the data (for classic model: χ2
= 244.84,
df = 93, GFI = 0.92, RMSEA = 0.066, NFI = 0.97, CFI = 0.98; for
performance model: χ2
= 298.86, df = 93, GFI = 0.91,
RMSEA = 0.077, NFI = 0.94, CFI = 0.96). Similar to Study 1, the
comparisons of classic and performance models with their nested
models show that full models (i.e. research models) are the best fitted
models (Appendix 4).
Classic model results showed that motivation factors are not the
significant determinants of OS. The performance model, which employs
post-experience motivation evaluation as the predictor of OS explains
more variance in OS (30%) than the classic model (10%). In contrast to
the classic model, three out of four independent variables have a sig-
nificant effect on OS in the performance model (Table 8).
9. Conclusions
Despite the increasing attention and interest in the last couple of
decades surrounding tourist motivation and its relationship with sa-
tisfaction, the majority of the previous studies investigating the direct
influence of motivation on OS obtained a low explanation ratio for OS
(e.g. Pan & Ryan, 2007; Yoon & Uysal, 2005). Schofield and Thompson
(2007) argued that the main shortcoming of the previous studies was
connecting motivation to OS directly, even though these are indirectly
related. Moreover, motivation appears at the initial stage of the cus-
tomer decision process, while satisfaction occurs as a post-experience
evaluation.
9.1. Summary of the findings
The current study, which is designed to examine the relationship
between motivation and satisfaction, compares the results of two
competing methods (i.e. Classic and Performance) by conducting two
separate surveys. In the first survey, motivation was measured after the
activity, as was the case in much of the previous research. Both the
Classic and Performance methods explained a considerable amount of
the variation in OS (39% and 37%, respectively). Although at first
glance the results of the first survey reflect a high and direct relation-
ship between motivation and OS, it should be noted that motivation
was measured after the activity in Study 1. Measuring motivation after
Table 6
Sample characteristics of study 2 (N = 375).
Characteristics %
Gender Male 59.1
Female 40.9
Marital status Married 44.4
Single 55.6
Occupation Company employee 44.2
Public services 6.5
Student 19.9
Employer 5.7
Retired 10.8
Other 12.9
Age Below than 18 4.8
Between 18 and 34 years 50.9
Between 35 and 52 years 31.2
53 and above 13.1
Education level Secondary school and below 7.2
High school 45.2
University 38.7
Other 8.9
Companion Family member(s) 57.2
Friend(s) 25.0
Relative(s) 5.0
Alone 12.8
Previous experience Yes 28.7
No 71.3
T. Albayrak, M. Caber Tourism Management 69 (2018) 201–213
209
the activity might have meant that participants answered motivation
items by considering their general evaluations about the experience. In
order to clarify this issue, the relationship between motivation and
PostME was investigated for each of the factors. The varying values of
correlation coefficients between 0.259 and 0.508 confirmed that there
was a relationship between motivation and PostME.
In the second survey, inherently, motivation was measured before
the activity, and post-experience motivation evaluation was identified
after the activity. The results of the Classic Method, which suggests a
direct relationship between motivation and OS, revealed that motiva-
tion explained only 10% of the variation in OS. In addition, none of the
motivation factors had a significant effect on OS. The Performance
Method suggests that PostME is the antecedent of OS. The results of the
Performance Method showed that three out of four factors belonging to
PostME were significant predictors of OS. This model explained 30% of
the variation in OS which was higher than that seen in the Classic
Method.
9.2. Theoretical and practical contributions
To date, motivation has been widely studied by academics, and
should be investigated continuously in the future to further under-
standing of tourist behaviour. The primary problem in the existing lit-
erature, which is also the focus of this paper, emerges from linking
motivations directly to OS. As a matter of fact, motivation is related to
the initiation of the behaviour, while satisfaction measures psycholo-
gical outcomes after the experience (Snepenger, King, Marshall,
Marshall, & Uysal, 2006). In addition, the concept of the ‘customer
buying process’, which was first introduced by Engel, Kollat, and
Blackwell (1968), suggests no direct connection between motivation
and satisfaction. In this pattern, the customers are assumed to follow a
cognitive process starting from need recognition. Further, the moti-
vated customers ‘engage in selecting, purchasing, and using products or
services to satisfy need(s) and desire(s)’ (Zanoli & Naspetti, 2002).
Thus, satisfaction or dissatisfaction is a post-purchase behaviour,
formed only after the experience. In this regard, it would be an in-
appropriate approach to relate customer motivation to OS directly.
More clearly, if researchers investigate the direct impact of motivations
on OS, it means that they will attempt to connect two unrelated con-
structs to each other. Such an attempt, for example, will mean linking
the cognitive representation of the ‘I want to participate in rafting to
explore new ideas’ item with the ‘I was satisfied from the rafting ex-
perience’ item, in this particular rafting case. Thus, we propose ‘post-
experience motivation evaluation’ (PostME) concept. Such a variable is
necessary, because motivations do not have a direct impact on OS,
while they have influence on attitudes such as experience evaluations,
which are the antecedents of OS (Huang et al., 2014).
In the meantime, the findings of this study provide empirical evi-
dence that PostME is a better predictor of OS than motivation which is
measured before the experience (as seen in Study 2). Thus, the authors
of this study recommend using PostME, which consists of past tense
versions of motivation items, for investigating the relationship between
motivation and OS. Similar to this proposition, some researchers pre-
viously used motivation items for measuring respondents' satisfaction
related to motivations (Fluker & Turner, 2000; Kao et al., 2008; Thomas
& Butts, 1998). However, they did not relate satisfaction with motiva-
tions to OS. Only Correia et al. (2013), who measured respondents'
satisfaction through motivation items, used the term ‘desire con-
gruency’ to evaluate to what extent the expectations (i.e., motivations)
of respondents were confirmed. The authors found that OS was de-
termined by satisfaction related to push and pull motivations, similar to
the current study's findings.
A unique contribution of this research is investigating the effect of
the timing of motivation measurement on outcomes. The results re-
vealed that a small amount of the variation in OS could be explained by
motivation factors when they were measured before the experience. In
addition, motivation factors did not emerge as the predictors of OS
when they were measured before the experience. On the contrary,
Table 7
Factor Analysis Results of Study 2.
(in which motivations were measured before the rafting activity).
Items M
Mean
Intellectual Social Competence/Mastery Stimulus avoidance
To explore new ideas 4.35 .831
To learn about myself 4.36 .822
To expand my knowledge 4.82 .760
To be socially competent and skilful 4.39 .821
To gain a feeling of belonging 4.70 .777
To develop physical skills and abilities 4.67 .782
To keep in shape physically 4.60 .834
To use my physical abilities 4.71 .841
To relax physically 4.03 .825
To relax mentally 4.15 .773
To avoid the hustle and bustle of daily activities 3.70 .829
To rest 3.69 .886
To relieve stress and tension 4.21 .722
Variance explained (%) 18.88 12.72 20.10 27.49
Cronbach Alpha Reliability .863 .820 .900 .895
KMO: 0.883; Bartlett's Test of Sphericity: 3094.03 (0.000); M: motivation.
Table 8
Results of model comparison for study 2.
Classic Model Performance Model
Path/Fit M
Mean
Beta
values
t values PostME
Mean
Beta
values
t values
Intellectual 4.53 .17 1.57 (n.s.) 4.47 .14 1.99**
Social 4.54 .03 .31 (n.s.) 4.93 .41 4.83*
Competence/
Mastery
4.67 .11 1.15 (n.s.) 5.04 .07 .91 (n.s.)
Stimulus
avoidance
3.94 .04 .61 (n.s.) 4.37 −.18 −3.19*
χ2
/df 2.63 3.21
RMSEA .066 .077
GFI .92 .91
R2
(OS) .10 .30
*p < .01; **p < .05; n.s.: not significant; M: motivation; PostME: post-ex-
perience motivation evaluation.
OS: overall satisfaction.
T. Albayrak, M. Caber Tourism Management 69 (2018) 201–213
210
motivation factors emerged as the strong predictors of OS when they
were measured after the experience. To the best of our knowledge, most
studies which have investigated the motivation-satisfaction relationship
measured respondents’ motivation during or after the activity.
Measuring motivation – which is a pre-experience concept – during or
after an activity may lead to participants taking into account their
evaluations of the experienced activity. In this study, the obtained
correlation coefficients between motivation and PostME (when moti-
vation and PostME were measured simultaneously after the experience
in Study 1) confirm this issue. Similarly, Correia et al. (2013) obtained
significant correlations between motivation and satisfaction, when
measuring these constructs by using the same items simultaneously
after the experience.
In addition, Nowacki (2009) argues that measuring motivation after
the experience ‘is loaded with too large an error because of benefits
gained, which disrupt the original picture of motivation’. In fact, mo-
tivations of the respondents may change during the experience (Battour
et al., 2012). Therefore, previous studies which attempted to determine
motivation during or after an activity might have actually measured
PostME instead of motivation. That might be the reason why some of
these studies obtained a high explanation ratio for OS. We recommend
the measurement of motivation before the experience. More specifi-
cally, in the tourism literature, holiday motivations should be measured
not during or after the holiday experience, but before the experience.
9.3. Limitations and directions for future research
Future research will be needed to assess the generalisability of the
study's findings. Since the study sample consisted of only rafting par-
ticipants, competing methods which were compared in this study
should be tested in different samples such as national park visitors,
conference participants, and destination visitors to verify the findings.
Moreover, in this study, Leisure Motivation Scale (Beard & Ragheb,
1983) was used to measure respondents' motivations. The findings
should be tested by using other motivation scales. In the current study,
we focused on selecting the items that were deemed to be re-
presentative of tourists' rafting motivation. With this purpose, an
iterative elimination process and a wide variety of item elimination
criteria were used. For example, items were eliminated which had
loadings below the recommended cut-off value (≥0.707), or dual-
factor loadings, or low communalities. Moreover, to obtain the same
factor solutions in the analyses of Study 1's and Study 2's data, 19 items
in each have to be eliminated from the scale. Following such strict
principles can be seen as a limitation of this study.
Contributions of the authors
Tahir Albayrak proposed the research theme, designed the research
methodology, made the data analyses. He writes some sections of the
paper. He also revised the manuscript.
Meltem Caber contributed to the design of the whole paper and to
the data analyses. She writes some sections of the paper. She also re-
vised the manuscript.
Acknowledgement
This paper was produced from project (number: SBA-2015-882)
supported by the Scientific Research Projects Coordination Unit of
Akdeniz University.
Appendix 1. Validity of the Constructs for Study 1 (classic/performance model)
Variables CR AVE 1 2 3 4 5
(1) Intellectual .89/.84 .74/.64 .86/.80
(2) Social .82/.78 .69/.64 .41/.49 .83/.80
(3) Competence/Mastery .86/.84 .67/.64 .47/.36 .40/.46 .82/.80
(4) Stimulus avoidance .88/.86 .60/.55 .17/.25 .18/.11 .17/.30 .77/.74
(5) Overall satisfaction .93/.93 .81/.81 .51/.47 .40/.40 .41/.25 -.02/-.12 .90/.90
CR: composite reliability; AVE: average variance extracted.
Bold diagonal values are square root of AVE; others are correlation coefficients.
Appendix 2. The Comparisons of the Nested Models for Study 1
χ2
df χ2
/df RMSEA Δχ2
(Δdf)
Study 1-Classic model
Full model 213.37 93 2.29 .064
Model 1 145.75 58 2.51 .069 67.67 (35) a,b
Model 2 116.02 40 2.90 .077 97.35 (53) a,b
Model 3 80.55 18 4.47 .105 132.82 (75) a,b
Study 1-Performance model
Full model 220.22 93 2.36 .066
Model 1 132.50 58 2.28 .064 87.72 (35) a,b
Model 2 111.27 40 2.78 .075 108.95 (53) a,b
Model 3 69.42 18 3.85 .095 150.80 (75) a,b
Intellectual, Social, Competence/Mastery, and Stimulus avoidance are the determinants of OS in the full model.
Model 1: without Intellectual path.
Model 2: without Intellectual and Social paths.
Model 3: without Intellectual, Social, and Competence/Mastery paths.
a
χ2
difference test was computed against the full model.
b
χ2
difference test was significant at .01 level.
T. Albayrak, M. Caber Tourism Management 69 (2018) 201–213
211
Appendix 3. Validity of the Constructs for Study 2 (classic/performance model)
Variables CR AVE 1 2 3 4 5
(1) Intellectual .82/.84 .61/.63 .78/.79
(2) Social .77/.80 .63/.67 .58/.46 .79/.82
(3) Competence/Mastery .86/.86 .66/.66 .63/.43 .67/.50 .81/.81
(4) Stimulus avoidance .86/.86 .56/.56 .46/.30 .44/.13 .44/.21 .75/.75
(5) Overall satisfaction .93/.93 .82/.82 .26/.31 .25/.45 .27/.35 .21/-.04 .91/.91
CR: composite reliability; AVE: average variance extracted.
Bold diagonal values are square root of AVE; others are correlation coefficients.
Appendix 4. The Comparisons of the Nested Models for Study 2
χ2
df χ2
/df RMSEA Δχ2
(Δdf)
Study 2-Classic model
Full model 244.84 93 2.63 .066
Model 1 171.19 58 2.95 .072 73.65 (35) a,b
Model 2 121.46 40 3.03 .074 123.38 (53) a,b
Model 3 53.82 18 2.99 .073 191.02 (75) a,b
Study 2-Performance model
Full model 298.86 93 3.21 .077
Model 1 220.06 58 3.79 .086 78.80 (35) a,b
Model 2 173.24 40 4.33 .094 125.62 (53) a,b
Model 3 115.67 18 6.42 .120 183.19 (75) a,b
Intellectual, Social, Competence/Mastery, and Stimulus avoidance are the determinants of OS in the full model.
Model 1: without Intellectual path.
Model 2: without Intellectual and Social paths.
Model 3: without Intellectual, Social, and Competence/Mastery paths.
a
χ2
difference test was computed against the full model.
b
χ2
difference test was significant at .01 level.
References
Alegre, J., & Cladera, M. (2009). Analysing the effect of satisfaction and previous visits on
tourist intentions to return. European Journal of Marketing, 43(5/6), 670–685.
Anderson, J. C., & Gerbing, D. W. (1988). Structural equation modelling in practice: A
review and recommended two-step approach. Psychological Bulletin, 103(3), 411–423.
Awaritefe, O. (2004). Motivation and other considerations in tourist destination choice: A
case study of Nigeria. Tourism Geographies, 6(3), 303–330.
Babin, B. J., & Griffin, M. (1998). The nature an updated of satisfaction: Examination and
analysis. Journal of Business Research, 41, 127–136.
Battour, M. M., Battor, M. M., & Ismail, M. (2012). The mediating role of tourist sa-
tisfaction: A study of Muslim tourists in Malaysia. Journal of Travel & Tourism
Marketing, 29(3), 279–297.
Beard, J. G., & Ragheb, M. G. (1983). Measuring leisure motivation. Journal of Leisure
Research, 75(3), 219–228.
Bigné, E., Andreu, L., & Gnoth, J. (2005). The theme park experience: An analysis of
pleasure, arousal and satisfaction. Tourism Management, 26, 833–844.
Biswas, M. (2008). Confirmatory factor analysis of Iso Ahola's motivational theory: An
application of structural equation modeling. Proceedings of conference on tourism in
India – challenges ahead (pp. 177–188). IIMK, 15-17 May 2008.
del Bosque, I. R., & San Martín, H. (2008). Tourist satisfaction: A cognitive-affective
model. Annals of Tourism Research, 35(2), 551–573.
Bowen, D., & Clarke, J. (2002). Reflections on tourist satisfaction research: Past, present
and future. Journal of Vacation Marketing, 8(4), 297–308.
den Breejen, L. (2007). The experiences of long distance walking: A case study of the west
highland way in Scotland. Tourism Management, 28, 1417–1427.
Bright, A. D. (2008). Motivations, attitudes, and beliefs. In H. Oh, & A. Pizam (Eds.).
Handbook of hospitality marketing management (pp. 239–266). Oxford: Butterworth-
Heinemann.
Bultena, G. L., & Klessig, L. L. (1969). Satisfaction in camping: A conceptualization and
guide to social research. Journal of Leisure Research, 1, 348–354.
Caber, M., & Albayrak, T. (2016). Push or pull? Identifying rock climbing tourists' mo-
tivations. Tourism Management, 55, 74–84.
Castaňo, J. M., Moreno, A., García, S., & Crego, A. (2003). Aproximación psicosocial a la
motivación turística: Variables implicadas en la elección de Madrid como destino.
Estudios Turísticos, 158, 5–41.
Correia, A., Kozak, M., & Ferradeira, J. (2013). From tourist motivations to tourist sa-
tisfaction. International Journal of Culture, Tourism and Hospitality Research, 7(4),
411–424.
Dann, G. M. S. (1977). Anomie, ego-enhancement and tourism. Annals of Tourism
Research, 4(4), 184–194.
Dann, G. M. S. (1981). Tourist motivation an appraisal. Annals of Tourism Research, 8(2),
187–219.
Devesa, M., Laguna, M., & Palacios, A. (2010). The role of motivation in visitor sa-
tisfaction: Empirical evidence in rural tourism. Tourism Management, 31, 547–552.
Engel, J. F., Kollat, D. T., & Blackwell, R. D. (1968). Consumer behavior (1st ed.). , New
York: Holt, Rinehart and Winston.
Fluker, M. R., & Turner, L. W. (2000). Needs, motivations, and expectations of a com-
mercial whitewater rafting experience. Journal of Travel Research, 38, 380–389.
Hair, J. F., Jr., Anderson, R. E., Tatham, R. L., & Black, W. C. (1998). Multivariate data
analysis. Pearson education. New Jersey: Prentice-Hall, INC.
Herzberg, F. (1968). One more time: How do you motivate employees? Harvard Business
Review, 46, 53–62.
Hsu, C. H. C., Cai, L. A., & Li, M. (2010). Expectation, motivation, and attitude: A tourist
behavioral model. Journal of Travel Research, 49(3), 282–296.
Huang, S., & Hsu, C. H. C. (2009). Effects of travel motivation, past experience, perceived
constraint, and attitude on revisit intention. Journal of Travel Research, 48(1), 29–44.
Huang, Y., Luo, S., Ding, P., & Scott, N. (2014). Impressions of liusanjie: A study of
motivation, theatrical performance evaluation, and satisfaction. Current Issues in
Tourism, 17(3), 280–296.
Hui, T. K., Wan, D., & Ho, A. (2007). Tourists' satisfaction, recommendation and revisiting
Singapore. Tourism Management, 28, 965–975.
Hurlbert, J. E. (1991). Social networks, social circles, and job satisfaction. Work and
Occupations, 18(4), 415–430.
Iacobucci, D. (2010). Structural equations modeling: Fit Indices, sample size, and ad-
vanced topics. Journal of Consumer Psychology, 20, 90–98.
Inui, Y., Lankford, J. K., & Lankford, S. V. (2004). An exploratory motivational study of
Japanese adventure based tourism. e-Review of Tourism Research (eRTR), 2(4), 70–77.
Iso-Ahola, S. E. (1982). Toward a social psychological theory of tourism motivation: A
rejoinder. Annals of Tourism Research, 9, 256–262.
Kao, M. C., Patterson, I., Scott, N., & Li, C. K. (2008). Motivations and satisfactions of
Taiwanese tourists who visit Australia. Journal of Travel & Tourism Marketing, 24(1),
17–33.
Kay, P. (2003). Consumer motivation in a tourism Context: Continuing the work of
Maslow, Rokeach, Vroom, Deci, haley and others. ANZMAC 2003: A celebrations of
ehrenberg and Bass: Marketing discoveries, knowledge and contribution: Proceedings of the
2003 australian and New Zealand marketing academy conference (pp. 600–614).
T. Albayrak, M. Caber Tourism Management 69 (2018) 201–213
212
Adelaide, S. Aust.: ANZMAC.
Khuong, M. N., & Ha, H. T. T. (2014). The influences of push and pull factors on the
international leisure tourists' return intention to Ho Chi Minh city, Vietnam -A
mediation analysis of destination satisfaction. International Journal of Trade,
Economics and Finance, 5(6), 490–496.
LaTour, S. A., & Peat, N. C. (1979). Conceptual and methodological issues in consumer
satisfaction research. In W. F. Wilkie (Vol. Ed.), Advances in consumer research: Vol. 6,
(pp. 31–37). Ann Arbor, MI: Association for Consumer Research.
Lee, T. H. (2010). A structural model to examine how destination image, attitude, and
motivation affect the future behavior of tourists. Leisure Sciences, 31(3), 215–236.
Lee, T. H., & Hsu, F. Y. (2013). Examining how attending motivation and satisfaction
affects the loyalty for attendees at aboriginal festivals. International Journal of Tourism
Research, 15, 18–34.
Lee, C. K., Reisinger, Y., Kim, M. J., & Yoon, S. M. (2014). The influence of volunteer
motivation on satisfaction, attitudes, and support for a mega-event. International
Journal of Hospitality Management, 40, 37–48.
Li, M., Cai, L. A., Lehto, X. Y., & Huang, J. Z. (2010). A missing link in understanding
revisit intention—the role of motivation and image. Journal of Travel & Tourism
Marketing, 27(4), 335–348.
Maslow, A. H. (1943). A theory of human motivation. Psychological Review, 50(4),
370–396.
Maslow, A. H. (1970). Motivation and personality. New York: Harper & Row.
McClelland, D. C. (1955). Studies in motivation. New York: Appleton-Century-Crofts.
Meng, F., Tepanon, Y., & Uysal, M. (2008). Measuring tourist satisfaction by attribute and
motivation: The case of a nature-based resort. Journal of Vacation Marketing, 14(1),
41–56.
Mill, R., & Morrison, A. (1998). The tourism System: An introductory text (3rd ed.).
Dubuque, Iowda: Dendall/Hunt Publishing Company.
Mittal, V., Ross, W. T., & Baldasare, P. M. (1998). The asymmetric impact of negative and
positive attribute-level performance on overall satisfaction and repurchase inten-
tions. Journal of Marketing, 62, 33–47.
Mohammad, B. A. M. A., & Som, A. P. M. (2010). An analysis of push and pull travel
motivations of foreign tourists to Jordan. International Journal of Business and
Management, 5(12), 41–50.
Mohsin, A. (2008). Analysis of Chinese travellers' attitudes toward holidaying in New
Zealand: The impact of socio-demographic variables. Journal of Hospitality & Leisure
Marketing, 16(1–2), 21–40.
Murphy, L., Benckendorff, P., & Moscardo, G. (2007). Linking travel motivation, tourist
self-image and destination brand personality. Journal of Travel & Tourism Marketing,
22(2), 45–59.
Murray, H. A. (1938). Explorations in personality. New York: Oxford University Press.
Nowacki, M. M. (2009). Quality of visitor attractions, satisfaction, benefits and beha-
vioural intentions of visitors: Verification of a model. International Journal of Tourism
Research, 11, 297–309.
Oh, H., & Parks, S. C. (1997). Customer satisfaction and service quality: A critical review
of the literature and research implications for the hospitality industry. Hospitality
Research Journal, 20(3), 35–64.
Oliver, R. L. (1980). A cognitive model of the antecedents and consequences of sa-
tisfaction decisions. Journal of Marketing Research, 17, 460–469.
Oliver, R. L. (1981). Measurement and evaluation of satisfaction processes in retail set-
tings. Journal of Retailing, 57, 25–48.
Oliver, R. L., & Swan, J. E. (1989). Equity and disconfirmation perceptions as influences
on merchant and product satisfaction. Journal of Consumer Research, 16, 372–383.
Pan, S., & Ryan, C. (2007). Mountain areas and visitor usage-motivations and determi-
nants of satisfaction: The case of Pirongia Forest Park, New Zealand. Journal of
Sustainable Tourism, 15(3), 288–307.
Pearce, P. L. (1993). Fundamental of tourist motivation. In D. G. Pearce, & R. W. Butler
(Eds.). Tourism Research: Critiques and challenges (pp. 113–134). London: Routledge.
Pincus, J. (2004). The consequences of unmet needs: The evolving role of motivation in
consumer research. Journal of Consumer Behaviour, 3(4), 375–387.
Pizam, A., & Ellis, T. (1999). Customer satisfaction and its measurement in hospitality
enterprises. International Journal of Contemporary Hospitality Management, 11(7),
326–339.
Pizam, A., Neuman, Y., & Reichel, A. (1978). Dimensions of tourist satisfaction with
destination area. Annals of Tourism Research, 5(3), 314–322.
Prebensen, N., Skallerud, K., & Chen, J. S. (2010). Tourist motivation with sun and sand
destinations: Satisfaction and the WOM-effect. Journal of Travel & Tourism Marketing,
27(8), 858–873.
Qiao, G.-H., Chen, N., Guan, Y.-Y., & Kim, S.-C. (2008). Study on Chinese tourists' mo-
tivation and satisfaction to visit South Korea. International Journal of Tourism Science,
8(1), 17–38.
Ross, E. L. D., & Iso-Ahola, A. E. (1991). Sightseeing tourists' motivation and satisfaction.
Annals of Tourism Research, 18, 226–237.
Ryan, C., & Glendon, I. (1998). Application of leisure motivation scale to tourism. Annals
of Tourism Research, 25(1), 169–184.
Savinovic, A., Kim, S., & Long, P. (2012). Audience members' motivation, satisfaction, and
intention to re-visit an ethnic minority cultural festival. Journal of Travel & Tourism
Marketing, 29(7), 682–694.
Schofield, P., & Thompson, K. (2007). Visitor motivation, satisfaction and behavioural
intention: The 2005 Naadam Festival, Ulaanbaatar. International Journal of Tourism
Research, 9(5), 329–344.
Severt, D., Wang, Y., Chen, P. J., & Breiter, D. (2007). Examining the motivation, per-
ceived performance, and behavioral intentions of convention attendees: Evidence
from a regional conference. Tourism Management, 28, 399–408.
Shimp, T., & Sharma, S. (1987). Consumer ethnocentrism: Construction and validation of
the CETSCALE. Journal of Marketing Research, 24, 280–289.
Snepenger, D., King, J., Marshall, E., Marshall, E., & Uysal, M. (2006). Modelling Iso-
Ahola’s motivation theory in the tourism context. Journal of Travel Research, 45(2),
140–149.
Tang, Y. (2014). Travel motivation, destination image and visitor satisfaction of inter-
national tourists after the 2008 wenchuan earthquake: A structural modelling ap-
proach. Asia Pacific Journal of Tourism Research, 19(11), 1260–1277.
Thomas, D. W., & Butts, F. B. (1998). Assessing leisure motivators and satisfaction of
international Elderhostel participants. Journal of Travel & Tourism Marketing, 7(1),
31–38.
Tian-Cole, S., & Cromption, J. (2003). A conceptualization of the relationships between
service quality and visitor satisfaction, and their links to destination selection. Leisure
Studies, 22(1), 65–80.
Vargo, S. L., Nagao, K., He, Y., & Morgan, F. W. (2007). Satisfiers, dissatisfiers, criticals,
and neutrals: A review of their relative effects on customer (dis)satisfaction. Academy
of Marketing Science Review, 11(2), 1–19.
Vroom, V. H. (1964). Work and motivation. New York: Wiley.
Wolfe, K., & Hsu, C. H. C. (2004). An application of the social psychological model of
tourism motivation. International Journal of Hospitality & Tourism Administration, 5(1),
29–47.
Woodruff, R. B., Cadotte, E. R., & Jenkins, R. L. (1983). Modeling consumer satisfaction
processes using experience-based norms. Journal of Marketing Research, 20(3),
296–304.
Wu, C. H. J., & Liang, R. D. (2011). The relationship between white-water rafting ex-
perience formation and customer reaction: A flow theory perspective. Tourism
Management, 32(2), 317–325.
Yoon, Y., & Uysal, M. (2005). An examination of the effects of motivation and satisfaction
on destination loyalty: A structural model. Tourism Management, 26, 45–56.
Yusof, A., Omar-Fauzee, M. S., Shah, P. M., & Geok, S. K. (2009). Exploring small-scale
sport event tourism in Malaysia. Research Journal of International Studies, 9, 47–58.
Zanoli, R., & Naspetti, S. (2002). Consumer motivations in the purchase of organic food.
British Food Journal, 104(8), 643–653.
Tahir Albayrak completed his PhD at Akdeniz University,
Business Management Programme in 2008. He has several
published international conference papers and refereed ar-
ticles about niche marketing, consumer behaviour and
service quality at the marketing and tourism journals.
Meltem Caber works as associate professor at Akdeniz
University, Tourism Faculty. She is currently the head of
programme of Tourism Guidance. Some of her research
interests are e-CRM, foreign direct investments in tourism
and destination management. She has several published
international conference papers and refereed articles about
tourism management.
T. Albayrak, M. Caber Tourism Management 69 (2018) 201–213
213

More Related Content

Similar to NC

s3818473_Vu Phan Lam Anh_Assessment Task 2-1.docx
s3818473_Vu Phan Lam Anh_Assessment Task 2-1.docxs3818473_Vu Phan Lam Anh_Assessment Task 2-1.docx
s3818473_Vu Phan Lam Anh_Assessment Task 2-1.docxNgoc Tuyen
 
Nursing A Concept Analysis Paper
Nursing A Concept Analysis PaperNursing A Concept Analysis Paper
Nursing A Concept Analysis PaperKristen Stacey
 
Difference Between Quantitative And Qualitative Research
Difference Between Quantitative And Qualitative ResearchDifference Between Quantitative And Qualitative Research
Difference Between Quantitative And Qualitative ResearchMelanie Smith
 
Analyze Quantitative And Qualitative Research
Analyze Quantitative And Qualitative ResearchAnalyze Quantitative And Qualitative Research
Analyze Quantitative And Qualitative ResearchAmy Roman
 
Qualitative_Research_Method_Grounded_Theory.pdf
Qualitative_Research_Method_Grounded_Theory.pdfQualitative_Research_Method_Grounded_Theory.pdf
Qualitative_Research_Method_Grounded_Theory.pdfHedayat9
 
Research Method, Methodology and Design.pptx
Research Method, Methodology and Design.pptxResearch Method, Methodology and Design.pptx
Research Method, Methodology and Design.pptxShivraj Nile
 
CHAPTER 1 THE SELECTION OF A RESEARCH APPROACHResearch approac
CHAPTER 1 THE SELECTION OF A RESEARCH APPROACHResearch approacCHAPTER 1 THE SELECTION OF A RESEARCH APPROACHResearch approac
CHAPTER 1 THE SELECTION OF A RESEARCH APPROACHResearch approacEstelaJeffery653
 
Effects of Personality Traits on Hedonic Travel Motivation
Effects of Personality Traits on Hedonic Travel MotivationEffects of Personality Traits on Hedonic Travel Motivation
Effects of Personality Traits on Hedonic Travel Motivationinventionjournals
 
Cross-Cultural Psychology
Cross-Cultural PsychologyCross-Cultural Psychology
Cross-Cultural PsychologyMonica Carter
 
Research Method, Methodology and Design.pptx
Research Method, Methodology and Design.pptxResearch Method, Methodology and Design.pptx
Research Method, Methodology and Design.pptxhanzaahmad1
 
Research Method, Methodology and Design.pptx
Research Method, Methodology and Design.pptxResearch Method, Methodology and Design.pptx
Research Method, Methodology and Design.pptxJessaBejer1
 
Cultural Significance Of Art
Cultural Significance Of ArtCultural Significance Of Art
Cultural Significance Of ArtKaty Allen
 
Qualitative Research Critique II 2
Qualitative Research Critique II 2Qualitative Research Critique II 2
Qualitative Research Critique II 2Jessica Rinehart
 
Attitudes, Values and Organizational Culture: Disentangling the Concepts
Attitudes, Values and Organizational Culture: Disentangling the ConceptsAttitudes, Values and Organizational Culture: Disentangling the Concepts
Attitudes, Values and Organizational Culture: Disentangling the ConceptsValerieBez1
 
Research design and methods, Dr. William Kritsonis
Research design and methods, Dr. William KritsonisResearch design and methods, Dr. William Kritsonis
Research design and methods, Dr. William KritsonisWilliam Kritsonis
 
Research Design and Methodology, Dr. W.A. Kritsonis
Research Design and Methodology, Dr. W.A. KritsonisResearch Design and Methodology, Dr. W.A. Kritsonis
Research Design and Methodology, Dr. W.A. Kritsonisguestcc1ebaf
 
RPE Unit 1 rm
RPE Unit 1 rmRPE Unit 1 rm
RPE Unit 1 rmblzz2net
 
The World Testifies Of Data And Our Understanding Of It Essay
The World Testifies Of Data And Our Understanding Of It EssayThe World Testifies Of Data And Our Understanding Of It Essay
The World Testifies Of Data And Our Understanding Of It EssaySandy Harwell
 
2011TheoriesofJobSatisfaction-GLOBALAPPLICATIONSLIMITATIONS.pdf
2011TheoriesofJobSatisfaction-GLOBALAPPLICATIONSLIMITATIONS.pdf2011TheoriesofJobSatisfaction-GLOBALAPPLICATIONSLIMITATIONS.pdf
2011TheoriesofJobSatisfaction-GLOBALAPPLICATIONSLIMITATIONS.pdfDipjyoti Datta
 

Similar to NC (20)

s3818473_Vu Phan Lam Anh_Assessment Task 2-1.docx
s3818473_Vu Phan Lam Anh_Assessment Task 2-1.docxs3818473_Vu Phan Lam Anh_Assessment Task 2-1.docx
s3818473_Vu Phan Lam Anh_Assessment Task 2-1.docx
 
Nursing A Concept Analysis Paper
Nursing A Concept Analysis PaperNursing A Concept Analysis Paper
Nursing A Concept Analysis Paper
 
Difference Between Quantitative And Qualitative Research
Difference Between Quantitative And Qualitative ResearchDifference Between Quantitative And Qualitative Research
Difference Between Quantitative And Qualitative Research
 
Analyze Quantitative And Qualitative Research
Analyze Quantitative And Qualitative ResearchAnalyze Quantitative And Qualitative Research
Analyze Quantitative And Qualitative Research
 
Qualitative_Research_Method_Grounded_Theory.pdf
Qualitative_Research_Method_Grounded_Theory.pdfQualitative_Research_Method_Grounded_Theory.pdf
Qualitative_Research_Method_Grounded_Theory.pdf
 
Research Method, Methodology and Design.pptx
Research Method, Methodology and Design.pptxResearch Method, Methodology and Design.pptx
Research Method, Methodology and Design.pptx
 
CHAPTER 1 THE SELECTION OF A RESEARCH APPROACHResearch approac
CHAPTER 1 THE SELECTION OF A RESEARCH APPROACHResearch approacCHAPTER 1 THE SELECTION OF A RESEARCH APPROACHResearch approac
CHAPTER 1 THE SELECTION OF A RESEARCH APPROACHResearch approac
 
Effects of Personality Traits on Hedonic Travel Motivation
Effects of Personality Traits on Hedonic Travel MotivationEffects of Personality Traits on Hedonic Travel Motivation
Effects of Personality Traits on Hedonic Travel Motivation
 
Examples Of Research Essays
Examples Of Research EssaysExamples Of Research Essays
Examples Of Research Essays
 
Cross-Cultural Psychology
Cross-Cultural PsychologyCross-Cultural Psychology
Cross-Cultural Psychology
 
Research Method, Methodology and Design.pptx
Research Method, Methodology and Design.pptxResearch Method, Methodology and Design.pptx
Research Method, Methodology and Design.pptx
 
Research Method, Methodology and Design.pptx
Research Method, Methodology and Design.pptxResearch Method, Methodology and Design.pptx
Research Method, Methodology and Design.pptx
 
Cultural Significance Of Art
Cultural Significance Of ArtCultural Significance Of Art
Cultural Significance Of Art
 
Qualitative Research Critique II 2
Qualitative Research Critique II 2Qualitative Research Critique II 2
Qualitative Research Critique II 2
 
Attitudes, Values and Organizational Culture: Disentangling the Concepts
Attitudes, Values and Organizational Culture: Disentangling the ConceptsAttitudes, Values and Organizational Culture: Disentangling the Concepts
Attitudes, Values and Organizational Culture: Disentangling the Concepts
 
Research design and methods, Dr. William Kritsonis
Research design and methods, Dr. William KritsonisResearch design and methods, Dr. William Kritsonis
Research design and methods, Dr. William Kritsonis
 
Research Design and Methodology, Dr. W.A. Kritsonis
Research Design and Methodology, Dr. W.A. KritsonisResearch Design and Methodology, Dr. W.A. Kritsonis
Research Design and Methodology, Dr. W.A. Kritsonis
 
RPE Unit 1 rm
RPE Unit 1 rmRPE Unit 1 rm
RPE Unit 1 rm
 
The World Testifies Of Data And Our Understanding Of It Essay
The World Testifies Of Data And Our Understanding Of It EssayThe World Testifies Of Data And Our Understanding Of It Essay
The World Testifies Of Data And Our Understanding Of It Essay
 
2011TheoriesofJobSatisfaction-GLOBALAPPLICATIONSLIMITATIONS.pdf
2011TheoriesofJobSatisfaction-GLOBALAPPLICATIONSLIMITATIONS.pdf2011TheoriesofJobSatisfaction-GLOBALAPPLICATIONSLIMITATIONS.pdf
2011TheoriesofJobSatisfaction-GLOBALAPPLICATIONSLIMITATIONS.pdf
 

Recently uploaded

Quick Doctor In Kuwait +2773`7758`557 Kuwait Doha Qatar Dubai Abu Dhabi Sharj...
Quick Doctor In Kuwait +2773`7758`557 Kuwait Doha Qatar Dubai Abu Dhabi Sharj...Quick Doctor In Kuwait +2773`7758`557 Kuwait Doha Qatar Dubai Abu Dhabi Sharj...
Quick Doctor In Kuwait +2773`7758`557 Kuwait Doha Qatar Dubai Abu Dhabi Sharj...daisycvs
 
Falcon Invoice Discounting: The best investment platform in india for investors
Falcon Invoice Discounting: The best investment platform in india for investorsFalcon Invoice Discounting: The best investment platform in india for investors
Falcon Invoice Discounting: The best investment platform in india for investorsFalcon Invoice Discounting
 
Nashik Call Girl Just Call 7091819311 Top Class Call Girl Service Available
Nashik Call Girl Just Call 7091819311 Top Class Call Girl Service AvailableNashik Call Girl Just Call 7091819311 Top Class Call Girl Service Available
Nashik Call Girl Just Call 7091819311 Top Class Call Girl Service Availablepr788182
 
Berhampur 70918*19311 CALL GIRLS IN ESCORT SERVICE WE ARE PROVIDING
Berhampur 70918*19311 CALL GIRLS IN ESCORT SERVICE WE ARE PROVIDINGBerhampur 70918*19311 CALL GIRLS IN ESCORT SERVICE WE ARE PROVIDING
Berhampur 70918*19311 CALL GIRLS IN ESCORT SERVICE WE ARE PROVIDINGpr788182
 
Al Mizhar Dubai Escorts +971561403006 Escorts Service In Al Mizhar
Al Mizhar Dubai Escorts +971561403006 Escorts Service In Al MizharAl Mizhar Dubai Escorts +971561403006 Escorts Service In Al Mizhar
Al Mizhar Dubai Escorts +971561403006 Escorts Service In Al Mizharallensay1
 
JAJPUR CALL GIRL ❤ 82729*64427❤ CALL GIRLS IN JAJPUR ESCORTS
JAJPUR CALL GIRL ❤ 82729*64427❤ CALL GIRLS IN JAJPUR  ESCORTSJAJPUR CALL GIRL ❤ 82729*64427❤ CALL GIRLS IN JAJPUR  ESCORTS
JAJPUR CALL GIRL ❤ 82729*64427❤ CALL GIRLS IN JAJPUR ESCORTSkajalroy875762
 
Falcon Invoice Discounting: Empowering Your Business Growth
Falcon Invoice Discounting: Empowering Your Business GrowthFalcon Invoice Discounting: Empowering Your Business Growth
Falcon Invoice Discounting: Empowering Your Business GrowthFalcon investment
 
Marel Q1 2024 Investor Presentation from May 8, 2024
Marel Q1 2024 Investor Presentation from May 8, 2024Marel Q1 2024 Investor Presentation from May 8, 2024
Marel Q1 2024 Investor Presentation from May 8, 2024Marel
 
QSM Chap 10 Service Culture in Tourism and Hospitality Industry.pptx
QSM Chap 10 Service Culture in Tourism and Hospitality Industry.pptxQSM Chap 10 Service Culture in Tourism and Hospitality Industry.pptx
QSM Chap 10 Service Culture in Tourism and Hospitality Industry.pptxDitasDelaCruz
 
KALYANI 💋 Call Girl 9827461493 Call Girls in Escort service book now
KALYANI 💋 Call Girl 9827461493 Call Girls in  Escort service book nowKALYANI 💋 Call Girl 9827461493 Call Girls in  Escort service book now
KALYANI 💋 Call Girl 9827461493 Call Girls in Escort service book nowkapoorjyoti4444
 
Horngren’s Cost Accounting A Managerial Emphasis, Canadian 9th edition soluti...
Horngren’s Cost Accounting A Managerial Emphasis, Canadian 9th edition soluti...Horngren’s Cost Accounting A Managerial Emphasis, Canadian 9th edition soluti...
Horngren’s Cost Accounting A Managerial Emphasis, Canadian 9th edition soluti...ssuserf63bd7
 
Challenges and Opportunities: A Qualitative Study on Tax Compliance in Pakistan
Challenges and Opportunities: A Qualitative Study on Tax Compliance in PakistanChallenges and Opportunities: A Qualitative Study on Tax Compliance in Pakistan
Challenges and Opportunities: A Qualitative Study on Tax Compliance in Pakistanvineshkumarsajnani12
 
Getting Real with AI - Columbus DAW - May 2024 - Nick Woo from AlignAI
Getting Real with AI - Columbus DAW - May 2024 - Nick Woo from AlignAIGetting Real with AI - Columbus DAW - May 2024 - Nick Woo from AlignAI
Getting Real with AI - Columbus DAW - May 2024 - Nick Woo from AlignAITim Wilson
 
Arti Languages Pre Seed Teaser Deck 2024.pdf
Arti Languages Pre Seed Teaser Deck 2024.pdfArti Languages Pre Seed Teaser Deck 2024.pdf
Arti Languages Pre Seed Teaser Deck 2024.pdfwill854175
 
Durg CALL GIRL ❤ 82729*64427❤ CALL GIRLS IN durg ESCORTS
Durg CALL GIRL ❤ 82729*64427❤ CALL GIRLS IN durg ESCORTSDurg CALL GIRL ❤ 82729*64427❤ CALL GIRLS IN durg ESCORTS
Durg CALL GIRL ❤ 82729*64427❤ CALL GIRLS IN durg ESCORTSkajalroy875762
 
Paradip CALL GIRL❤7091819311❤CALL GIRLS IN ESCORT SERVICE WE ARE PROVIDING
Paradip CALL GIRL❤7091819311❤CALL GIRLS IN ESCORT SERVICE WE ARE PROVIDINGParadip CALL GIRL❤7091819311❤CALL GIRLS IN ESCORT SERVICE WE ARE PROVIDING
Paradip CALL GIRL❤7091819311❤CALL GIRLS IN ESCORT SERVICE WE ARE PROVIDINGpr788182
 
Berhampur 70918*19311 CALL GIRLS IN ESCORT SERVICE WE ARE PROVIDING
Berhampur 70918*19311 CALL GIRLS IN ESCORT SERVICE WE ARE PROVIDINGBerhampur 70918*19311 CALL GIRLS IN ESCORT SERVICE WE ARE PROVIDING
Berhampur 70918*19311 CALL GIRLS IN ESCORT SERVICE WE ARE PROVIDINGpr788182
 
Puri CALL GIRL ❤️8084732287❤️ CALL GIRLS IN ESCORT SERVICE WE ARW PROVIDING
Puri CALL GIRL ❤️8084732287❤️ CALL GIRLS IN ESCORT SERVICE WE ARW PROVIDINGPuri CALL GIRL ❤️8084732287❤️ CALL GIRLS IN ESCORT SERVICE WE ARW PROVIDING
Puri CALL GIRL ❤️8084732287❤️ CALL GIRLS IN ESCORT SERVICE WE ARW PROVIDINGpriyakumari801827
 
PHX May 2024 Corporate Presentation Final
PHX May 2024 Corporate Presentation FinalPHX May 2024 Corporate Presentation Final
PHX May 2024 Corporate Presentation FinalPanhandleOilandGas
 

Recently uploaded (20)

Quick Doctor In Kuwait +2773`7758`557 Kuwait Doha Qatar Dubai Abu Dhabi Sharj...
Quick Doctor In Kuwait +2773`7758`557 Kuwait Doha Qatar Dubai Abu Dhabi Sharj...Quick Doctor In Kuwait +2773`7758`557 Kuwait Doha Qatar Dubai Abu Dhabi Sharj...
Quick Doctor In Kuwait +2773`7758`557 Kuwait Doha Qatar Dubai Abu Dhabi Sharj...
 
Falcon Invoice Discounting: The best investment platform in india for investors
Falcon Invoice Discounting: The best investment platform in india for investorsFalcon Invoice Discounting: The best investment platform in india for investors
Falcon Invoice Discounting: The best investment platform in india for investors
 
Nashik Call Girl Just Call 7091819311 Top Class Call Girl Service Available
Nashik Call Girl Just Call 7091819311 Top Class Call Girl Service AvailableNashik Call Girl Just Call 7091819311 Top Class Call Girl Service Available
Nashik Call Girl Just Call 7091819311 Top Class Call Girl Service Available
 
Berhampur 70918*19311 CALL GIRLS IN ESCORT SERVICE WE ARE PROVIDING
Berhampur 70918*19311 CALL GIRLS IN ESCORT SERVICE WE ARE PROVIDINGBerhampur 70918*19311 CALL GIRLS IN ESCORT SERVICE WE ARE PROVIDING
Berhampur 70918*19311 CALL GIRLS IN ESCORT SERVICE WE ARE PROVIDING
 
Al Mizhar Dubai Escorts +971561403006 Escorts Service In Al Mizhar
Al Mizhar Dubai Escorts +971561403006 Escorts Service In Al MizharAl Mizhar Dubai Escorts +971561403006 Escorts Service In Al Mizhar
Al Mizhar Dubai Escorts +971561403006 Escorts Service In Al Mizhar
 
JAJPUR CALL GIRL ❤ 82729*64427❤ CALL GIRLS IN JAJPUR ESCORTS
JAJPUR CALL GIRL ❤ 82729*64427❤ CALL GIRLS IN JAJPUR  ESCORTSJAJPUR CALL GIRL ❤ 82729*64427❤ CALL GIRLS IN JAJPUR  ESCORTS
JAJPUR CALL GIRL ❤ 82729*64427❤ CALL GIRLS IN JAJPUR ESCORTS
 
Falcon Invoice Discounting: Empowering Your Business Growth
Falcon Invoice Discounting: Empowering Your Business GrowthFalcon Invoice Discounting: Empowering Your Business Growth
Falcon Invoice Discounting: Empowering Your Business Growth
 
Marel Q1 2024 Investor Presentation from May 8, 2024
Marel Q1 2024 Investor Presentation from May 8, 2024Marel Q1 2024 Investor Presentation from May 8, 2024
Marel Q1 2024 Investor Presentation from May 8, 2024
 
QSM Chap 10 Service Culture in Tourism and Hospitality Industry.pptx
QSM Chap 10 Service Culture in Tourism and Hospitality Industry.pptxQSM Chap 10 Service Culture in Tourism and Hospitality Industry.pptx
QSM Chap 10 Service Culture in Tourism and Hospitality Industry.pptx
 
KALYANI 💋 Call Girl 9827461493 Call Girls in Escort service book now
KALYANI 💋 Call Girl 9827461493 Call Girls in  Escort service book nowKALYANI 💋 Call Girl 9827461493 Call Girls in  Escort service book now
KALYANI 💋 Call Girl 9827461493 Call Girls in Escort service book now
 
Horngren’s Cost Accounting A Managerial Emphasis, Canadian 9th edition soluti...
Horngren’s Cost Accounting A Managerial Emphasis, Canadian 9th edition soluti...Horngren’s Cost Accounting A Managerial Emphasis, Canadian 9th edition soluti...
Horngren’s Cost Accounting A Managerial Emphasis, Canadian 9th edition soluti...
 
Challenges and Opportunities: A Qualitative Study on Tax Compliance in Pakistan
Challenges and Opportunities: A Qualitative Study on Tax Compliance in PakistanChallenges and Opportunities: A Qualitative Study on Tax Compliance in Pakistan
Challenges and Opportunities: A Qualitative Study on Tax Compliance in Pakistan
 
Getting Real with AI - Columbus DAW - May 2024 - Nick Woo from AlignAI
Getting Real with AI - Columbus DAW - May 2024 - Nick Woo from AlignAIGetting Real with AI - Columbus DAW - May 2024 - Nick Woo from AlignAI
Getting Real with AI - Columbus DAW - May 2024 - Nick Woo from AlignAI
 
Arti Languages Pre Seed Teaser Deck 2024.pdf
Arti Languages Pre Seed Teaser Deck 2024.pdfArti Languages Pre Seed Teaser Deck 2024.pdf
Arti Languages Pre Seed Teaser Deck 2024.pdf
 
Durg CALL GIRL ❤ 82729*64427❤ CALL GIRLS IN durg ESCORTS
Durg CALL GIRL ❤ 82729*64427❤ CALL GIRLS IN durg ESCORTSDurg CALL GIRL ❤ 82729*64427❤ CALL GIRLS IN durg ESCORTS
Durg CALL GIRL ❤ 82729*64427❤ CALL GIRLS IN durg ESCORTS
 
HomeRoots Pitch Deck | Investor Insights | April 2024
HomeRoots Pitch Deck | Investor Insights | April 2024HomeRoots Pitch Deck | Investor Insights | April 2024
HomeRoots Pitch Deck | Investor Insights | April 2024
 
Paradip CALL GIRL❤7091819311❤CALL GIRLS IN ESCORT SERVICE WE ARE PROVIDING
Paradip CALL GIRL❤7091819311❤CALL GIRLS IN ESCORT SERVICE WE ARE PROVIDINGParadip CALL GIRL❤7091819311❤CALL GIRLS IN ESCORT SERVICE WE ARE PROVIDING
Paradip CALL GIRL❤7091819311❤CALL GIRLS IN ESCORT SERVICE WE ARE PROVIDING
 
Berhampur 70918*19311 CALL GIRLS IN ESCORT SERVICE WE ARE PROVIDING
Berhampur 70918*19311 CALL GIRLS IN ESCORT SERVICE WE ARE PROVIDINGBerhampur 70918*19311 CALL GIRLS IN ESCORT SERVICE WE ARE PROVIDING
Berhampur 70918*19311 CALL GIRLS IN ESCORT SERVICE WE ARE PROVIDING
 
Puri CALL GIRL ❤️8084732287❤️ CALL GIRLS IN ESCORT SERVICE WE ARW PROVIDING
Puri CALL GIRL ❤️8084732287❤️ CALL GIRLS IN ESCORT SERVICE WE ARW PROVIDINGPuri CALL GIRL ❤️8084732287❤️ CALL GIRLS IN ESCORT SERVICE WE ARW PROVIDING
Puri CALL GIRL ❤️8084732287❤️ CALL GIRLS IN ESCORT SERVICE WE ARW PROVIDING
 
PHX May 2024 Corporate Presentation Final
PHX May 2024 Corporate Presentation FinalPHX May 2024 Corporate Presentation Final
PHX May 2024 Corporate Presentation Final
 

NC

  • 1. Contents lists available at ScienceDirect Tourism Management journal homepage: www.elsevier.com/locate/tourman Examining the relationship between tourist motivation and satisfaction by two competing methods Tahir Albayraka,∗ , Meltem Caberb a Akdeniz University, Tourism Faculty, Tourism Management Department, Campus, Antalya, Turkey b Akdeniz University, Tourism Faculty, Tourism Guidance Department, Campus, Antalya, Turkey A R T I C L E I N F O Keywords: tourist motivation Satisfaction Motivation-satisfaction relationship Rafting A B S T R A C T The relationship between tourist motivation and satisfaction has a long history of research, but continues to show contrary results. Based on two surveys on tourists undertaking a rafting activity while on holiday, the current study compares two approaches classified here as the Classic and Performance methods to clarify the relationship between motivation and satisfaction. The results of the Classic model which assumes a direct re- lationship between motivation and overall satisfaction show that motivation is not a significant determinant of overall satisfaction, if it is measured before the experience. In the Performance model, post experience moti- vation evaluation is introduced as the determinant of overall satisfaction. The results supported this proposition. A comparison of the models also reveals that the Performance model outperforms Classic model in terms of explaining overall satisfaction. 1. Introduction Motivation, as an important determinant of tourist behaviour, has been widely investigated by academics since the 1940s. Although some researchers have attempted to explore tourism and travel motivations of tourists, others have investigated its relationships with other con- structs, such as destination image (e.g. Li, Cai, Lehto, & Huang, 2010), destination loyalty (e.g. Huang & Hsu, 2009; Lee, 2010; Yoon & Uysal, 2005), destination brand personality (e.g. Murphy, Benckendorff, & Moscardo, 2007), and destination choice (e.g. Awaritefe, 2004; Devesa, Laguna, & Palacios, 2010). In particular, the motivation-satisfaction relationship has been a popular research interest of many scholars, since satisfaction has proven to have a positive influence on tourists’ post-purchase behaviour such as recommendations (e.g. Hui, Wan, & Ho, 2007; Prebensen, Skallerud, & Chen, 2010) and intention to revisit (e.g. Alegre & Cladera, 2009; Bigné, Andreu, & Gnoth, 2005). However, a literature review shows that researchers have used different approaches so far with the aim of investigating the relation- ship between tourist motivation and satisfaction. While one group of researchers tends to use motivation as the sole determinant of overall satisfaction (OS), a second group of researchers prefers to employ motivation and other variables together as the antecedents of OS. A third group of researchers seems to use the same items belonging to motivation for the measurement of respondents’ satisfaction. All of these approaches assume that there is a linear relationship between motivation and satisfaction. The review of previous literature obviously shows that determining the appropriate method(s) for explaining the motivation-OS relationship has become necessary today. The present paper focuses on the first and third approaches, since we did not at- tempt to examine any other variables (than motivation) that may have an influence on OS. We named the first approach as the Classic, and the third as the Performance methods. Accordingly, the first objective of this study is to compare Classic and Performance methods in terms of their explanatory power for OS. Another issue with the previous studies is the measurement time of motivation. While some researchers measure the motivation construct before the subject activity, others measure it afterwards. To the best of the authors’ knowledge, no published study addressed the importance of measurement time in identifying tourist motivations (whether it should be before or after the activity/experience). Thus, the need for a comprehensive study arises where the effect of measurement time of motivation on findings is particularly examined. Therefore, the second objective of this study is to investigate how motivation measurements before and after the activity affect research results. For achieving the aims of the study, two separate studies were conducted. In the first study (Study 1), both motivation and satisfaction were assessed after the activity. In the second study (Study 2), moti- vation was measured before the activity, while respondents’ satisfaction was determined after the activity. Such a research design enabled the authors to compare two methods (Classic and Performance), as well as https://doi.org/10.1016/j.tourman.2018.06.015 Received 6 March 2017; Received in revised form 11 June 2018; Accepted 14 June 2018 ∗ Corresponding author. E-mail addresses: tahiralbayrak@akdeniz.edu.tr (T. Albayrak), meltemcaber@akdeniz.edu.tr (M. Caber). Tourism Management 69 (2018) 201–213 0261-5177/ © 2018 Elsevier Ltd. All rights reserved. T
  • 2. to test the effect of measurement time of motivation on research find- ings. The paper continues with the description of the motivation and customer satisfaction concepts. Following this, the literature that in- vestigates the motivation-satisfaction relationship is summarised by clustering the studies into groups. Next, two competing methods which are derived from the literature are introduced. Then, the method of the research is explained. After the presentation of results from Study 1 and Study 2, the paper is concluded with a discussion of the theoretical and practical implications in regard to the findings. 2. The concept of tourist motivation and the methods used for its measurement Pincus (2004) notes that motivation had been a popular research topic in the ‘psychoanalytic studies in the 1950s and 1960s, and con- tinued to be investigated in the era of psychophysiology (1970s and 1980s)’. However, Dann (1981) criticised the previous studies about motivation, since this concept has been defined by ‘various allied terms, often employed as synonyms’ and there was no consensus about its definition. He suggested that ‘motivation tells us why an individual or group have behaved or are about to perform an action’ (Dann, 1981). Hence, motivations are generally considered to determine why people behave in a certain way, and to occur when people expect service providers to satisfy their needs (Mill & Morrison, 1998). Con- ceptualisation of motivation clearly shows that need, expectation, and satisfaction are closely related concepts with motivation. In particular, satisfaction and motivation terms are often confused (Dann, 1981). Although, satisfaction and motivation are distinct constructs, there is an indirect relationship between them (Fluker & Turner, 2000). A literature review by Kay (2003) shows that four main approaches were followed by the researchers in the examination of motivation: needs-based, values-based, benefits sought or realised, and expectancy theory. The needs-based approach suggests that a wide variety of needs motivate behaviour. The best-known examples of this school are Maslow's (1943; 1970) hierarchical needs theory, Murray's (1938) classification of needs theory, and McClelland's (1955) theory of learned needs. A values-based approach attempts to clarify motivations through the investigation and measurement of personal values. That approach enables researchers to predict the influence of personal values on motivation or behaviour, and to make market segmentations. A ‘benefits sought or realised’ approach considers an association between motivations and sought benefits from a purchase decision. These ben- efits may be attribute-based (e.g. tangible attributes of a destination), psychologically-based (e.g. emotional benefits expected from the ser- vice), or a combination of both. Expectancy theory, which is formulated in the work motivation context (Vroom, 1964), has been adapted to tourist motivation research. According to this approach, ‘people's mo- tivation to perform an activity is a function of the expectation that they will be able to perform the activity and obtain the desired outcomes, and the personal value of all outcomes associated with that activity’ (Hsu, Cai, & Li, 2010). Such a perspective enables the researchers to clarify which motivations related to values and expectations affect tourists' travel decisions and satisfaction. In addition to the above-mentioned approaches, the pull-push fra- mework (Dann, 1977) has been one of the most popular methods for identifying tourist motivations. In this theory, people are assumed to travel while they are ‘pushed by their own internal forces (push/in- trinsic factors), and pulled by the external forces of destination attri- butes (pull/extrinsic factors)’ (Khuong & Ha, 2014). In the tourism motivation studies that adapt a pull-push framework, ‘demand refers to motives (push factors) that sustain tourists’ desire, while supply relates to destination's characteristics (pull factors)’ (Mohammad & Som, 2010). Similarly, Iso-Ahola's (1982) motivational theory, which is known as Optimal Arousal Theory, suggests that people ‘seek’ activities that provide novel experiences and psychological rewards (internal/ seeking factors), allowing them to ‘escape’ from personal problems in their interpersonal world (external/escaping factors). This theory pro- poses a multi-motive approach, since both seeking and escaping moti- vations have personal and interpersonal components (Biswas, 2008). Iso-Ahola also suggested linking the internal factors to potential sa- tisfaction (Wolfe & Hsu, 2004). In the tourism and travel literature, tourist motivations are seen as determinants of tourist activities in respect of (i) the reasons for tra- velling, (ii) why a specific destination is selected, (iii) and the overall satisfaction with the trip (Castaňo, Moreno, García, & Crego, 2003). Herewith, tourist motivation measurement is seen as the key to sa- tisfying current visitors, to attracting more visitors, to predicting future demand, and to developing products to meet tourists' needs (Wolfe & Hsu, 2004). However, Bright (2008) notes that tourist motivation is an extremely complex area of research within the context of psychological theories. For this reason, theories of tourist motivation should be dy- namic and flexible across situations and tourists’ individual circum- stances (Pearce, 1993). 3. The concept of satisfaction and the methods used for its measurement Similar to the definition of motivation, there is no consensus re- garding the definition of satisfaction. Tian-Cole and Cromption (2003) noted two approaches in the conceptualisation of satisfaction, where the first is needs-based, and the second is appraisal-based. According to the needs-based definition, suggesting a close relationship between motivation and satisfaction, satisfaction ‘results from corresponding needs or motives being met’ (Tian-Cole & Cromption, 2003). This ap- proach emphasises satisfaction as a static state of fulfilment of needs or motives. For example, researchers (e.g. Herzberg, 1968) who suggest that employees' satisfaction is highest when job structures and duties are consistent with their personality needs, conceptualise job satisfac- tion as a need fulfilment (Hurlbert, 1991). In contrast, the appraisal approach does not consider motivation- satisfaction relationships. In this perspective, satisfaction has long been seen as ‘a comparison process between the expected and perceived experiences derived from participation in activities’ (Bultena & Klessig, 1969). This perspective gave inspiration to the expectancy-dis- confirmation paradigm (Oliver, 1980), in which satisfaction or dis- satisfaction has been measured by positive (confirmation: satisfaction) or negative (disconfirmation: dissatisfaction) gaps between expectancy and outcome levels. This approach suggests that satisfaction is a psy- chological outcome of a process where tourists compare their ex- pectations to their experiences or perceived benefits. Therefore, sa- tisfaction is described by the followers of appraisal theories as ‘an emotion resulting from appraisals (including disconfirmation, per- ceived performance, etc.) of a set of experiences’ (Babin & Griffin, 1998). Researchers have proposed several satisfaction theories (Oh & Parks, 1997), whereas Oliver (1980; 1981), and LaTour and Peat (1979) played leading roles in early literature (Woodruff, Cadotte, & Jenkins, 1983). One of these theories is Oliver's (1980) expectancy-dis- confirmation paradigm, as previously mentioned. Equity theory, which concerns people's sense of fairness, represents satisfaction as the ‘trade- off between what the customers sacrifice and what they obtain’ (Oliver & Swan, 1989). Attribution theory indicates a consideration of the locus. Other relevant theories are assimilation or cognitive dissonance, contrast, assimilation-contrast, comparison-level, generalised nega- tivity, and value-precept (Pizam & Ellis, 1999). In accordance with these theories, satisfaction construct can be conceptualised within both cognitive and emotional perspectives. While the cognitive perspective considers satisfaction as a post-ex- perience evaluation (which includes the antecedents of expectations, performance, disconfirmation, attribution, and equity/inequity) (Bowen & Clarke, 2002), the emotional perspective considers it as a T. Albayrak, M. Caber Tourism Management 69 (2018) 201–213 202
  • 3. Table 1 Previous studies about motivation satisfaction relationship. Authors Study context Highlights Variance explained (%) Data Collection Phase Classification in this paper Battour et al. (2012) Examines the mediating effect of overall tourist satisfaction between travel motivations (push and pull) and destination loyalty of Muslim tourists visiting Malaysia Push and pull factors were significant predictors of OS 44 During the vacation Motivation as the sole determinant of OS Lee and Hsu (2013) Examines the causal relationship between motivation, satisfaction and loyalty among Taiwanese tourists attending aboriginal festivals All motivation factors were significant predictors of OS 38 and 43 After the festivals Motivation as the sole determinant of OS Qiao, Chen, Guan, and Kim (2008) Identification of the Chinese tourists' motivations, satisfaction and the determinants of thier revisit intentions to Korea Push and pull factors were significant predictors of OS 43.3 and 40.8 After the vacation Motivation as the sole determinant of OS Lee et al. (2014) Investigates the relationship between volunteer motivation and support for the Expo 2012 Korea through mediating effects of satisfaction and attitudes toward volunteering. 2 out of 5 motivation factors were significant predictors of OS 35.5 During event Motivation as the sole determinant of OS Schofield and Thompson (2007) Investigates the motivations, satisfactions, and intentions to revisit of domestic and international visitors at 2005 Naadam Festival in Mongolia. 3 out of 5 motivation factors were significant predictors of OS 24.1 During the festival Motivation as the sole determinant of OS Yoon and Uysal (2005) Examines the relationships among the push and pull motivations, satisfaction, and destination loyalty of tourists in Northern Cyprus While pull motivations affect OS, push motivations do not influence 12 During the vacation Motivation as the sole determinant of OS Pan and Ryan (2007) Identifies the visit patterns, motivations, expectation of and satisfaction with destination attributes, overall satisfaction, intent to revisit and recommendation of the visitors in Pirongia Forest Park in New Zealand. Three separate regression analyses. 1 out of 5 push motivation factors; 1 out of 2 pull motivation factors; 2 out of 7 motivation factors influenced OS 12, 13, and 16 After the visit Motivation as the sole determinant of OS Prebensen et al. (2010) Investigates the causal relationships between travel motivations, satisfaction, and intention to communicate with others by word-of- mouth (WOM) of charter tourists from Norway 2 out of 4 motivation factors were significant predictors of OS 4 After the vacation Motivation as the sole determinant of OS Savinovic et al. (2012) Examines the relationships among motivation, satisfaction, and re- visit intentions of the audience members at the 2009 Festa–Croatian Food and Wine Festival in Adelaide, Southˆ Australia 2 out of 8 motivation factors were significant predictors of OS 5.8 During the festival Motivation as the sole determinant of OS Caber and Albayrak (2016) Identifies the motivations of rock climbing tourists in Antalya, Turkey and investigation of the relationship between motivation and overall satisfaction Two separate regression analyses. 2 out of 6 push motivation factors; 4 out of 5 pull motivation factors influenced OS 9.2 and 16.8 During the activity Motivation as the sole determinant of OS Tang (2014) Investigates the relationships between travel motivation, destination image and OS of international tourists visiting Sichuan province after the Wenchuan earthquake of 2008. Overall travel motivation which consist of 4 dimensions affects OS n.r. During the visit Motivation and additional variables as the determinant of OS Meng et al. (2008) Investigates the relationship between destination attribute importance and performance, travel motivation, and satisfaction of visitors at a nature-based resort destination located in Southwest Virginia, USA Out of 4 motivation, 4 performance, 4 importance factors; 1 motivation, 2 performance, 1 importance factors were significant predictors of OS 30.1 During the vacation Motivation and additional variables as the determinant of OS Huang et al. (2014) Examines the relationships between motivation, performance evaluation, satisfaction, and behavioural intentions of tourists at ‘Impressions of Liusanjie’ theatrical performance in China Motivation does not directly influence satisfaction. Motivation only affects tourists' satisfaction indirectly, via experiential evaluation and attribute evaluation. No direct influence After the experience Motivation and additional variables as the determinant of OS Ross and Iso-Ahola (1991) Identifies daily tour participants' motivations and satisfaction, visiting Washington They only report mean scores of motivation and satisfaction dimensions. n.a. Motivation before, satisfaction after the tour Usage of motivation items for measuring satisfaction Thomas and Butts (1998) Evaluates the leisure motivations and satisfactions of International Elderhostel participants on a trip to Budapest, Hungary They only report mean scores of motivation and satisfaction dimensions. n.a. During the visit Usage of motivation items for measuring satisfaction Severt et al. (2007) Assesses convention attendee motivations, performance evaluation, satisfaction, and behavioural intentions in a conference at United States 9 motivation items were used to measure conference performance. 2 performance factors related to motivation were significant predictors of OS. 45 During the conference Usage of motivation items for measuring satisfaction (continued on next page) T. Albayrak, M. Caber Tourism Management 69 (2018) 201–213 203
  • 4. response derived from an experience (del Bosque & San Martín, 2008). Some researchers consider satisfaction to be a subjective concept in relation to expectations, but objective in relation to product attributes or outcomes (Pizam & Ellis, 1999). A few researchers assume that sa- tisfaction is subjective in both the expectation and perception stages, and therefore is a totally psychological concept (Pizam & Ellis, 1999). In the recent cognitive-emotional perspective, satisfaction is ‘regarded as a multidimensional construct that contains both psychological and emo- tional factors’ (Correia, Kozak, & Ferradeira, 2013). In general, two different approaches for the measurement of sa- tisfaction are observed in the literature. The first one is unidimensional, and the other is a multidimensional method. Researchers who adopt a unidimensional framework generally use single or a few numbers of items for identifying overall satisfaction (mostly by reflecting ‘very satisfied’ to ‘very dissatisfied’ options). In this framework, overall sa- tisfaction reflects the cumulative experience of tourists that is generated by the weight of various attributes (Pizam, Neuman, & Reichel, 1978). In particular, researchers increasingly began to use multi-attribute methods in recent years which enable them to evaluate product or service attributes by relying on their impacts on overall satisfaction. In addition, an attribute-based approach enables researchers to consider customers' mixed feelings towards a product or a service (Mittal, Ross, & Baldasare, 1998). Because a customer can be both satisfied and dis- satisfied with different aspects of the same product (Vargo, Nagao, He, & Morgan, 2007). 4. The causal relationship between tourist motivation and satisfaction By following the needs-based approach, the motivation variable has been employed as the direct antecedent of tourist satisfaction by a number of researchers in tourism and travel literature (e.g. Battour, Battor, & Ismail, 2012; Lee & Hsu, 2013). These studies may be cate- gorized into three major groups. In the first group of studies, tourist motivation was used as the sole determinant of tourist satisfaction by the researchers. In the second group of studies, researchers used nu- merous variables that may affect satisfaction, in addition to motivation, for clarifying the motivation-satisfaction relationship. In the last group, researchers used the same items for measuring both motivation and satisfaction of the respondents. Table 1 summarises previous studies based on this categorisation. 4.1. Motivation as the sole determinant of overall satisfaction In the first group of studies, many researchers found a direct and significant relationship between tourist motivation and overall sa- tisfaction (OS). For example, Battour et al. (2012), who conducted a survey on Muslim tourists visiting Malaysia, highlighted that tourist motivation significantly affects OS. Their results showed that pull and push motivation factors explained 44% of the variation in OS. Lee and Hsu's (2013) study, conducted at two aboriginal festivals in Taiwan, confirms this relationship. The explained ratios of satisfaction by mo- tivation were 38% and 43% for these festivals, respectively. Another high explanation ratio of customer satisfaction by motivation was found in Qiao, Chen, Guan, and Kim's (2008) study which focused on Chinese tourists' motivations to visit South Korea. Two separate regression analyses showed that while 43.3% of OS was explained by five push motivation factors, the ratio was 40.8% for four pull motivation factors. Although these authors aimed to measure tourists' travel motivations, their study data were collected at the airport while participants were leaving South Korea. In another study, Lee, Reisinger, Kim, and Yoon (2014) – after identifying the volunteer motivation in Expo 2012 Korea – examined the relationships amongst motivation, satisfaction, and participants' attitudes towards volunteering by using a research model. Their findings showed that altruism, patriotism, extrinsic and intrinsic factors were the dimensions of motivation to volunteer in that mega- Table 1 (continued) Authors Study context Highlights Variance explained (%) Data Collection Phase Classification in this paper Kao et al. (2008) Explores the motivations and satisfactions of Taiwanese visitors to Australia by using push and pull framework They compared the motivations and satisfactions (related to motivations) of the respondents. n.a. Motivation before, satisfaction after the visit Usage of motivation items for measuring satisfaction Fluker and Turner (2000) Compares the needs, motivations, and expectations of the experienced and non-experienced rafting participants Same motivation items were used in the past tense after the activity to find out whether the respondents' expectations had been met or not. n.a. Motivation before, satisfaction after the experience Usage of motivation items for measuring satisfaction Correia, Kozak, and Ferredeira (2013) Explores the concept of push and pull satisfaction and relates it with OS by using tourists visiting Lisbon Same motivation items were used for measuring satisfaction. 3 satisfaction factors related to motivation were significant predictors of OS n.r. After the visit Usage of motivation items for measuring satisfaction n.a.: not applicable; n.r.: not reported. T. Albayrak, M. Caber Tourism Management 69 (2018) 201–213 204
  • 5. event. However, out of four motivation factors, only patriotism and intrinsic motivation had a significant impact on satisfaction, explaining 35.5% of this construct. In the sample from Mongolia, Schofield and Thompson (2007) investigated festival attendants' motivations. The results showed that only three factors out of five (sport attractions, exploration of culture, and local activities) had significant influences and explained 24% of OS. Contrary to the above-mentioned studies that found a strong re- lationship between tourist motivation and OS, a number of studies re- vealed a weak relationship between these variables. For example, Yoon and Uysal (2005) who investigated the impact of the pull and push motivations of 148 tourists visiting Northern Cyprus, both on satisfac- tion and loyalty, found that visitors' motivation explained 12% of the variance in tourist satisfaction. Interestingly, while tourist satisfaction was negatively affected by pull motivations, the data did not support the effect of push motivations. In another study, Pan and Ryan (2007) measured the motivations of 205 tourists visiting a forest park in New Zealand by using a push and pull motivation framework, and examined the impact of motivational factors on OS with three separate regression analyses. In the first regression model, which explains 12% of OS, only ‘relaxation’ out of the five push motivation factors was found to have a statistically significant impact. In the second model, the authors used two pull motivation factors as the determinant of OS. While ‘infra- structure’ was found to be the sole significant predictor of OS, the model explained 13% of OS. The authors used both push and pull motivation factors in the third regression model which explained only 16% of OS. In the case of the Norway sample, Prebensen et al. (2010) in- vestigated tourist motivation to visit sun and sand destinations, and its effect on satisfaction. They conceptualised motivation as a body and mind related construct. Their study findings showed that two mind- related motivations (i.e. escapism, or culture and nature) were the antecedents of OS by explaining 4% of this variable. In contrast, body- related motivations (i.e. sun and warmth, or fitness and health) did not have any significant impact on OS. In the context of an ethnic minority cultural festival, Savinovic, Kim, and Long (2012) obtained similar findings to Prebensen et al. (2010) regarding the effect of motivation on satisfaction. Their results indicated that only 5.8% of the total variance for the estimation of festival visitors' OS was explained by two out of eight motivation factors (‘knowledge and education’ and ‘family to- getherness’). In a recent study, by using pull and push motivation fac- tors, Caber and Albayrak (2016) also obtained low explained variance for OS. Two separate regression analyses results revealed that 9.2% and 16.8% of OS were explained by push and pull motivation factors, re- spectively. The common characteristics of the first group of studies are (i) using motivation as the sole determinant of OS, and (ii) collecting data either during or after the activity (see Table 1). However, most of such studies fail to explain the direct effect of motivation on OS, since they obtained very low explained variance ratios for OS as mentioned above. Schofield and Thompson (2007) explain the reason for obtaining low explanation ratios in terms of the indirect relation between motivations and OS. In other words, as Huang, Luo, Ding, and Scott (2014) noted, motivations influence product evaluations, which in turn affect OS. 4.2. Motivation and additional variables as the determinants of OS To shed light on the basis of customer satisfaction, the second group of researchers have used motivation and some additional variables in their research models. For example, Tang (2014) examined the re- lationships among tourist motivation, destination image, and satisfac- tion after the 2008 Sichuan, China earthquake. Results showed that tourist motivation was influenced both by positive and negative images of the destination. In addition, tourist motivation and positive/negative images were identified as the significant predictors of tourist satisfac- tion. However, apart from Tang (2014), researchers in this group could not find a relationship between motivation and satisfaction. For ex- ample, Meng, Tepanon, and Uysal (2008) proposed that overall tourist satisfaction was a function of destination attributes’ importance, their performance, and tourist motivation. They conducted regression ana- lysis for examining this hypothesis by using four importance, four performance, and four motivation factors as the independent variables, and customer satisfaction as the dependent variable. Their findings showed that out of 12 determinants, only two performance factors, one importance factor, and one motivation factor significantly associated with customer satisfaction. However, the significance level of the mo- tivation factor was 0.096. Thus, it can be concluded that the motivation factors were not predictors of customer satisfaction, since that sig- nificance value - which is above 0.05 – is not considered acceptable by most researchers. In a recent study in China, Huang et al. (2014) in- vestigated the relationships amongst motivation, experimental evalua- tion, attribute evaluation, satisfaction, and behavioural intention, using a structured model. They found that motivation had no direct, but an indirect and significant impact on satisfaction via experimental eva- luation, and attribute evaluation. 4.3. Usage of motivation items for measuring attribute-level satisfaction The third group of researchers attempted to explain the motivation- satisfaction relationship by using the same motivation items for asses- sing respondents' satisfaction with the experience (e.g. Ross & Iso- Ahola, 1991; Thomas & Butts, 1998). For example, Thomas and Butts (1998) evaluated the leisure motivations and satisfaction levels of in- ternational Elderhostel tourists. In the first stage, leisure motivations of the participants were measured before the experience by using a leisure motivation scale. After the experience, interestingly, the researchers used the same motivation items for assessing participants' satisfaction. Similarly, Severt, Wang, Chen, and Breiter (2007) measured congress attendants' performance perceptions with nine items selected from 20 motivation items. Then, by using factor analysis with these nine per- formance items, they obtained ‘educational benefits’ and ‘activities and opportunities’ as the underlying dimensions of the attendees' evaluation of the conference performance. Finally, the influence of these dimen- sions on attendants' OS was examined by a research model. Another interesting approach was used by Kao, Patterson, Scott, and Li (2008), who investigated the motivation and satisfaction of Taiwa- nese tourists visiting Australia. The researchers measured participants' motivation before their arrivals to Australia by using the pull-push motivation framework. Then, during the return flight, participants were requested to state their satisfaction by answering the same items that were already used for the measurement of motivation. By using parti- cipants’ motivation means as the importance levels, and their satisfac- tion means as the performance levels, the researchers conducted an importance-performance analysis. By using the SERVQUAL Model, Fluker and Turner (2000) aimed to explore whether the needs, motivations, and expectations of the ex- perienced and inexperienced rafting participants were met after the activity. With this purpose, the researchers measured participants' motivation before the experience as the expectation variable. After the experience, they measured the same participants’ perceptions about the experience by using the same motivation items in the past tense. Re- cently, Correia et al. (2013) measured the push and pull motivations and satisfaction of 400 tourists visiting Lisbon by using the same items. Then, they investigated the effect of push and pull satisfaction factors on OS by using a structural equation model. Their results showed that all factors were significant predictors of OS. One interesting result in their study was that tourist motivation and satisfaction, which were measured simultaneously after the visit, were found to be significantly correlated at a 0.01 level. To summarise, in some previous studies, items that were used for the measurement of motivation were also employed for clarifying the satisfaction of the respondents. T. Albayrak, M. Caber Tourism Management 69 (2018) 201–213 205
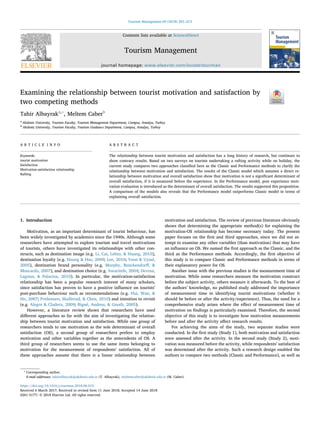
  • 6. 5. Competing methods for the examination of motivation- satisfaction relationship The current study, which aims to better understand the relationship between motivation and satisfaction, compares two competing methods, namely the Classic and the Performance Methods. These methods are explained below, respectively. Classic Method suggests a direct relationship between motivation and satisfaction (see Fig. 1). According to this method, motivations of tourists through an activity (M) directly influence their overall sa- tisfactions (OS). This method can be depicted as: OS = f (M) Performance Method assumes that the post-experience motivation evaluation (PostME) of tourists about an activity determines overall satisfaction (see Fig. 2). This method can be written as: OS = f (PostME) 6. Method 6.1. Research setting For achieving the objectives of the research, data were collected from tourists who took a daily rafting tour in Köprülü Canyon in Antalya, Turkey. Köprülü Canyon became a National Park in 1973, and has almost 36,614 ha of forest area. Along its valley, which is 14 km long and 100 m high, visitors join the rafting tours organised by local travel agencies. It is estimated that almost 7000 people in a day come to the Canyon in the summer season, mainly for rafting. The majority of the international tourists who raft in Köprülü Canyon are from the Russian Federation and Germany. This National Park was selected as a suitable area for carrying out a comparative study as the interviewers were able to reach tourists at the starting (before the experience) and finishing points (after the experience) of the rafting tours. 6.2. Research design Since motivation is a psychological need or desire that stimulates a person's behaviour (Dann, 1981), it should intrinsically be measured before the experience. However, it is sometimes difficult to reach people before their experiences. Thus, most researchers (see Table 1) have measured respondents' motivations during or after the activities. In order to assess how the measurement time of motivation affects the obtained results, in the present research, two separate studies were performed. In the first study, both the motivations and the post-ex- perience motivation evaluations of the respondents were measured si- multaneously after the experience. In the second study, while re- spondents' motivations were measured before the experience, post- experience motivation evaluations were identified after the experience. By using data obtained from both studies, we were able to separately test two competing methods (which are explained in the previous section) and compare their capacities to explain overall satisfaction. Fig. 3 reflects the research design used in this study. 6.3. Measures The respondents' rafting participation motivations were identified using a shorter form of Beard and Ragheb's (1983) Leisure Motivation Scale which consists of 32 items. This scale was selected for several reasons. First, rafting participants had limited time to complete the questionnaire. Second, this scale is widely used, and its validity in identifying participant motivations has already been confirmed by re- searchers in various research settings, such as long-distance nature trekking (den Breejen, 2007), natural park visits (Pan & Ryan, 2007), holidays (Mohsin, 2008), sports (Yusof, Omar-Fauzee, Shah, & Geok, 2009), and adventure activities (Inui, Lankford, & Lankford, 2004). Third, it has high validity and reliability in exploring tourist motiva- tions (Ryan & Glendon, 1998). To measure the post-experience motivation evaluations of the par- ticipants, motivation items were structured in the past tense, as Fluker and Turner (2000) did in their study. For example, motivation item of ‘to explore new ideas’ was changed into ‘I explored new ideas’. In ad- dition, three items that measured participants' overall satisfaction with rafting activity were derived from Wu and Liang's (2011) study. Participants' motivation, post-experience motivation evaluations, and overall satisfaction were measured with a 7-point Likert-type scale (1: completely disagree, 7: completely agree). The original English scales were translated into German by a professional translator. Translation equivalence was established by another translator's back translation of the items into English from German, and by the com- parison of items with their originals. Since Germany is the major market for Antalya in terms of international tourist arrivals, the target sample of this study was German tourists. Selection of one nationality as the sample also enabled the authors to avoid any equivalence problems that may occur in case of using cross-national data. After the translations, three questionnaires were designed to collect data in Study 1 and Study 2. Questionnaire 1 comprises motivation, post-experience motivation evaluation, overall satisfaction items, and six demographic questions. Questionnaire 2 includes motivation items and demographic questions. Questionnaire 3 consists of post-experience motivation evaluation and overall satisfaction items. Before the data collection in both studies, a pilot study was con- ducted with the participation of 40 tourists in order to test the appro- priateness, and applicability of the research instruments. Based on the pilot study results, some items were modified, and the questionnaires were made ready for the data collection phase. 7. Study 1 7.1. Research design In the first study, respondents’ motivations, post-experience moti- vation evaluations, and overall satisfaction were measured simulta- neously after the rafting activity by using Questionnaire 1, which contains all of these variables. The reason for measuring motivations after the activity was to in- vestigate the effect of measurement time of motivations on the results. With this purpose, the results of Study 1 (whereas motivations were measured afterwards) and Study 2 (whereas motivations were mea- sured beforehand) were planned to be compared to each other. 7.2. Data collection procedure To collect empirical data for the Study 1, a convenience sampling method was used with the support of five local travel agencies. The manager of each company was informed about the aim of the research and data collection process. After the authors got approval from the Fig. 1. Classic method. Fig. 2. Performance method. T. Albayrak, M. Caber Tourism Management 69 (2018) 201–213 206
  • 7. companies, Study 1 was performed in the period from 15th August to 15th October 2015. While tourists were having lunch after the experience at a restaurant in the area, two graduate students, who received training regarding the data collection, approached, and explained the aim of the research to them. Volunteer German tourists were requested to participate to the study. Although 349 questionnaires were collected in total, after the elimination of incomplete forms, 319 questionnaires remained, which were analysed by SPSS 18.0 and LISREL 8.80. 7.3. Sample characteristics Participants’ demographic characteristics are shown in Table 2. Results indicated that the majority of the respondents were married (55.4%) males (56.7%) who had a high school level education (48.4%). Many of the participants were working as company employees (33.0%) or were retired people (32.1%). Surprisingly, 40.3% of the sample consisted of people aged 53 and above. They preferred to raft mostly with their friends (38.9%) and family members (37.2%). Moreover, 73.7% of the participants had no previous experience in rafting. 7.4. Results of study 1 First, with the purpose of obtaining the underlying dimensions of rafting motivation, 32 motivation items were factor analysed using principal component analysis with varimax rotation. Items with cross loadings or low communalities were dropped. Moreover, items that had below 0.707 (square root of 0.5) factor loadings were eliminated to ensure construct validity (Shimp & Sharma, 1987). This reduced the original number of 32 motivation items to 13. By using these items, four Fig. 3. Research Design. M: motivation; PostME: post-experience motivation evaluation; OS: overall satisfaction. Table 2 Sample characteristics of study 1 (N = 319). Characteristics % Gender Male 56.7 Female 43.3 Marital status Married 55.4 Single 44.6 Occupation Company employee 33.0 Public services 6.6 Student 7.9 Employer 6.3 Retired 32.1 Other 14.1 Age Below than 18 1.0 Between 18 and 34 years 35.8 Between 35 and 52 years 22.9 53 and above 40.3 Education level Secondary school and below 17.4 High school 48.4 University 22.2 Other 4.1 Companion Family member(s) 37.2 Friend(s) 38.9 Relative(s) 5.7 Alone 18.1 Previous experience Yes 26.3 No 73.7 T. Albayrak, M. Caber Tourism Management 69 (2018) 201–213 207
  • 8. factors were obtained, which explained 74.46% of the variance in motivation. The factors were named according to the items that they contained. The eigenvalues ranged from 3.41 to 1.65. The internal consistency of the factors was evaluated by using Cronbach's alpha, and all met the cut off value of 0.70, ranging from 0.775 to 0.881 (see Table 3). In addition to factor analysis results, Table 3 presents the mean values belonging to motivation items (M). To compare the competing methods, structural equation modelling was employed. Two research models were constructed one for evalu- ating classic method and other for performance method by using the same factorial structure obtained from principal component analysis. While in the first model motivation dimensions were used as the de- terminant of OS, in the second model post-experience motivation eva- luation dimensions were used. The research models were separately tested using a two stage analysis, as suggested by Anderson and Gerbing (1988). First, the measurement model was developed by conducting a confirmatory factor analysis (CFA) to validate the constructs. While the initial goodness-of-fit indices were not acceptable, adding a covariance between “relax physically” and “relax mentally” error terms which is suggested by modification indices allowed to obtain a better model fit. Since both items contain the word “relax”, they might have similar error in their measurement. The modified goodness-of-fit indices of the CFA for both classic (χ2 = 213.37, df = 93, GFI = 0.93, RMSEA = 0.070, NFI = 0.95, and CFI = 0.97) and performance (χ2 = 220.22, df = 93, GFI = 0.92, RMSEA = 0.064, NFI = 0.95, and CFI = 0.97) models were satisfactory (Iacobucci, 2010). For both models, composite reliability, convergent and discriminant validity of the constructs are displayed in Appendix 1. Second, the structural equation paths were estimated to test the research models. The structural models displayed a good fit with the data, compared with the suggested fit criteria (for classic model: χ2 = 213.37, df = 93, GFI = 0.92, RMSEA = 0.064, NFI = 0.95, and CFI = 0.97; for performance model: χ2 = 220.22, df = 93, GFI = 0.92, RMSEA = 0.066, NFI = 0.95, and CFI = 0.97). In addition, classic and performance models were compared with their nested models. Exogenous variables were removed respectively from the full model (i.e. research model) in order to build a series of nested models. χ2/df and RMSEA indices clearly show that full models are the best fitted models. Appendix 2 presents the comparisons of the nested models. Table 4 shows beta values of the exogenous variables and explained variance of the endogenous variable (OS), as well as the means of exogenous variables for both models. Classic model results indicate that three motivation factors are positively related, and one factor is negatively related to OS, explaining 39% of the variance. As depicted in Table 4, for the performance model, three out of four predictors have direct effect on OS by explaining 37% of the variability. As both Classic and Performance models explain almost equal var- iation in customer satisfaction, the relationships between the in- dependent variables in both models were investigated. As shown in Table 5, all calculated correlation coefficients are significant, and vary between 0.259 and 0.508. These coefficients show a strong relationship (as suggested by Hair, Anderson, Tatham, & Black, 1998) between motivation (M) and post-experience motivation evaluations (PostME), which were measured simultaneously. Table 3 Factor Analysis Results of Study 1. (in which motivations were measured after the rafting activity). M Mean Intellectual Social Competence/Mastery Stimulus avoidance To explore new ideas 4.64 .798 To learn about myself 4.66 .878 To expand my knowledge 4.66 .839 To be socially competent and skilful 4.63 .812 To gain a feeling of belonging 4.86 .882 To develop physical skills and abilities 4.63 .779 To keep in shape physically 4.70 .855 To use my physical abilities 4.70 .803 To relax physically 4.44 .824 To relax mentally 4.50 .815 To avoid the hustle and bustle of daily activities 4.28 .828 To rest 4.39 .855 To relieve stress and tension 4.53 .782 Variance explained (%) 18.24 12.74 17.18 26.30 Cronbach Alpha Reliability .855 .775 .812 .881 KMO: 0.788; Bartlett's Test of Sphericity: 2001.33 (0.000); M: motivation. Table 4 Results of model comparison for study 1. Classic Model Performance Model Path/Fit M Mean Beta values t values PostME Mean Beta values t values Intellectual 4.66 .14 2.18** 4.80 .05 .85 (n.s.) Social 4.75 .18 2.55** 4.97 .22 2.73* Competence/ Mastery 4.68 .43 6.05* 4.81 .41 5.57* Stimulus avoidance 4.43 −.20 −3.77* 4.55 −.32 −5.56* χ2 /df 2.29 2.36 RMSEA .064 .066 GFI .92 .92 R2 (OS) .39 .37 *p < .01; **p < .05; n.s.: not significant; M: motivation; PostME: post-ex- perience motivation evaluation. OS: overall satisfaction. Table 5 Relationships between constructs. Correlation coefficient M (Intellectual) - PostME (Intellectual) .508* M (Social) - PostME (Social) .331* M (Competence/Mastery) - PostME (Competence/ Mastery) .259* M (Stimulus avoidance) - PostME (Stimulus avoidance) .482* *p < .01. T. Albayrak, M. Caber Tourism Management 69 (2018) 201–213 208
  • 9. 8. Study 2 8.1. Research design In Study 2, participant motivations were measured before the rafting activity by using Questionnaire 2, containing motivation items and demographic questions. Then, the same participants’ post-experi- ence motivation evaluations and overall satisfactions were identified after the activity by using Questionnaire 3. 8.2. Data collection procedure Five local travel agencies which supported Study 1 also gave per- mission to the authors for the data collection in Study 2. Two graduate students joined all of the tourist transfers from hotels to the rafting area, organised by supporting travel agencies. Students explained the ob- jectives of the study to German tourists and solicited their participation, which began with completing Questionnaire 2 prior to the rafting trip. Participants wrote their names on forms so that the researchers could match the questionnaires completed by the same participants at pre- and post-activity. After the rafting experience, Questionnaire 3 was distributed to the same participants during the lunch break. In total, 425 questionnaires were obtained between 15th June and 15th September 2015 by using a convenience sampling method. After the elimination of incomplete forms, 375 fully answered questionnaires remained for the analyses, conducted by SPSS 18.0 and LISREL 8.80. 8.3. Sample characteristics The main demographic characteristics of the respondents are pre- sented in Table 6. Gender distribution of the respondents was 59.1% males, and 40.9% females, and the majority of participants (55.6%) were single. Most participants had a high school (45.2%) or university (38.7%) level of education, and 44.2% were working as company em- ployees. The majority of the participants were participating in the rafting activity with their family members (57.2%). Half of the re- spondents were aged between 18 and 34 years (50.9%). A considerable share of tourists had no previous experience in rafting (71.3%). 8.4. Results of study 2 Following the same procedure as in Study 1, an exploratory factor analysis was conducted on data obtained in Study 2 using the same items from the Study 1 analysis. The results yielded four factors ex- plaining 79.19% of the variance. The Cronbach's alpha coefficients ranged from 0.820 to 0.900, indicating strong internal reliability. Table 7 shows mean values belonging to motivation items (M), as well as factor analysis results. As in Study 1, to compare the competing methods, two research models were constructed one for classic method other for performance method. For classic method, the measurement model comprised four motivation dimensions and OS, for performance method, it consists of four post-experience motivation evaluation dimensions and OS. Similar to Study 1, a covariance was added between “relax physically” and “relax mentally” error terms. The obtained CFA results for both classic (χ2 = 244.84, df = 93, GFI = 0.92, RMSEA = 0.066, NFI = 0.97, and CFI = 0.98) and performance (χ2 = 298.86, df = 93, GFI = 0.91, RMSEA = 0.077, NFI = 0.94, and CFI = 0.96) models provided a good fit for each measurement model. Appendix 3 shows composite relia- bility, convergent and discriminant validity of both models. Following the confirmatory factor analyses, the structural models were tested. The goodness of fit indices for both research models in- dicated that the models fitted the data (for classic model: χ2 = 244.84, df = 93, GFI = 0.92, RMSEA = 0.066, NFI = 0.97, CFI = 0.98; for performance model: χ2 = 298.86, df = 93, GFI = 0.91, RMSEA = 0.077, NFI = 0.94, CFI = 0.96). Similar to Study 1, the comparisons of classic and performance models with their nested models show that full models (i.e. research models) are the best fitted models (Appendix 4). Classic model results showed that motivation factors are not the significant determinants of OS. The performance model, which employs post-experience motivation evaluation as the predictor of OS explains more variance in OS (30%) than the classic model (10%). In contrast to the classic model, three out of four independent variables have a sig- nificant effect on OS in the performance model (Table 8). 9. Conclusions Despite the increasing attention and interest in the last couple of decades surrounding tourist motivation and its relationship with sa- tisfaction, the majority of the previous studies investigating the direct influence of motivation on OS obtained a low explanation ratio for OS (e.g. Pan & Ryan, 2007; Yoon & Uysal, 2005). Schofield and Thompson (2007) argued that the main shortcoming of the previous studies was connecting motivation to OS directly, even though these are indirectly related. Moreover, motivation appears at the initial stage of the cus- tomer decision process, while satisfaction occurs as a post-experience evaluation. 9.1. Summary of the findings The current study, which is designed to examine the relationship between motivation and satisfaction, compares the results of two competing methods (i.e. Classic and Performance) by conducting two separate surveys. In the first survey, motivation was measured after the activity, as was the case in much of the previous research. Both the Classic and Performance methods explained a considerable amount of the variation in OS (39% and 37%, respectively). Although at first glance the results of the first survey reflect a high and direct relation- ship between motivation and OS, it should be noted that motivation was measured after the activity in Study 1. Measuring motivation after Table 6 Sample characteristics of study 2 (N = 375). Characteristics % Gender Male 59.1 Female 40.9 Marital status Married 44.4 Single 55.6 Occupation Company employee 44.2 Public services 6.5 Student 19.9 Employer 5.7 Retired 10.8 Other 12.9 Age Below than 18 4.8 Between 18 and 34 years 50.9 Between 35 and 52 years 31.2 53 and above 13.1 Education level Secondary school and below 7.2 High school 45.2 University 38.7 Other 8.9 Companion Family member(s) 57.2 Friend(s) 25.0 Relative(s) 5.0 Alone 12.8 Previous experience Yes 28.7 No 71.3 T. Albayrak, M. Caber Tourism Management 69 (2018) 201–213 209
  • 10. the activity might have meant that participants answered motivation items by considering their general evaluations about the experience. In order to clarify this issue, the relationship between motivation and PostME was investigated for each of the factors. The varying values of correlation coefficients between 0.259 and 0.508 confirmed that there was a relationship between motivation and PostME. In the second survey, inherently, motivation was measured before the activity, and post-experience motivation evaluation was identified after the activity. The results of the Classic Method, which suggests a direct relationship between motivation and OS, revealed that motiva- tion explained only 10% of the variation in OS. In addition, none of the motivation factors had a significant effect on OS. The Performance Method suggests that PostME is the antecedent of OS. The results of the Performance Method showed that three out of four factors belonging to PostME were significant predictors of OS. This model explained 30% of the variation in OS which was higher than that seen in the Classic Method. 9.2. Theoretical and practical contributions To date, motivation has been widely studied by academics, and should be investigated continuously in the future to further under- standing of tourist behaviour. The primary problem in the existing lit- erature, which is also the focus of this paper, emerges from linking motivations directly to OS. As a matter of fact, motivation is related to the initiation of the behaviour, while satisfaction measures psycholo- gical outcomes after the experience (Snepenger, King, Marshall, Marshall, & Uysal, 2006). In addition, the concept of the ‘customer buying process’, which was first introduced by Engel, Kollat, and Blackwell (1968), suggests no direct connection between motivation and satisfaction. In this pattern, the customers are assumed to follow a cognitive process starting from need recognition. Further, the moti- vated customers ‘engage in selecting, purchasing, and using products or services to satisfy need(s) and desire(s)’ (Zanoli & Naspetti, 2002). Thus, satisfaction or dissatisfaction is a post-purchase behaviour, formed only after the experience. In this regard, it would be an in- appropriate approach to relate customer motivation to OS directly. More clearly, if researchers investigate the direct impact of motivations on OS, it means that they will attempt to connect two unrelated con- structs to each other. Such an attempt, for example, will mean linking the cognitive representation of the ‘I want to participate in rafting to explore new ideas’ item with the ‘I was satisfied from the rafting ex- perience’ item, in this particular rafting case. Thus, we propose ‘post- experience motivation evaluation’ (PostME) concept. Such a variable is necessary, because motivations do not have a direct impact on OS, while they have influence on attitudes such as experience evaluations, which are the antecedents of OS (Huang et al., 2014). In the meantime, the findings of this study provide empirical evi- dence that PostME is a better predictor of OS than motivation which is measured before the experience (as seen in Study 2). Thus, the authors of this study recommend using PostME, which consists of past tense versions of motivation items, for investigating the relationship between motivation and OS. Similar to this proposition, some researchers pre- viously used motivation items for measuring respondents' satisfaction related to motivations (Fluker & Turner, 2000; Kao et al., 2008; Thomas & Butts, 1998). However, they did not relate satisfaction with motiva- tions to OS. Only Correia et al. (2013), who measured respondents' satisfaction through motivation items, used the term ‘desire con- gruency’ to evaluate to what extent the expectations (i.e., motivations) of respondents were confirmed. The authors found that OS was de- termined by satisfaction related to push and pull motivations, similar to the current study's findings. A unique contribution of this research is investigating the effect of the timing of motivation measurement on outcomes. The results re- vealed that a small amount of the variation in OS could be explained by motivation factors when they were measured before the experience. In addition, motivation factors did not emerge as the predictors of OS when they were measured before the experience. On the contrary, Table 7 Factor Analysis Results of Study 2. (in which motivations were measured before the rafting activity). Items M Mean Intellectual Social Competence/Mastery Stimulus avoidance To explore new ideas 4.35 .831 To learn about myself 4.36 .822 To expand my knowledge 4.82 .760 To be socially competent and skilful 4.39 .821 To gain a feeling of belonging 4.70 .777 To develop physical skills and abilities 4.67 .782 To keep in shape physically 4.60 .834 To use my physical abilities 4.71 .841 To relax physically 4.03 .825 To relax mentally 4.15 .773 To avoid the hustle and bustle of daily activities 3.70 .829 To rest 3.69 .886 To relieve stress and tension 4.21 .722 Variance explained (%) 18.88 12.72 20.10 27.49 Cronbach Alpha Reliability .863 .820 .900 .895 KMO: 0.883; Bartlett's Test of Sphericity: 3094.03 (0.000); M: motivation. Table 8 Results of model comparison for study 2. Classic Model Performance Model Path/Fit M Mean Beta values t values PostME Mean Beta values t values Intellectual 4.53 .17 1.57 (n.s.) 4.47 .14 1.99** Social 4.54 .03 .31 (n.s.) 4.93 .41 4.83* Competence/ Mastery 4.67 .11 1.15 (n.s.) 5.04 .07 .91 (n.s.) Stimulus avoidance 3.94 .04 .61 (n.s.) 4.37 −.18 −3.19* χ2 /df 2.63 3.21 RMSEA .066 .077 GFI .92 .91 R2 (OS) .10 .30 *p < .01; **p < .05; n.s.: not significant; M: motivation; PostME: post-ex- perience motivation evaluation. OS: overall satisfaction. T. Albayrak, M. Caber Tourism Management 69 (2018) 201–213 210
  • 11. motivation factors emerged as the strong predictors of OS when they were measured after the experience. To the best of our knowledge, most studies which have investigated the motivation-satisfaction relationship measured respondents’ motivation during or after the activity. Measuring motivation – which is a pre-experience concept – during or after an activity may lead to participants taking into account their evaluations of the experienced activity. In this study, the obtained correlation coefficients between motivation and PostME (when moti- vation and PostME were measured simultaneously after the experience in Study 1) confirm this issue. Similarly, Correia et al. (2013) obtained significant correlations between motivation and satisfaction, when measuring these constructs by using the same items simultaneously after the experience. In addition, Nowacki (2009) argues that measuring motivation after the experience ‘is loaded with too large an error because of benefits gained, which disrupt the original picture of motivation’. In fact, mo- tivations of the respondents may change during the experience (Battour et al., 2012). Therefore, previous studies which attempted to determine motivation during or after an activity might have actually measured PostME instead of motivation. That might be the reason why some of these studies obtained a high explanation ratio for OS. We recommend the measurement of motivation before the experience. More specifi- cally, in the tourism literature, holiday motivations should be measured not during or after the holiday experience, but before the experience. 9.3. Limitations and directions for future research Future research will be needed to assess the generalisability of the study's findings. Since the study sample consisted of only rafting par- ticipants, competing methods which were compared in this study should be tested in different samples such as national park visitors, conference participants, and destination visitors to verify the findings. Moreover, in this study, Leisure Motivation Scale (Beard & Ragheb, 1983) was used to measure respondents' motivations. The findings should be tested by using other motivation scales. In the current study, we focused on selecting the items that were deemed to be re- presentative of tourists' rafting motivation. With this purpose, an iterative elimination process and a wide variety of item elimination criteria were used. For example, items were eliminated which had loadings below the recommended cut-off value (≥0.707), or dual- factor loadings, or low communalities. Moreover, to obtain the same factor solutions in the analyses of Study 1's and Study 2's data, 19 items in each have to be eliminated from the scale. Following such strict principles can be seen as a limitation of this study. Contributions of the authors Tahir Albayrak proposed the research theme, designed the research methodology, made the data analyses. He writes some sections of the paper. He also revised the manuscript. Meltem Caber contributed to the design of the whole paper and to the data analyses. She writes some sections of the paper. She also re- vised the manuscript. Acknowledgement This paper was produced from project (number: SBA-2015-882) supported by the Scientific Research Projects Coordination Unit of Akdeniz University. Appendix 1. Validity of the Constructs for Study 1 (classic/performance model) Variables CR AVE 1 2 3 4 5 (1) Intellectual .89/.84 .74/.64 .86/.80 (2) Social .82/.78 .69/.64 .41/.49 .83/.80 (3) Competence/Mastery .86/.84 .67/.64 .47/.36 .40/.46 .82/.80 (4) Stimulus avoidance .88/.86 .60/.55 .17/.25 .18/.11 .17/.30 .77/.74 (5) Overall satisfaction .93/.93 .81/.81 .51/.47 .40/.40 .41/.25 -.02/-.12 .90/.90 CR: composite reliability; AVE: average variance extracted. Bold diagonal values are square root of AVE; others are correlation coefficients. Appendix 2. The Comparisons of the Nested Models for Study 1 χ2 df χ2 /df RMSEA Δχ2 (Δdf) Study 1-Classic model Full model 213.37 93 2.29 .064 Model 1 145.75 58 2.51 .069 67.67 (35) a,b Model 2 116.02 40 2.90 .077 97.35 (53) a,b Model 3 80.55 18 4.47 .105 132.82 (75) a,b Study 1-Performance model Full model 220.22 93 2.36 .066 Model 1 132.50 58 2.28 .064 87.72 (35) a,b Model 2 111.27 40 2.78 .075 108.95 (53) a,b Model 3 69.42 18 3.85 .095 150.80 (75) a,b Intellectual, Social, Competence/Mastery, and Stimulus avoidance are the determinants of OS in the full model. Model 1: without Intellectual path. Model 2: without Intellectual and Social paths. Model 3: without Intellectual, Social, and Competence/Mastery paths. a χ2 difference test was computed against the full model. b χ2 difference test was significant at .01 level. T. Albayrak, M. Caber Tourism Management 69 (2018) 201–213 211
  • 12. Appendix 3. Validity of the Constructs for Study 2 (classic/performance model) Variables CR AVE 1 2 3 4 5 (1) Intellectual .82/.84 .61/.63 .78/.79 (2) Social .77/.80 .63/.67 .58/.46 .79/.82 (3) Competence/Mastery .86/.86 .66/.66 .63/.43 .67/.50 .81/.81 (4) Stimulus avoidance .86/.86 .56/.56 .46/.30 .44/.13 .44/.21 .75/.75 (5) Overall satisfaction .93/.93 .82/.82 .26/.31 .25/.45 .27/.35 .21/-.04 .91/.91 CR: composite reliability; AVE: average variance extracted. Bold diagonal values are square root of AVE; others are correlation coefficients. Appendix 4. The Comparisons of the Nested Models for Study 2 χ2 df χ2 /df RMSEA Δχ2 (Δdf) Study 2-Classic model Full model 244.84 93 2.63 .066 Model 1 171.19 58 2.95 .072 73.65 (35) a,b Model 2 121.46 40 3.03 .074 123.38 (53) a,b Model 3 53.82 18 2.99 .073 191.02 (75) a,b Study 2-Performance model Full model 298.86 93 3.21 .077 Model 1 220.06 58 3.79 .086 78.80 (35) a,b Model 2 173.24 40 4.33 .094 125.62 (53) a,b Model 3 115.67 18 6.42 .120 183.19 (75) a,b Intellectual, Social, Competence/Mastery, and Stimulus avoidance are the determinants of OS in the full model. Model 1: without Intellectual path. Model 2: without Intellectual and Social paths. Model 3: without Intellectual, Social, and Competence/Mastery paths. a χ2 difference test was computed against the full model. b χ2 difference test was significant at .01 level. References Alegre, J., & Cladera, M. (2009). Analysing the effect of satisfaction and previous visits on tourist intentions to return. European Journal of Marketing, 43(5/6), 670–685. Anderson, J. C., & Gerbing, D. W. (1988). Structural equation modelling in practice: A review and recommended two-step approach. Psychological Bulletin, 103(3), 411–423. Awaritefe, O. (2004). Motivation and other considerations in tourist destination choice: A case study of Nigeria. Tourism Geographies, 6(3), 303–330. Babin, B. J., & Griffin, M. (1998). The nature an updated of satisfaction: Examination and analysis. Journal of Business Research, 41, 127–136. Battour, M. M., Battor, M. M., & Ismail, M. (2012). The mediating role of tourist sa- tisfaction: A study of Muslim tourists in Malaysia. Journal of Travel & Tourism Marketing, 29(3), 279–297. Beard, J. G., & Ragheb, M. G. (1983). Measuring leisure motivation. Journal of Leisure Research, 75(3), 219–228. Bigné, E., Andreu, L., & Gnoth, J. (2005). The theme park experience: An analysis of pleasure, arousal and satisfaction. Tourism Management, 26, 833–844. Biswas, M. (2008). Confirmatory factor analysis of Iso Ahola's motivational theory: An application of structural equation modeling. Proceedings of conference on tourism in India – challenges ahead (pp. 177–188). IIMK, 15-17 May 2008. del Bosque, I. R., & San Martín, H. (2008). Tourist satisfaction: A cognitive-affective model. Annals of Tourism Research, 35(2), 551–573. Bowen, D., & Clarke, J. (2002). Reflections on tourist satisfaction research: Past, present and future. Journal of Vacation Marketing, 8(4), 297–308. den Breejen, L. (2007). The experiences of long distance walking: A case study of the west highland way in Scotland. Tourism Management, 28, 1417–1427. Bright, A. D. (2008). Motivations, attitudes, and beliefs. In H. Oh, & A. Pizam (Eds.). Handbook of hospitality marketing management (pp. 239–266). Oxford: Butterworth- Heinemann. Bultena, G. L., & Klessig, L. L. (1969). Satisfaction in camping: A conceptualization and guide to social research. Journal of Leisure Research, 1, 348–354. Caber, M., & Albayrak, T. (2016). Push or pull? Identifying rock climbing tourists' mo- tivations. Tourism Management, 55, 74–84. Castaňo, J. M., Moreno, A., García, S., & Crego, A. (2003). Aproximación psicosocial a la motivación turística: Variables implicadas en la elección de Madrid como destino. Estudios Turísticos, 158, 5–41. Correia, A., Kozak, M., & Ferradeira, J. (2013). From tourist motivations to tourist sa- tisfaction. International Journal of Culture, Tourism and Hospitality Research, 7(4), 411–424. Dann, G. M. S. (1977). Anomie, ego-enhancement and tourism. Annals of Tourism Research, 4(4), 184–194. Dann, G. M. S. (1981). Tourist motivation an appraisal. Annals of Tourism Research, 8(2), 187–219. Devesa, M., Laguna, M., & Palacios, A. (2010). The role of motivation in visitor sa- tisfaction: Empirical evidence in rural tourism. Tourism Management, 31, 547–552. Engel, J. F., Kollat, D. T., & Blackwell, R. D. (1968). Consumer behavior (1st ed.). , New York: Holt, Rinehart and Winston. Fluker, M. R., & Turner, L. W. (2000). Needs, motivations, and expectations of a com- mercial whitewater rafting experience. Journal of Travel Research, 38, 380–389. Hair, J. F., Jr., Anderson, R. E., Tatham, R. L., & Black, W. C. (1998). Multivariate data analysis. Pearson education. New Jersey: Prentice-Hall, INC. Herzberg, F. (1968). One more time: How do you motivate employees? Harvard Business Review, 46, 53–62. Hsu, C. H. C., Cai, L. A., & Li, M. (2010). Expectation, motivation, and attitude: A tourist behavioral model. Journal of Travel Research, 49(3), 282–296. Huang, S., & Hsu, C. H. C. (2009). Effects of travel motivation, past experience, perceived constraint, and attitude on revisit intention. Journal of Travel Research, 48(1), 29–44. Huang, Y., Luo, S., Ding, P., & Scott, N. (2014). Impressions of liusanjie: A study of motivation, theatrical performance evaluation, and satisfaction. Current Issues in Tourism, 17(3), 280–296. Hui, T. K., Wan, D., & Ho, A. (2007). Tourists' satisfaction, recommendation and revisiting Singapore. Tourism Management, 28, 965–975. Hurlbert, J. E. (1991). Social networks, social circles, and job satisfaction. Work and Occupations, 18(4), 415–430. Iacobucci, D. (2010). Structural equations modeling: Fit Indices, sample size, and ad- vanced topics. Journal of Consumer Psychology, 20, 90–98. Inui, Y., Lankford, J. K., & Lankford, S. V. (2004). An exploratory motivational study of Japanese adventure based tourism. e-Review of Tourism Research (eRTR), 2(4), 70–77. Iso-Ahola, S. E. (1982). Toward a social psychological theory of tourism motivation: A rejoinder. Annals of Tourism Research, 9, 256–262. Kao, M. C., Patterson, I., Scott, N., & Li, C. K. (2008). Motivations and satisfactions of Taiwanese tourists who visit Australia. Journal of Travel & Tourism Marketing, 24(1), 17–33. Kay, P. (2003). Consumer motivation in a tourism Context: Continuing the work of Maslow, Rokeach, Vroom, Deci, haley and others. ANZMAC 2003: A celebrations of ehrenberg and Bass: Marketing discoveries, knowledge and contribution: Proceedings of the 2003 australian and New Zealand marketing academy conference (pp. 600–614). T. Albayrak, M. Caber Tourism Management 69 (2018) 201–213 212
  • 13. Adelaide, S. Aust.: ANZMAC. Khuong, M. N., & Ha, H. T. T. (2014). The influences of push and pull factors on the international leisure tourists' return intention to Ho Chi Minh city, Vietnam -A mediation analysis of destination satisfaction. International Journal of Trade, Economics and Finance, 5(6), 490–496. LaTour, S. A., & Peat, N. C. (1979). Conceptual and methodological issues in consumer satisfaction research. In W. F. Wilkie (Vol. Ed.), Advances in consumer research: Vol. 6, (pp. 31–37). Ann Arbor, MI: Association for Consumer Research. Lee, T. H. (2010). A structural model to examine how destination image, attitude, and motivation affect the future behavior of tourists. Leisure Sciences, 31(3), 215–236. Lee, T. H., & Hsu, F. Y. (2013). Examining how attending motivation and satisfaction affects the loyalty for attendees at aboriginal festivals. International Journal of Tourism Research, 15, 18–34. Lee, C. K., Reisinger, Y., Kim, M. J., & Yoon, S. M. (2014). The influence of volunteer motivation on satisfaction, attitudes, and support for a mega-event. International Journal of Hospitality Management, 40, 37–48. Li, M., Cai, L. A., Lehto, X. Y., & Huang, J. Z. (2010). A missing link in understanding revisit intention—the role of motivation and image. Journal of Travel & Tourism Marketing, 27(4), 335–348. Maslow, A. H. (1943). A theory of human motivation. Psychological Review, 50(4), 370–396. Maslow, A. H. (1970). Motivation and personality. New York: Harper & Row. McClelland, D. C. (1955). Studies in motivation. New York: Appleton-Century-Crofts. Meng, F., Tepanon, Y., & Uysal, M. (2008). Measuring tourist satisfaction by attribute and motivation: The case of a nature-based resort. Journal of Vacation Marketing, 14(1), 41–56. Mill, R., & Morrison, A. (1998). The tourism System: An introductory text (3rd ed.). Dubuque, Iowda: Dendall/Hunt Publishing Company. Mittal, V., Ross, W. T., & Baldasare, P. M. (1998). The asymmetric impact of negative and positive attribute-level performance on overall satisfaction and repurchase inten- tions. Journal of Marketing, 62, 33–47. Mohammad, B. A. M. A., & Som, A. P. M. (2010). An analysis of push and pull travel motivations of foreign tourists to Jordan. International Journal of Business and Management, 5(12), 41–50. Mohsin, A. (2008). Analysis of Chinese travellers' attitudes toward holidaying in New Zealand: The impact of socio-demographic variables. Journal of Hospitality & Leisure Marketing, 16(1–2), 21–40. Murphy, L., Benckendorff, P., & Moscardo, G. (2007). Linking travel motivation, tourist self-image and destination brand personality. Journal of Travel & Tourism Marketing, 22(2), 45–59. Murray, H. A. (1938). Explorations in personality. New York: Oxford University Press. Nowacki, M. M. (2009). Quality of visitor attractions, satisfaction, benefits and beha- vioural intentions of visitors: Verification of a model. International Journal of Tourism Research, 11, 297–309. Oh, H., & Parks, S. C. (1997). Customer satisfaction and service quality: A critical review of the literature and research implications for the hospitality industry. Hospitality Research Journal, 20(3), 35–64. Oliver, R. L. (1980). A cognitive model of the antecedents and consequences of sa- tisfaction decisions. Journal of Marketing Research, 17, 460–469. Oliver, R. L. (1981). Measurement and evaluation of satisfaction processes in retail set- tings. Journal of Retailing, 57, 25–48. Oliver, R. L., & Swan, J. E. (1989). Equity and disconfirmation perceptions as influences on merchant and product satisfaction. Journal of Consumer Research, 16, 372–383. Pan, S., & Ryan, C. (2007). Mountain areas and visitor usage-motivations and determi- nants of satisfaction: The case of Pirongia Forest Park, New Zealand. Journal of Sustainable Tourism, 15(3), 288–307. Pearce, P. L. (1993). Fundamental of tourist motivation. In D. G. Pearce, & R. W. Butler (Eds.). Tourism Research: Critiques and challenges (pp. 113–134). London: Routledge. Pincus, J. (2004). The consequences of unmet needs: The evolving role of motivation in consumer research. Journal of Consumer Behaviour, 3(4), 375–387. Pizam, A., & Ellis, T. (1999). Customer satisfaction and its measurement in hospitality enterprises. International Journal of Contemporary Hospitality Management, 11(7), 326–339. Pizam, A., Neuman, Y., & Reichel, A. (1978). Dimensions of tourist satisfaction with destination area. Annals of Tourism Research, 5(3), 314–322. Prebensen, N., Skallerud, K., & Chen, J. S. (2010). Tourist motivation with sun and sand destinations: Satisfaction and the WOM-effect. Journal of Travel & Tourism Marketing, 27(8), 858–873. Qiao, G.-H., Chen, N., Guan, Y.-Y., & Kim, S.-C. (2008). Study on Chinese tourists' mo- tivation and satisfaction to visit South Korea. International Journal of Tourism Science, 8(1), 17–38. Ross, E. L. D., & Iso-Ahola, A. E. (1991). Sightseeing tourists' motivation and satisfaction. Annals of Tourism Research, 18, 226–237. Ryan, C., & Glendon, I. (1998). Application of leisure motivation scale to tourism. Annals of Tourism Research, 25(1), 169–184. Savinovic, A., Kim, S., & Long, P. (2012). Audience members' motivation, satisfaction, and intention to re-visit an ethnic minority cultural festival. Journal of Travel & Tourism Marketing, 29(7), 682–694. Schofield, P., & Thompson, K. (2007). Visitor motivation, satisfaction and behavioural intention: The 2005 Naadam Festival, Ulaanbaatar. International Journal of Tourism Research, 9(5), 329–344. Severt, D., Wang, Y., Chen, P. J., & Breiter, D. (2007). Examining the motivation, per- ceived performance, and behavioral intentions of convention attendees: Evidence from a regional conference. Tourism Management, 28, 399–408. Shimp, T., & Sharma, S. (1987). Consumer ethnocentrism: Construction and validation of the CETSCALE. Journal of Marketing Research, 24, 280–289. Snepenger, D., King, J., Marshall, E., Marshall, E., & Uysal, M. (2006). Modelling Iso- Ahola’s motivation theory in the tourism context. Journal of Travel Research, 45(2), 140–149. Tang, Y. (2014). Travel motivation, destination image and visitor satisfaction of inter- national tourists after the 2008 wenchuan earthquake: A structural modelling ap- proach. Asia Pacific Journal of Tourism Research, 19(11), 1260–1277. Thomas, D. W., & Butts, F. B. (1998). Assessing leisure motivators and satisfaction of international Elderhostel participants. Journal of Travel & Tourism Marketing, 7(1), 31–38. Tian-Cole, S., & Cromption, J. (2003). A conceptualization of the relationships between service quality and visitor satisfaction, and their links to destination selection. Leisure Studies, 22(1), 65–80. Vargo, S. L., Nagao, K., He, Y., & Morgan, F. W. (2007). Satisfiers, dissatisfiers, criticals, and neutrals: A review of their relative effects on customer (dis)satisfaction. Academy of Marketing Science Review, 11(2), 1–19. Vroom, V. H. (1964). Work and motivation. New York: Wiley. Wolfe, K., & Hsu, C. H. C. (2004). An application of the social psychological model of tourism motivation. International Journal of Hospitality & Tourism Administration, 5(1), 29–47. Woodruff, R. B., Cadotte, E. R., & Jenkins, R. L. (1983). Modeling consumer satisfaction processes using experience-based norms. Journal of Marketing Research, 20(3), 296–304. Wu, C. H. J., & Liang, R. D. (2011). The relationship between white-water rafting ex- perience formation and customer reaction: A flow theory perspective. Tourism Management, 32(2), 317–325. Yoon, Y., & Uysal, M. (2005). An examination of the effects of motivation and satisfaction on destination loyalty: A structural model. Tourism Management, 26, 45–56. Yusof, A., Omar-Fauzee, M. S., Shah, P. M., & Geok, S. K. (2009). Exploring small-scale sport event tourism in Malaysia. Research Journal of International Studies, 9, 47–58. Zanoli, R., & Naspetti, S. (2002). Consumer motivations in the purchase of organic food. British Food Journal, 104(8), 643–653. Tahir Albayrak completed his PhD at Akdeniz University, Business Management Programme in 2008. He has several published international conference papers and refereed ar- ticles about niche marketing, consumer behaviour and service quality at the marketing and tourism journals. Meltem Caber works as associate professor at Akdeniz University, Tourism Faculty. She is currently the head of programme of Tourism Guidance. Some of her research interests are e-CRM, foreign direct investments in tourism and destination management. She has several published international conference papers and refereed articles about tourism management. T. Albayrak, M. Caber Tourism Management 69 (2018) 201–213 213