SlideShare a Scribd company logo
1 of 20
Download to read offline
IMPEDANCE ANALYZER
IM7580 Series
Is Here
Cover measurement frequencies from 100 kHz to 3 GHz
Choose from 5 Models
3GHz
High Performance Reliability
2
2
SMD TEST FIXTURE IM9201 (option)
Use the 6-in-1 SMD Test Fixture IM9201 (option)
to perform easy and reliable measurements.
* IM7587
High-stability, high-speed sweeping measurement up to 3 GHz
High-stability Impedance Measurement up to 3 GHz*
Cover a wide range of measurement frequencies, from 1 MHz to 3 GHz, with
a single device. High-stability measurement with minimal variability delivers
outstanding cost performance for research and development.
3
3
Stable measurement across a broad range
Measurement technology that adds to superior stability
Large solid shield for improved performance
To achieve favorable frequency characteristics, we painstakingly
carried out design true to our basic principles for the individual
circuits, board patterning, and case structure.
We also used numerical analysis and in-depth verification to
optimize the shield structure and the shape of the internal board
pattern, thus fitting all the technology necessary to achieve opti-
mal frequency characteristics from 100 kHz to 3 GHz into a com-
pact body.
For the test head measurement terminals, in order to improve
their measurement accuracy over a wide range, we used 3.5
mm (0.14 in) connectors with a wide frequency range, which also
boast better removability than other microwave connectors.
The measurement portion uses a high resolution A/D converter.
By controlling the input signal’s level and frequency, the A/D
converter’s dynamic range can be utilized to the fullest, achiev-
ing measurement with a wide impedance range and minimum
variability.
In the sub FPGA, built into analog circuits, the digital filter ap-
plied optimally for each circuit shuts out noise. At the main
FPGA, the 64-bit floating point computation is put through a
multi-layered pipeline to achieve high-speed computational pro-
cessing with little margin of error. This helps increase the stabil-
ity and speed of measurements.
Each section uses a solid shield carved to match the on-board
pattern or IC shape, thus reducing internal coupling. The shield
also reduces external radia-
tion and improves noise resis-
tance, meeting a high level of
EMC, despite being the light-
est in its class.
Test head for the IM7583, IM7585, and IM7587
Inside the solid shield
Advanced Design for Reliable Testing
4
4
All models
Repeatability and analog measurement time
(Reference data)
Maximum
speed
0.5ms
Achieve measurement with both high speed and high stability.
Cut takt time and increase productivity.
0.1
0.1
0.1
0.1
IM7583, IM7585, IM7587 IM7580A, IM7581
Measurement frequency 3 GHz
Measurement frequency 500 MHz
Measurement frequency 100 MHz
Measurement frequency 200 kHz
Signal level : +1dBm
Sample A : 1nH
Signal level : +1dBm
Sample B : 1nH
Signal level: +1dBm
Sample C : 100nH
Signal level: +1dBm
Sample D : 100μH
0
0
0
0
0.004
0.004
0.1
0.02
0.01
0.008
0.008
0.2
0.04
0.03
0.012
0.012
0.3
0.06
0.05
0.02
0.02
0.016
0.016
0.4
0.08
0.07
1
1
1
1
0.5ms
0.5ms
0.5ms
0.5ms 10
10
10
10
High-speed, highly stable measurement
(Analog measurement time)
Repeatability
(Z,
3CV)
[%]
Repeatability
(Z,
3CV)
[%]
Repeatability
(Z,
3CV)
[%]
Repeatability
(Z,
3CV)
[%]
Analog measurement time [ms]
5
5
Compact body for
greater mobility
Test head fits in the
palm of your hand
Large display for
easy operation
The half-rack compact body
is light and fit not only for line
use, but also when measuring
various sites on the go.
The slim profile of the test
head lets you install it close
to the measurement target to
help minimize influence from
noise and other effects and
enabling more accurate mea-
surement.
Customize the large screen
according to desired bright-
ness, color, and text size to fit
your environment.  
H ighly re sp o nsive to u ch
screen makes measurement
settings and adjustments
even easier.
Compact form factor – 2 analyzers fit side-by-side on a full-size rack.
Remarkably lightweight and compact for a measuring instrument of
this class.
Turntable
Fixture
Number of display
digits (3/4/5/6)
Customizable display
color (Background and
display colors)
Customizable
text size
Space-saving Half-rack Size
6
Photo: IM7581
Photo: IM7585
IMPEDANCE ANALYZER IM7580A
IMPEDANCE ANALYZER IM7581
IMPEDANCE ANALYZER IM7583
IMPEDANCE ANALYZER IM7585
IMPEDANCE ANALYZER IM7587
Measurement frequency 1 MHz to 300 MHz
Measurement range L : 0.0531 nH to .795 mH
C : 0.1061 pF to i.59 μF
(Depending on the measurement frequency)
Measurement signal level -40.0 dBm to +7.0 dBm
Basic accuracy Z : 0.72% rdg. θ: 0.41°
Measurement frequency 100 kHz to 300 MHz
Measurement range L : 0.0531 nH to 7.95 mH
C : 0.1061 pF to 15.9 μF
(Depending on the measurement frequency)
Measurement signal level -40.0 dBm to +7.0 dBm
Basic accuracy Z : 0.72% rdg. θ: 0.41°
Measurement frequency 1 MHz to 600 MHz
Measurement range L : 0.0265 nH to 0.795 mH
C : 0.0531 pF to 1.59 μF
(Depending on the measurement frequency)
Measurement signal level -40.0 dBm to +1.0 dBm
Basic accuracy Z : 0.65% rdg. θ: 0.38°
Measurement frequency 1 MHz to 1.3 GHz
Measurement range L : 0.0123 nH to 0.795 mH
C : 0.0245 pF to 1.59 μF
(Depending on the measurement frequency)
Measurement signal level -40.0 dBm to +1.0 dBm
Basic accuracy Z : 0.65% rdg. θ: 0.38°
Measurement frequency 1 MHz to 3 GHz
Measurement range L : 0.0053 nH to 0.795 mH
C : 0.011 pF to 1.59 μF
(Depending on the measurement frequency)
Measurement signal level -40.0 dBm to +1.0 dBm
Basic accuracy Z : 0.65% rdg. θ: 0.38°
Select Your Testing Frequency from 5 Models
5 models support a wide variety of applications
IM7580A
1MHz to 600 MHz
1MHz to 1.3 GHz
1MHz to 3 GHz
IM7581
IM7583
IM7585
IM7587
100 kHz 1MHz 10 MHz 100 MHz 1GHz 3 GHz
1MHz to 300 MHz
100 kHz to 300 MHz
7
Use LCR Mode to make measurements by applying the desired frequency and
level signal to the component being measured. This mode is ideal for evaluating
passive samples such as capacitors and coils.
Use Analyzer Mode to perform measurement while sweeping through a range
of measurement frequencies and measurement signal levels. This mode is
ideal for checking frequency characteristics and level characteristics.
Dual measurement modes
LCR Mode
Analyzer Mode
Display up to four measurement parameters simultaneously.
Z Impedance G Conductance Rp Equivalent parallel resistance Cp Equivalent parallel capacitance
Y Admittance B Susceptance Ls Equivalent series inductance D Loss factor tan δ
θ Phase angle Q Q-factor Lp Equivalent parallel inductance V Monitor voltage*
X Reactance Rs Equivalent series resistance (ESR) Cs Equivalent series capacitance I Monitor current*
*Analyzer mode only
- HI is displayed
- IN is displayed
- LO is displayed
Comparator measurement : Yield a PASS/FAIL judgment for the target
sample based on a single judgment criterion.
Normal / segment sweep operation : Discover sample
characteristics by sweeping through a range of frequencies and levels.
Interval sweep operation : Discover element characteristics over time
under set conditions.
Bin measurement : Rank samples using multiple judgment criteria.
Display
HI
IN
LO
Upper limit
Reference value
Lower limit
BIN1 BIN2 BIN3 BIN4 BIN5 .
.
.
. BIN10
IN
Set upper and lower limits for each bin. The impedance
analyzer will rank components using up to 10 categories.
*Upper and lower limit settings are the same as for
comparator measurement.
Scope of
reference value
Display zoom function
Monitor function
Monitor voltage : 0.0 mV to 1000.0 mV
Monitor current : 0.000 mA to 20.000 mA
Display measured
values using larger text
for better visibility on
production lines and in
other field applications.
Display the
measurement signal
level being applied to
components in real
time.
Normal
Segment
Sweep parameters Frequency/signal level (power, voltage, current)
Number of sweep points/segments Up to 801 points / Up to 20 segments (with a total of 801 points)
Measurement condition settings Frequency, level, speed, average
Time interval 0 sec. to 1,000 sec.
Number of sweep points/segments Up to 801 points / Up to 20 segments (with a total of 801 points)
Sweep graph display (1-graph/4-graph display),
XY graph display (1-graph/2-graph display),
Multi-display (simultaneous display of sweep and XY),
List display, Peak display
The graph display can be switched based on the type
of measurement being performed.
(with a total of 7 layouts available)
Upper and lower limit judgment: Set the upper and lower limits.
Percentage judgment: Set the upper and lower limits as
percentages of the reference value.
Deviation percentage judgment: Set the upper and lower limits
as percentages of the reference value. The impedance
analyzer will display deviation of the measured value from the
reference value (Δ%).
Perform measurement after
setting the sweep parameter
(frequency or level), sweep
range, number of sweep points,
and measurement conditions.
Set the sweep parameter,
sweep range, number of sweep
points, and measurement
conditions on a segment-by-
segment basis.
8
Intelligent measurement and analysis
Continuous measurement
function
Measured value search
function
Convenient functionality for performing measurement,
reviewing measurement results, and judging measured values.
Functions available in analyzer mode
Functions available in LCR mode
Perform continuous measurement in the order
of the measurement conditions saved with the
panel save function.
Measurements can combine LCR and Analyzer
Mode measurement conditions.
Continuous measurement can be performed using up to
46 measurement condition combinations, and can be
implemented from EXT I/O.
Save or load the measurement conditions,
compensation values, and compensation
conditions set in LCR mode or analyzer mode.
Panel save and load function
Number of panels that can be saved
LCR Mode measurement conditions 30
Analyzer Mode measurement conditions 16
A: Panel numbers set for continuous measurement;
B: Measured values; C: Parameter judgment results
Selecting an Analyzer Mode
panel displays the waveform.
A B B
C C
The cursor can be moved automatically to a user-
selected measured value point for one set of
sweep measurement results.
Move the cursor automatically according to user-
configured settings once sweep measurement is
complete.
Auto search function
Search options
Maximum
value
Moves the cursor to the maximum value.
Minimum
value
Moves the cursor to the minimum value.
Target
Moves the cursor to a user-set measured
value.
L-Max value
Moves the cursor to the local maximum value
(a filter can be set).
L-Min value
Moves the cursor to the local minimum value
(a filter can be set).
A: Cursor; B: Search result point; C: Measured values at result point
A
B
C
9
Area and peak comparison
functions
Equivalent circuit analysis
function
Simulation function/residual error display
Check whether measured values fall inside a previously
configured judgment area. These functions are ideal for
use in verifying non-defective products.
Obtaining an overall judgment
for each sweep
For multiple-frequency
simultaneous judgments
Identifying resonance points
Define a range by setting upper and lower limits and
display the judgment results as IN or NG.
Define a range by setting upper, lower, left, and right
limits and display the judgment results as IN or NG.
This function makes a judgment at a pre-set point during
sweeping. (Up to 16 points)
Area judgment
Peak judgment
Spot judgment
Judgment area
Judgment area
IN judgment: Inside area
NG judgment: Outside area
A: Analysis results
A
Analyze individual component values (L/C/R) for elements
in the following five circuits based on measurement results.
R1
C1
L1
R1
C1
L1
R1
C1
L1
R1
C0
C1
L1
R1
C1
L1
Measured values
Simulated values
Z
Frequency
Difference
Perform simulations based on the result of equivalent circuit
analyses, compare that to actual measured values, and
check the validity of the analysis result.
Display the residual error to check the gap between the
actual measurement and simulation numerically.
Area judgment
screen
Spot judgment
screen
Peak judgment
screen
10
Fully equipped with a range of built-in functions necessary for accurate and stable
measurement.
Compensation
function
Monitor the connection between the measurement terminals and the sample.
This capability is ideal for carrying out contact checks of induc-
tive components with low DC resistance values such as induc-
tors, ferrite cores, and common-mode filters.
Verify that components and terminals are in contact during measure-
ment. The impedance analyzer will output an error if fluctuations in the
RMS value exceed a user-configured range that has been set using the
initially acquired RMS value waveform as the reference value.
Judgments based on user-configured upper and lower contact resistance limits
Guaranteed accuracy range 0.1 Ω to 100 Ω
Measurement timing Before measurement, after measurement, or before and after measurement
Output format Screen display / EXT I/O Output
Activate this function in order to output a measurement terminal
contact error if the impedance measured value is greater than a
user-configured reference value.
Valid setting range 1 Ω to 10000 Ω
Output format Screen error display or EXT I/O error output
Valid setting range 0.01% to 100.0% of the reference value
Output format Screen error display or EXT I/O error output
To truly measure accurately, all analyzers should first be set up to
their optimal state.
Electrical length compensation
Open and short compensation
Open, short, and load calibration
The compensation process involves calibrating the measurement
setup, from the impedance analyzer to the reference surface (ei-
ther the test head terminals or the sample connection terminals).
Connect the calibration kit (standard for open, short, and load),
measure each piece of calibration data, and remove the cause of
the margin of error.
Enter the length of the electrical connection between the reference
surface and the measurement sample connection surface to allow
compensation of error caused by phase shift.
If mounting a fixture on the test head, it is necessary to enter the
fixture’s electrical length.
Eliminate the causes of errors (such as fixtures or measurement
cables) from the calibration standard surface to the sample con-
nection terminal.
Test head terminals
(Calibration
reference surface)
Sample connection
terminals (Calibration
reference surface)
Impedance analyzer
Test head
Cable(1 m (3.28 ft) or 2 m (6.56 ft))
Connector / cable / test fixture
Measurement
sample
Functions for Efficient, Accurate Measurement
Contact check
Checking contact before and
after measurement
Judging the contact state
based on measurement results
Detecting chatter during
measurement
DCR measurement
Hi-Z reject function
Waveform judgment
function
Measured value > Upper limit: Displays “HI.”
Upper limit ≥ Measured value ≥ Lower limit: Displays “IN.”
Measured value < Lower limit: Displays “LO.”
DCR measurement
Contact check / Hi-Z reject function
11
Handler Interface
Software Full Keyboard Large Screen for Better Viewing and Control
Fast Measurement and Easy Screen Display
1
2
3
4
A
C
C
Previous
Previous Current
TRIG
Previous
Current
Current
B
D
TRIG
EOM
EOM
EOM
Reset on
Reset off
Hold
Pulse
Delay
INDEX
Signal
ERR
ERR
Perform intricate external control.
Select whether to base input timing on the trigger’s rising
edge or falling edge.
B
C
A
D
Choose to enable or disable trigger input during measurement. By
disabling input, you can prevent erroneous input caused by chatter.
2.	Reset judgment result
You can set the timing at which judgment results are reset.
On:	Reset the previous judgment results at the measurement
complete signal’s rising edge.
Off:	Retain previous judgment until next judgment is output.
When using trigger-synchronized output, you can ensure that
the analog measurement signal is only output once the
measurement signal has turned off.
Screen size comparison for the IM3570 and IM7580 at the same ratio
Trigger-synchronized output: The measurement signal is only
applied to the sample during measurement.
1.	Trigger input Timing and enable/disable settings
Select whether to use pulse or hold output for the
measurement complete signal.
Pulse: You can set the duration for which the measurement
complete signal is placed in the “on” state.
Hold: The measurement complete signal switches from “on” to
“off” at trigger input.
You can set the duration of the delay from output of judgment
results to output of the measurement complete signal.
3.	Measurement complete signal
Output method and output delay
4.	Analog measurement signal Output delay
The touch screen is equipped with a full keyboard
function. Comfortably and reliably perform various
input operations.
Larger touch screen than legacy models for
improved readability and comfort.
The multicore CPU achieves both high-speed
measurement and high-speed communication, as
well as easy screen operation. It is equipped with
a display mode that, even with the measurement
screen displayed, achieves the same high-speed
response as if the screen were off.
IM7580s screen IM3570 screen
12
Expansive Interface
Save measurement
conditions and results
in a USB flash drive
Extensive range of
interfaces for external
control
Use the IM7580’s LAN, USB, GP-IB, RS-
232C, and EXT I/O interfaces to control
the instrument from an external device.
*For more information, see page 15.
Use the front USB terminal to
save the measurement data,
screen shots, or measurement
conditions saved to the unit's
internal memory to a USB drive.
EXT I/O
Connector
D-sub 37-pin
Female #4-40 inch thread
Compatible
connectors
DC-37P-ULR (solder)
DCSP-JB37PR (crimp)
Japan Aviation Electronics
Industry, Ltd.
GP-IB
RS-232C
(optional)
(optional)
Connector 24-pin
Standard IEEE 488.1 1987
Reference standard IEEE 488.2 1987
Terminator CR+LF, LF
Connector D-sub 9-pin
Flow control Software
Transmission
speed
9600 / 19200 / 38400 /
57600 bps
LAN
USB
Connector RJ-45 connector
Transmission
method
10Base-T, 100Base-Tx,
1000Base-T
Protocol TCP/IP
Connector USB Type B
Electrical
specifications
USB 2.0 (High Speed)
*The GP-IB and RS-232C
INTERFACE are optional
1. GP-IB
2. RS-232C
3. EXT I/O (Handler interface)
5. USB (for PC connectivity)
4. LAN
GP-IB INTERFACE Z3000
RS-232C INTERFACE Z3001
268 mm (10.55 in)
348 mm (13.7 in)
IM7581 Main unit front
(Same as IM7580A)
Main unit rear
(Interface are the same for all five models)
IM7587 Main unit front
(Same as IM7583 / IM7585)
Test head included with the IM7580A / IM7581
Test head included with the IM7583 / IM7585 / IM7587
IM7580A / IM7581 Main unit side
IM7583 / IM7585 / IM7587 Main unit side
215 mm (8.46 in)
200 mm
(7.87 in)
24 mm
(0.94 in)
24 mm
(0.94 in)
61 mm
(2.40 in)
90 mm
(3.54 in)
55 mm
(2.17 in)
64 mm
(2.52 in)
*The GP-IB and RS-232C INTERFACE are optional
(for PC connectivity)
13
Applications
Common-mode filter measurement
PASS/FAIL judgments of power inductors
Panel save and continuous measurement
Comparator function
Carry out measurement smoothly, automatically switching compensation values and measurement conditions, such
as when measuring a single part with two different measurement methods, or when using different compensation
values/measurement conditions for each measurement point.
By using the comparator function’s area and peak judgment functions, you can easily differentiate between
defective and non-defective components.
Compact design that fits two instruments into a full-size
rack.Using two impedance analyzers simultaneously can
dramatically reduce cycle times.
Halve cycle times by using two instruments…
Non-defective: IN Defective: NG
Set the judgment area and then check whether
component measurement results fall inside that
area. This approach is well suited to differentiating
between defective and non-defective components.
As illustrated to the left, you
can set a range around the
peak value and use it to
make judgments.
If measuring a single part with two measurement methods.
Continuous
measurement
Common mode Differential mode
When compensation values and measurement conditions
differ for each measurement point
Progressive switching of
compensation values and
measurement conditions
1 → 2 → 3 → 4
1
2
3
4
Area judgment
14
SMD measurement procedure
SMD TEST FIXTURE IM9201
CALIBRATION KIT IM9905
Exclusive
Options
All-in-One Fixture for 6 SMD Sizes - Definitive 3GHz High Frequency Analysis Made Easy.
2 Device Guides Let You Measure 6 Different SMD Sizes
1. Install the device guide and position the component 2. Release the stopper and anchor the pusher to secure the component
Instrument / Options
Device Guide for 0201
for 0402 to 1210
Stopper
Pusher Device guide
Release
stopper
Pusher holds down
the component
The following provisions are required when using the
test fixture with the Hioki IM7580 series.
SMD TEST FIXTURE IM9201 CALIBRATION KIT IM9905
TEST FIXTURE STAND
IM9200
(includes magnifying glass)
ADAPTER
(3.5 mm to 7 mm)
IM9906
Frequency range DC to 3 GHz
Compatible package sizes (EIA) 0201, 0402, 0603, 0805, 1206, 1210
Electrode structure Bottom electrodes
Maximum voltage ±42 Vpeak (AC+DC)
Additional uncertainty
Impedance : ±Ze [%]
Phase : ±0.58 × Ze [ ° ]
Ze = Ae + (Zse / Zx + Yoe × Zx) × 100
Zx : Measured impedance value [Ω]
Ae : 4 × f2
[%]
Zse : (100 + 500 × f) / 1000 [Ω]
Yoe : (10 + 100 × f) / 1000000 [S]
f [GHz]
Specifications
Product name Order code
SMD TEST FIXTURE IM9201 IM9201
TEST FIXTURE STAND IM9200 IM9200
ADAPTER(3.5 mm to 7 mm) IM9906 IM9906
CALIBRATION KIT IM9905 IM9905
Product / Order code
15
Measurement parameters and measurement conditions
Speed and accuracy
Measurement
modes
LCR mode: Measurement using a single set of conditions
Analyzer mode: Sweep measurement and equivalent
circuit analysis
Continuous measurement mode: Continuous
measurement using previously saved conditions
Measurement
parameters
Z
Y
θ
X
G
B
Q
Impedance
Admittance
Phase angle
Reactance
Conductance
Susceptance
Q-factor
Rs
Rp
Ls
Lp
Cs
Cp
D
Equivalent series resistance (ESR)
Equivalent parallel resistance
Equivalent series inductance
Equivalent parallel inductance
Equivalent series capacitance
Equivalent parallel capacitance
Loss factor tan δ
Display range
Z
Y
θ
X
G
B
Q
0.00 m to 9.99999 GΩ
0.000 n to 9.99999 GS
±(0.000° to 180.000°)
±(0.00 m to 9.99999 GΩ)
±(0.000 n to 9.99999 GS)
±(0.00 to 9999.99)
Rs
Rp
Ls
Lp
Cs
Cp
D
Δ%
±(0.00 m to 9.99999 GΩ)
±(0.00000 n to 9.99999 GH)
±(0.00000 p to 9.99999 GF)
±(0.00000 to 9.99999)
±(0.000 to 999.999%)
Measurable range 100 mΩ to 5 kΩ
Output impedance Approx. 50 Ω
Measurement
frequency
Range
IM7580A 1 MHz to 300 MHz
IM7581 100 kHz to 300 MHz
IM7583 1 MHz to 600 MHz
IM7585 1 MHz to 1.3 GHz
IM7587 1 MHz to 3 GHz
Resolution
IM7580A
1.0000 MHz to 9.9999 MHz …… 100 Hz steps
10.000 MHz to 99.999 MHz …… 1 kHz steps
100.00 MHz to 300.00 MHz …… 10 kHz steps
IM7581
100.00 kHz to 999.99 kHz ……… 10 Hz steps
(1.0000 MHz to 300.00 MHz same as IM7580A)
IM7583 / IM7585 / IM7587 ……… 100 kHz steps
Accuracy ±0.01% of setting or less
Measurement
signal level
Range
IM7580A / IM7581
Power : -40.0 dBm to +7.0 dBm
Voltage : 4 mV to 1001 mV rms
Current : 0.09 mA to 20.02 mA rms
IM7583 / IM7585 / IM7587
Power : -40.0 dBm to +1.0 dBm
Voltage : 4 mV to 502 mV rms
Current : 0.09 mA to 10.04 mA rms
*User-configured power, voltage, and current
Resolution 0.1 dB steps
Accuracy ±2 dB(23 ℃±5 ℃), ±4 dB(0 ℃ to 40 ℃)
Measurements
Sweep measurement
Up to 801 sweep points with user-configurable point delay
Normal sweep: Measurement of up to 801 points
Segment sweep: Up to 20 segments (with a total of
801 points)
Time interval measurement
Interval of 0.00000 sec. to max. 1,000.00 sec., 801 points
Functionality
Equivalent circuit analysis: 5 circuit models
Cursor function: Automatically search for maximum
and minimum values, target, local maximum and
minimum values
Comparator function: Area, peak and spot judgment
Display
List display graph display, XY graph display, judgment
results display
Scaling: Linear or logarithmic
Measurements
Bin measurement: 10 categories for 4 measurement
parameters
Comparator measurement: Hi, IN, and Lo judgments
for 4 parameters
Functionality
Monitor function
Monitor voltage range: 0.0 mV to 1000.0 mV
Monitor current range: 0.000 mA to 20.000 mA
Display Zoom display function: Enlarged display of measured values
Trigger function
User-selectable internal or external trigger (EXT I/O, interface, manual)
Trigger delay: 0 sec. to 9 sec.
Trigger-synchronized output: Stabilization wait time of 0 sec. to 9 sec.
INDEX signal delay time of 0 sec. to 0.1 sec.
Trigger types: Sequential, repeat, step*1
Compensation
function
Open/short/load calibration: From Main unit to test head
Open/load compensation: Compensation of fixture component
Electrical length compensation: 0 mm to 100 mm
Correlation compensation: Compensation of display
values based on user-input compensation coefficient
Contact check
DCR measurement, Hi-Z reject function, waveform
judgment function
Key lock function
Lock operation of the instrument using the panel.
Unlock by entering a passcode
Beep tone Enable or disable for judgment results and key operation
Warm-up function
The instrument will display a message 60 minutes
after it is powered on
Selection of number
of display digits
3, 4, 5, or 6 digits
Display settings
LCD display on/off
Backlight brightness adjustment
Measurement screen background color (white or black)
Switchable parameter colors
Display 8.4-inch color TFT with touch panel
Number of measured
values that can be
stored in memory
LCR Mode: 32000
Analyzer Mode: 100 sweeps
Panel save and
load functions
Measurement conditions: 30 sets for LCR mode, 16
sets for Analyzer mode
Compensation values only: 30 sets for LCR mode
Interfaces
HANDLER, USB, LAN, GP-IB (optional),
RS-232C (optional)
Command HIOKI unique SCPI
Operatingtemperatureandhumidityrange 0°C to 40°C (32°F to 104°F), 20% RH to 80% RH, non-condensing
Storagetemperatureandhumidityrange -10°C to 50°C (14°F to 122°F), 20% RH to 80% RH, non-condensing
Operating environment
Use indoors at an elevation of 2,000 m or less in an
environment with a maximum pollution level of 2
Powersupplyandmaximumratedpower 100 V to 240 V AC (50/60 Hz), 70 VA
Dielectric strength 1.62 kV AC for 1 min. between power line and ground line
Standards compliance EMC: EN 61326, EN 61000 Safety: EN 61010
Dimensions and
mass
IM7580A / IM7581
Approx. 215 W×200 H×268 D mm (8.46 W×7.87 H
×10.55 D in), approx. 6.5 kg (229.3 oz)
IM7583 / IM7585 / IM7587
Approx. 215 W×200 H×348 D mm (8.46 W×7.87 H
×13.7 D in), approx. 8.0 kg (282.3 oz)
Accessories
Power cord ×1, Instruction manual ×1,
Impedance analyzer application disc ×1
Measurement speed
(analog measurement)
FAST MED SLOW SLOW2
0.5 ms 0.9 ms 2.1 ms 3.7 ms
Averaging Valid setting range: 1 to 256 (in steps of 1)
Basic accuracy
IM7580A / IM7581…… Z : 0.72% rdg. θ : 0.41°
IM7583 / IM7585 …… Z : 0.65% rdg. θ : 0.38°
Guaranteed accuracy range 100 mΩ to 5 kΩ(impedance)
Accuracy guaranteed 1 year, Post-adjustment accuracy guaranteed for 1 year
Terminal design 2-terminal design
LCR mode
Recording and interface
Display and sound
Other
Supplementary functionality
Analyzer mode
*1 Analyzer mode only
Measurements
Continuous measurement using up to 46 combinations
of the following measurement conditions:
30 LCR mode measurement conditions and 16
analyzer mode measurement conditions
Continuous measurement mode
16
Ea = 0.5 + Er (Frequency : 1MHz to 300MHz)
Ea = 1.0 + Er (Frequency : 100kHz to 999.99kHz)
P : Power setting [dBm]
Measurement accuracy
IM7580A / IM7581
Z : ± (Ea + Eb) [%] θ : ± 0.58 × (Ea + Eb) [ ° ]
Conditions
Guaranteed accuracy
temperature and humidity
range
0°C to 40°C (32°F to 104°F), 20% rh to 80% rh (non-condensing)
However, must be within ±5°C of the temperature at the time of calibration.
Guaranteed accuracy
period
1 year (with open/short/load calibration enabled)
Open/short/load calibration
enabled period
Within 24 hours after calibration
Warm-up time At least 60 min.
Measurement conditions Frequency, power, and speed points at which open, short, and load calibration have been performed
Frequency Signal level Er
α
FAST MED SLOW SLOW2
100 kHz to 999.99 kHz
-7 dBm to +7 dBm α 0.24 0.18 0.15 0.12
-40 dBm to -7.1 dBm 3 × 10 (-0.043P + α)
-1.3 -1.4 -1.5 -1.6
1 MHz to 100 MHz
-7 dBm to +7 dBm α 0.09 0.06 0.036 0.03
-40 dBm to -7.1 dBm 3 × 10 (-0.046P + α)
-1.8 -2 -2.15 -2.3
100.01 MHz to 300 MHz
-7 dBm to +7 dBm α 0.108 0.078 0.039 0.036
-40 dBm to -7.1 dBm 3 × 10 (-0.048P + α)
-1.75 -1.9 -2.1 -2.25
Frequency Signal level Zsr
α
FAST MED SLOW SLOW2
100 kHz to 999.99 kHz
-7 dBm to +7 dBm α 36 27 21 15
-40 dBm to -7.1 dBm 3 × 10 (-0.042P + α)
0.9 0.8 0.7 0.6
1 MHz to 300 MHz
-7 dBm to +7 dBm α 13.5 9 5.1 3.9
-40 dBm to -7.1 dBm 3 × 10 (-0.048P + α)
0.36 0.2 0 -0.15
Frequency Signal level Yor
α
FAST MED SLOW SLOW2
100 kHz to 999.99 kHz
-7 dBm to +7 dBm α 15 12 6.6 5.4
-40 dBm to -7.1 dBm 6 × 10 (-0.043P + α)
0.6 0.5 0.4 0.3
1 MHz to 300 MHz
-7 dBm to +7 dBm α 7.5 5.7 3.3 2.4
-40 dBm to 7.1 dBm 3 × 10 (-0.046P + α)
0.1 0 -0.2 -0.4
Frequency Zsk
100 kHz to 999.99 kHz 50
1 MHz to 300 MHz 20
Frequency Yok
100 kHz to 199.99 kHz 120
200 kHz to 300 MHz 30
[Ω] ( F : measurement frequency [MHz] )
[S] ( F : measurement frequency [MHz] )
Zs =
Yo =
( Zsk + Zsr + 0.5 × F )
1000
( Yok + Yor + 0.15 × F )
1000000
[%] ( Zx : Z measured value in [Ω] )
Eb =
Zs
Zx
Yo × 100
Zx
+ .
( )
17
Ea :
IM7583 / IM7585 / IM7587
Frequency Signal level
Ea
FAST MED SLOW SLOW2
1 MHz to 100 MHz
+1 dBm 0.581 0.557 0.532 0.524
-22.9 dBm to +0.9 dBm 1.005 0.815 0.71 0.63
-40 dBm to -23 dBm 3.622 2.501 1.7 1.43
100.1 MHz to 500 MHz
+1 dBm 0.652 0.634 0.621 0.616
-22.9 dBm to +0.9 dBm 0.858 0.769 0.71 0.678
-40 dBm to -23 dBm 1.72 1.336 1.06 0.85
500.1 MHz to 1300 MHz
+1 dBm 0.86 0.841 0.823 0.818
-22.9 dBm to +0.9 dBm 1.093 0.988 0.92 0.881
-40 dBm to -23 dBm 2.068 1.625 1.31 1.16
1300.1 MHz to 1800 MHz
+1 dBm 2.066 2.037 2.025 2.02
-22.9 dBm to +0.9 dBm 2.381 2.228 2.128 2.113
-40 dBm to -23 dBm 5.773 4.156 3.423 3.133
1800.1 MHz to 3000 MHz
+1 dBm 4.539 4.5 4.46 4.437
-22.9 dBm to +0.9 dBm 4.867 4.753 4.608 4.547
-40 dBm to -23 dBm 9.748 7.682 6.468 5.874
Frequency Signal level
Zsr
FAST MED SLOW SLOW2
1 MHz to 300 MHz
+1 dBm 41.7 37.6 34.3 32.3
-22.9 dBm to +0.9 dBm 75.4 62.9 49.4 43.1
-40 dBm to -23 dBm 495.66 293.25 185.7 142.05
300.1 MHz to 1000.0 MHz
+1 dBm 61.7 57.6 54.3 52.3
-22.9 dBm to +0.9 dBm 95.4 82.9 69.4 63.1
-40 dBm to -23 dBm 515.66 313.25 205.7 162.05
1000.1 MHz to 1300 MHz
+1 dBm 111.7 107.6 104.3 102.3
-22.9 dBm to +0.9 dBm 145.4 132.9 119.4 113.1
-40 dBm to -23 dBm 565.66 363.25 255.7 212.05
1300.1 MHz to 1800 MHz
+1 dBm 112.8 108.7 104.7 103.9
-22.9 dBm to +0.9 dBm 145.4 132.9 119.4 113.1
-40 dBm to -23 dBm 565.66 363.25 255.7 212.05
1800.1 MHz to 3000 MHz
+1 dBm 212.8 208.7 204.7 203.9
-22.9 dBm to +0.9 dBm 245.4 232.9 219.4 213.1
-40 dBm to -23 dBm 665.66 463.25 355.7 312.05
Frequency Signal level
Yor
FAST MED SLOW SLOW2
1 MHz to 300 MHz
+1 dBm 15.6 13.8 12.3 11.8
-22.9 dBm to +0.9 dBm 48 35.6 25.5 21.7
-40 dBm to -23 dBm 277.15 193.45 122.5 87.1
300.1 MHz to 1000.0 MHz
+1 dBm 35.6 33.8 32.3 31.8
-22.9 dBm to +0.9 dBm 68 55.6 45.5 41.7
-40 dBm to -23 dBm 297.15 213.45 142.5 107.1
1000.1 MHz to 1300 MHz
+1 dBm 45.6 43.8 42.3 41.8
-22.9 dBm to +0.9 dBm 78 65.6 55.5 51.7
-40 dBm to -23 dBm 307.15 223.45 152.5 117.1
1000.1 MHz to 1300 MHz
+1 dBm 75.6 73.8 72.3 71.8
-22.9 dBm to +0.9 dBm 108 95.6 85.5 81.7
-40 dBm to -23 dBm 337.15 253.45 182.5 147.1
1000.1 MHz to 1300 MHz
+1 dBm 143.2 140.2 135.9 134.6
-22.9 dBm to +0.9 dBm 168 155.6 145.5 141.7
-40 dBm to -23 dBm 397.15 313.45 242.5 207.1
Zs =
( Zsr + 0.5 × F )
1000
Yo =
( Yor + 0.15 × F )
1000000
[%] ( Zx : Z measured value in [Ω] )
Eb =
Zs
Zx
Yo × 100
Zx
+ .
( )
[Ω] ( F : measurement frequency [MHz] )
[S] ( F : measurement frequency [MHz] )
18
Frequency [MHz] Frequency [MHz]
0.01 0.01
0.1 0.1
1 1
10 10
100 100
1000 1000
10000 10000
1 p 1 f
1 n 1 p
1 m 1 u
1 u 1 n
10 p 10 f
10 n 10 p
10 m 10 u
10 u 10 n
100 p 100 f
100 n 100 p
100 m 100 u
100 u 100 n
L
[
H
]
C
[
F
]
Basic measurement confirmation table
Range of measurements
Range of measurements L Range of measurements C
IM7580A / IM7581 IM7583 / IM7585 / IM7587
(For -7dBm to +7dBm, SLOW2.) (For +1dBm, SLOW2.)
0.8 % 0.8 %
1 % 1 %
2 % 2 %
5 % 5 %
10 % 10 %
Measurement frequency [MHz] Measurement frequency [MHz]
Z
[Ω]
Z
[Ω]
0.1 1
1 10
100 1000
10 100
1000 1000
100 100
10 10
1 1
0.1 0.1
19
External control
List of EXT I/O handler interface signals
Timing chart
*In this example, the TRIG signal’s active edge is the falling edge (ON). EOM: Off from trigger input to end of measurement processing
INDEX: Off during probe chuck (probe cannot be removed from target)
Pin I/O Signal
1 IN TRIG
2 IN Unused
3 IN Unused
4 IN LD1
5 IN LD3
6 IN LD5
7 IN Unused
8 - ISO_5V
9 - ISO_COM
10 OUT ERR
11 OUT PARA1-HI,BIN1,PARA1-NG
12 OUT PARA1-LO,BIN3,PARA2-NG
13 OUT PARA2-IN,BIN5,PARA3-NG
14 OUT AND,BIN7
15 OUT PARA3-IN,BIN9,PARA4-IN
16 OUT PARA4-HI
17 OUT PARA4-LO
18 OUT Unused
19 OUT OUT_OF_BINS,CIRCUIT_NG
20 IN Unused
21 IN Unused
22 IN LD0
23 IN LD2
24 IN LD4
25 IN LD6
26 IN LD_VALID
27 - ISO_COM
28 OUT EOM
29 OUT INDEX
30 OUT PARA1-IN,BIN2,PARA1-IN
31 OUT PARA2-HI,BIN4,PARA2-IN
32 OUT PARA2-LO,BIN6,PARA3-IN
33 OUT PARA3-HI,BIN8,PARA4-NG
34 OUT PARA3-LO,BIN10
35 OUT PARA4-IN
36 OUT Unused
37 OUT Unused
Signal Function
TRIG External trigger
LD0 to LD6 Panel number selection
EOM Measurement complete signal
INDEX Analog measurement complete signal
ERR Detection level error
LD_VALID Panel load
ISO_5V Isolated power supply 5 V input
ISO_COM Isolated power supply common
PARA1-HI to PARA4-HI Comparator judgment result: HI judgment
PARA1-IN to PARA4-IN Comparator judgment result: IN judgment
PARA1-LO to PARA4-LO Comparator judgment result: LO judgment
OUT_OF_BINS Bin measurement result
BIN1-BIN10 Bin judgment allocation: Bin 1 to Bin 10
CIRCUIT_NG
Equivalent circuit analysis: Comparator
judgment result
PARA1-NG to PARA4-NG Peak judgment result
PARA1-IN to PARA3-IN Peak judgment result
AND
Result of applying a logical AND
operation to judgment results for
measured values for four parameters
(output when all judgment results are IN)
Connector
used
D-sub 37-pin
Female #4-40 inch
thread
Compatible
connectors
DC-37P-ULR (solder)
DCSP-JB37PR (crimp)
Japan Aviation Electronics Industry, Ltd.
Judgment result
Previous
judgment result
Chuck
ON
ON
ON ON
ON
OFF
OFF
OFF
Chuck
Open
Connection state
TRIG
(Measurement
start signal)
EOM
(Measurement
complete signal)
INDEX
(Analog measurement
complete signal)
ERR
(Error signal)
(Judgment result output)
LD_VALID
LD0 to LD6
Example of LCR Mode measurement timing Example of Analyzer Mode measurement timing
Judgment result
Previous
judgment result
Chuck
ON
ON
ON ON
ON
OFF
OFF
OFF
Chuck
Open
Connection state
TRIG
(Measurement
start signal)
EOM
(Measurement
complete signal)
INDEX
(Analog measurement
complete signal)
ERR
(Error signal)
(Judgment result output)
LD_VALID
LD0 to LD6
2 1
4 3
6 5
8 7
9
20
21
22
23
24
25
26
27
28
29
30
31
32
33
34
35
36
37
14
15
16
17
18
19 10
11
12
13
Electrical
specifications
Input signals
Photocoupler-isolated, no-voltage contact input
Input “on” voltage: 0 V to 0.9 V / input “off” voltage: open or 5 V to 24 V
Output
signals
Isolated NPN open collector output
Maximum load voltage: 30 V / maximum output current: 50 mA/channel
Residual voltage: 1 V or less (10 mA) or 1.5 V or less (50 mA)
Built-in isolated
power supply
Voltage: 4.5 V to 5 V / maximum output current: 100 mA
Floating relative to protective ground potential and measurement circuit
HEADQUARTERS
	 81 Koizumi,
Ueda, Nagano 386-1192 Japan
	https://www.hioki.com/
All information correct as of Sept. 9, 2019. All specifications are subject to change without notice. series_IM7580E6-99M Printed in Japan
DISTRIBUTED BY
Note: Company names and Product names appearing in this catalog are trademarks or registered trademarks of various companies.
Options
Interfaces
GP-IB INTERFACE Z3000 RS-232C INTERFACE Z3001 RS-232C CABLE 9637
Cable length : 1.8 m (5.91 ft)
GP-IB CONNECTION CABLE 9151-02
Cable length : 2 m (6.56 ft)
*Any interlink-compatible cross-cable can be used as the RS-232C CABLE.
Instrument
Product / Order code
Composition : Main unit, Test Head, Connection cable
Accessories : Power cord, Instruction manual,
Impedance analyzer application disc
Photo: IM7581
Photo: IM7587
Model
(Measurement frequency)
Connection cable
length
Order code
IMPEDANCE ANALYZER IM7580A
(1 MHz to 300 MHz)
1 m (3.28 ft) IM7580A -1
2 m (6.56 ft) IM7580A - 2
IMPEDANCE ANALYZER IM7581
(100 kHz to 300 MHz)
1 m (3.28 ft) IM7581 - 01
2 m (6.56 ft) IM7581 - 02
IMPEDANCE ANALYZER IM7583
(1 MHz to 600 MHz)
1 m (3.28 ft) IM7583 - 01
2 m (6.56 ft) IM7583 - 02
IMPEDANCE ANALYZER IM7585
(1 MHz to 1.3 GHz)
1 m (3.28 ft) IM7585 - 01
2 m (6.56 ft) IM7585 - 02
IMPEDANCE ANALYZER IM7587
(1 MHz to 3 GHz)
1 m (3.28 ft) IM7587- 01
2 m (6.56 ft) IM7587- 02
Test fixtures or probes
are not included with the
main unit.
Dedicated test fixture
required.
(See page 14 in this
catalog.)
Accuracy calculation
with included software
Free software for
automatically calculating
measurement accuracy
based on user-entered
measurement conditions
and measurement results
can be downloaded from
Hioki’s website.

More Related Content

What's hot

Datasheet Fluke 1750. Hubungi PT. Siwali Swantika 021-45850618
Datasheet Fluke 1750. Hubungi PT. Siwali Swantika 021-45850618Datasheet Fluke 1750. Hubungi PT. Siwali Swantika 021-45850618
Datasheet Fluke 1750. Hubungi PT. Siwali Swantika 021-45850618PT. Siwali Swantika
 
QUALIFICATION OF UV-VISIBLE SPECTROPHOTOMETER, FTIR, DSC, HPLC
QUALIFICATION OF UV-VISIBLE SPECTROPHOTOMETER, FTIR, DSC, HPLCQUALIFICATION OF UV-VISIBLE SPECTROPHOTOMETER, FTIR, DSC, HPLC
QUALIFICATION OF UV-VISIBLE SPECTROPHOTOMETER, FTIR, DSC, HPLCAnupriyaNR
 
Datasheet Fluke 52120A Extended. Specification. Hubungi PT. Siwali Swantika 0...
Datasheet Fluke 52120A Extended. Specification. Hubungi PT. Siwali Swantika 0...Datasheet Fluke 52120A Extended. Specification. Hubungi PT. Siwali Swantika 0...
Datasheet Fluke 52120A Extended. Specification. Hubungi PT. Siwali Swantika 0...PT. Siwali Swantika
 
Datasheet Fluke BT500 - Hubungi PT. Siwali Swantika 021-45850618
Datasheet Fluke BT500 - Hubungi PT. Siwali Swantika 021-45850618Datasheet Fluke BT500 - Hubungi PT. Siwali Swantika 021-45850618
Datasheet Fluke BT500 - Hubungi PT. Siwali Swantika 021-45850618PT. Siwali Swantika
 
Datasheet Fluke 9190A. Hubungi PT. Siwali Swantika 021-45850618
Datasheet Fluke 9190A. Hubungi PT. Siwali Swantika 021-45850618Datasheet Fluke 9190A. Hubungi PT. Siwali Swantika 021-45850618
Datasheet Fluke 9190A. Hubungi PT. Siwali Swantika 021-45850618PT. Siwali Swantika
 
RIGOL Real-time spectrum analyzer RSA5000 Series
RIGOL Real-time spectrum analyzer RSA5000 SeriesRIGOL Real-time spectrum analyzer RSA5000 Series
RIGOL Real-time spectrum analyzer RSA5000 SeriesNIHON DENKEI SINGAPORE
 
Kimo MP 200 P Thermo Anemometer Datasheet
Kimo MP 200 P Thermo Anemometer DatasheetKimo MP 200 P Thermo Anemometer Datasheet
Kimo MP 200 P Thermo Anemometer Datasheetalessandrascottfeo
 
Datasheet Fluke A40B. Hubungi PT. Siwali Swantika 021-45850618
Datasheet Fluke A40B. Hubungi PT. Siwali Swantika 021-45850618Datasheet Fluke A40B. Hubungi PT. Siwali Swantika 021-45850618
Datasheet Fluke A40B. Hubungi PT. Siwali Swantika 021-45850618PT. Siwali Swantika
 
Datasheet Fluke 5080A. Hubungi PT. Siwali Swantika 021-45850618
Datasheet Fluke 5080A. Hubungi PT. Siwali Swantika 021-45850618Datasheet Fluke 5080A. Hubungi PT. Siwali Swantika 021-45850618
Datasheet Fluke 5080A. Hubungi PT. Siwali Swantika 021-45850618PT. Siwali Swantika
 
G.c power point by royal debnath
G.c power point by royal debnathG.c power point by royal debnath
G.c power point by royal debnathhusnatazeen
 
Fluke Data Acquisition System Selection Guide. Hubungi PT. Siwali Swantika 02...
Fluke Data Acquisition System Selection Guide. Hubungi PT. Siwali Swantika 02...Fluke Data Acquisition System Selection Guide. Hubungi PT. Siwali Swantika 02...
Fluke Data Acquisition System Selection Guide. Hubungi PT. Siwali Swantika 02...PT. Siwali Swantika
 
Datasheet Fluke 7380A. Hubungi PT. Siwali Swantika 021-45850618
Datasheet Fluke 7380A. Hubungi PT. Siwali Swantika 021-45850618Datasheet Fluke 7380A. Hubungi PT. Siwali Swantika 021-45850618
Datasheet Fluke 7380A. Hubungi PT. Siwali Swantika 021-45850618PT. Siwali Swantika
 
Oxymax cos41 endress+hauser datasheet-measurement of the dissolved oxygen
Oxymax cos41 endress+hauser datasheet-measurement of the dissolved oxygenOxymax cos41 endress+hauser datasheet-measurement of the dissolved oxygen
Oxymax cos41 endress+hauser datasheet-measurement of the dissolved oxygenENVIMART
 
Datasheet Fluke 5790B. Hubungi PT. Siwali Swantika 021-45850618
 Datasheet Fluke 5790B. Hubungi PT. Siwali Swantika 021-45850618 Datasheet Fluke 5790B. Hubungi PT. Siwali Swantika 021-45850618
Datasheet Fluke 5790B. Hubungi PT. Siwali Swantika 021-45850618PT. Siwali Swantika
 
Amo incremental _length_encoder_catalog
Amo incremental _length_encoder_catalogAmo incremental _length_encoder_catalog
Amo incremental _length_encoder_catalogElectromate
 
Tunix Corporation | Temperature Measure | Supplier of All Industrial instruments
Tunix Corporation | Temperature Measure | Supplier of All Industrial instrumentsTunix Corporation | Temperature Measure | Supplier of All Industrial instruments
Tunix Corporation | Temperature Measure | Supplier of All Industrial instrumentsSaurabhPishwe
 

What's hot (20)

Datasheet Fluke 1750. Hubungi PT. Siwali Swantika 021-45850618
Datasheet Fluke 1750. Hubungi PT. Siwali Swantika 021-45850618Datasheet Fluke 1750. Hubungi PT. Siwali Swantika 021-45850618
Datasheet Fluke 1750. Hubungi PT. Siwali Swantika 021-45850618
 
QUALIFICATION OF UV-VISIBLE SPECTROPHOTOMETER, FTIR, DSC, HPLC
QUALIFICATION OF UV-VISIBLE SPECTROPHOTOMETER, FTIR, DSC, HPLCQUALIFICATION OF UV-VISIBLE SPECTROPHOTOMETER, FTIR, DSC, HPLC
QUALIFICATION OF UV-VISIBLE SPECTROPHOTOMETER, FTIR, DSC, HPLC
 
Datasheet Fluke 52120A Extended. Specification. Hubungi PT. Siwali Swantika 0...
Datasheet Fluke 52120A Extended. Specification. Hubungi PT. Siwali Swantika 0...Datasheet Fluke 52120A Extended. Specification. Hubungi PT. Siwali Swantika 0...
Datasheet Fluke 52120A Extended. Specification. Hubungi PT. Siwali Swantika 0...
 
Datasheet Fluke BT500 - Hubungi PT. Siwali Swantika 021-45850618
Datasheet Fluke BT500 - Hubungi PT. Siwali Swantika 021-45850618Datasheet Fluke BT500 - Hubungi PT. Siwali Swantika 021-45850618
Datasheet Fluke BT500 - Hubungi PT. Siwali Swantika 021-45850618
 
Datasheet Fluke 9190A. Hubungi PT. Siwali Swantika 021-45850618
Datasheet Fluke 9190A. Hubungi PT. Siwali Swantika 021-45850618Datasheet Fluke 9190A. Hubungi PT. Siwali Swantika 021-45850618
Datasheet Fluke 9190A. Hubungi PT. Siwali Swantika 021-45850618
 
RIGOL Real-time spectrum analyzer RSA5000 Series
RIGOL Real-time spectrum analyzer RSA5000 SeriesRIGOL Real-time spectrum analyzer RSA5000 Series
RIGOL Real-time spectrum analyzer RSA5000 Series
 
Kimo MP 200 P Thermo Anemometer Datasheet
Kimo MP 200 P Thermo Anemometer DatasheetKimo MP 200 P Thermo Anemometer Datasheet
Kimo MP 200 P Thermo Anemometer Datasheet
 
Datasheet Fluke A40B. Hubungi PT. Siwali Swantika 021-45850618
Datasheet Fluke A40B. Hubungi PT. Siwali Swantika 021-45850618Datasheet Fluke A40B. Hubungi PT. Siwali Swantika 021-45850618
Datasheet Fluke A40B. Hubungi PT. Siwali Swantika 021-45850618
 
Datasheet Fluke 5080A. Hubungi PT. Siwali Swantika 021-45850618
Datasheet Fluke 5080A. Hubungi PT. Siwali Swantika 021-45850618Datasheet Fluke 5080A. Hubungi PT. Siwali Swantika 021-45850618
Datasheet Fluke 5080A. Hubungi PT. Siwali Swantika 021-45850618
 
G.c power point by royal debnath
G.c power point by royal debnathG.c power point by royal debnath
G.c power point by royal debnath
 
Fluke Data Acquisition System Selection Guide. Hubungi PT. Siwali Swantika 02...
Fluke Data Acquisition System Selection Guide. Hubungi PT. Siwali Swantika 02...Fluke Data Acquisition System Selection Guide. Hubungi PT. Siwali Swantika 02...
Fluke Data Acquisition System Selection Guide. Hubungi PT. Siwali Swantika 02...
 
Datasheet Fluke 7380A. Hubungi PT. Siwali Swantika 021-45850618
Datasheet Fluke 7380A. Hubungi PT. Siwali Swantika 021-45850618Datasheet Fluke 7380A. Hubungi PT. Siwali Swantika 021-45850618
Datasheet Fluke 7380A. Hubungi PT. Siwali Swantika 021-45850618
 
Oxymax cos41 endress+hauser datasheet-measurement of the dissolved oxygen
Oxymax cos41 endress+hauser datasheet-measurement of the dissolved oxygenOxymax cos41 endress+hauser datasheet-measurement of the dissolved oxygen
Oxymax cos41 endress+hauser datasheet-measurement of the dissolved oxygen
 
Hioki data logger selection
Hioki data logger selectionHioki data logger selection
Hioki data logger selection
 
Datasheet Fluke 5790B. Hubungi PT. Siwali Swantika 021-45850618
 Datasheet Fluke 5790B. Hubungi PT. Siwali Swantika 021-45850618 Datasheet Fluke 5790B. Hubungi PT. Siwali Swantika 021-45850618
Datasheet Fluke 5790B. Hubungi PT. Siwali Swantika 021-45850618
 
Katalog trotec-thermal-anemometer-tridinamika
Katalog trotec-thermal-anemometer-tridinamikaKatalog trotec-thermal-anemometer-tridinamika
Katalog trotec-thermal-anemometer-tridinamika
 
RIA46
RIA46RIA46
RIA46
 
Electromagnetic flow meter
Electromagnetic flow meterElectromagnetic flow meter
Electromagnetic flow meter
 
Amo incremental _length_encoder_catalog
Amo incremental _length_encoder_catalogAmo incremental _length_encoder_catalog
Amo incremental _length_encoder_catalog
 
Tunix Corporation | Temperature Measure | Supplier of All Industrial instruments
Tunix Corporation | Temperature Measure | Supplier of All Industrial instrumentsTunix Corporation | Temperature Measure | Supplier of All Industrial instruments
Tunix Corporation | Temperature Measure | Supplier of All Industrial instruments
 

Similar to Hioki series im7580_e6-99m Impedance analyzer 1.3GHz

Oscilloscope Fundamentals, Hands-On Course at EELive 2014
Oscilloscope Fundamentals, Hands-On Course at EELive 2014Oscilloscope Fundamentals, Hands-On Course at EELive 2014
Oscilloscope Fundamentals, Hands-On Course at EELive 2014Rohde & Schwarz North America
 
POWER ANALYZER HIOKI PW3390 - Instrumentos de Medida S.L.
POWER ANALYZER HIOKI PW3390 - Instrumentos de Medida S.L.POWER ANALYZER HIOKI PW3390 - Instrumentos de Medida S.L.
POWER ANALYZER HIOKI PW3390 - Instrumentos de Medida S.L.Antonio Gutiérrez Guerrero
 
Sleep 2008 Electronicsv.3
Sleep 2008 Electronicsv.3Sleep 2008 Electronicsv.3
Sleep 2008 Electronicsv.3weckhardt
 
Jd748a ds-cpo-tm-ae
Jd748a ds-cpo-tm-aeJd748a ds-cpo-tm-ae
Jd748a ds-cpo-tm-aeHoài Hà
 
Characteristic of transducetr.ppt
Characteristic of transducetr.pptCharacteristic of transducetr.ppt
Characteristic of transducetr.pptSenthilKumarP45
 
Pharmaceutical validation
Pharmaceutical validationPharmaceutical validation
Pharmaceutical validationMohiniTawade
 
Noiseken electromagnetic field visualization system - denkei
Noiseken electromagnetic field visualization system - denkeiNoiseken electromagnetic field visualization system - denkei
Noiseken electromagnetic field visualization system - denkeiNIHON DENKEI SINGAPORE
 
Rion sxa1/Va Vibration Analysis Program
Rion sxa1/Va  Vibration Analysis ProgramRion sxa1/Va  Vibration Analysis Program
Rion sxa1/Va Vibration Analysis ProgramNIHON DENKEI SINGAPORE
 
Analog to Digital Converters
Analog to Digital ConvertersAnalog to Digital Converters
Analog to Digital ConvertersAnas Smarty
 
Hioki Electrical Measuring Instruments in Bangladesh
Hioki Electrical Measuring Instruments in BangladeshHioki Electrical Measuring Instruments in Bangladesh
Hioki Electrical Measuring Instruments in BangladeshROnex International
 
Hioki Electrical Measuring Instruments in Bangladesh
Hioki Electrical Measuring Instruments in BangladeshHioki Electrical Measuring Instruments in Bangladesh
Hioki Electrical Measuring Instruments in BangladeshRonexmeterbd
 
Micro e systems_ops_ds_datasheet
Micro e systems_ops_ds_datasheetMicro e systems_ops_ds_datasheet
Micro e systems_ops_ds_datasheetElectromate
 
01. Sensors and Actuators.ppt
01. Sensors and Actuators.ppt01. Sensors and Actuators.ppt
01. Sensors and Actuators.pptprashant360377
 
Hantek DSO5072P Datasheet
Hantek DSO5072P DatasheetHantek DSO5072P Datasheet
Hantek DSO5072P DatasheetRimsky Cheng
 
Introduction of SG-O CIS / ALS / Light-Sensor Wafer Tester
Introduction of SG-O CIS / ALS / Light-Sensor Wafer TesterIntroduction of SG-O CIS / ALS / Light-Sensor Wafer Tester
Introduction of SG-O CIS / ALS / Light-Sensor Wafer TesterEnlitech
 
Micro e systems_data_sheet-optira_series_preliminary_v2
Micro e systems_data_sheet-optira_series_preliminary_v2Micro e systems_data_sheet-optira_series_preliminary_v2
Micro e systems_data_sheet-optira_series_preliminary_v2Electromate
 
Hioki bt3564 High voltage Battery tester
Hioki bt3564 High voltage Battery testerHioki bt3564 High voltage Battery tester
Hioki bt3564 High voltage Battery testerNIHON DENKEI SINGAPORE
 
Datasheet Fluke 317. Hubungi PT. Siwali Swantika 021-45850618
Datasheet Fluke 317. Hubungi PT. Siwali Swantika 021-45850618Datasheet Fluke 317. Hubungi PT. Siwali Swantika 021-45850618
Datasheet Fluke 317. Hubungi PT. Siwali Swantika 021-45850618PT. Siwali Swantika
 
Vibration meter vm 82-a_datasheet_rion
Vibration meter vm 82-a_datasheet_rionVibration meter vm 82-a_datasheet_rion
Vibration meter vm 82-a_datasheet_rionNIHON DENKEI SINGAPORE
 

Similar to Hioki series im7580_e6-99m Impedance analyzer 1.3GHz (20)

Oscilloscope Fundamentals, Hands-On Course at EELive 2014
Oscilloscope Fundamentals, Hands-On Course at EELive 2014Oscilloscope Fundamentals, Hands-On Course at EELive 2014
Oscilloscope Fundamentals, Hands-On Course at EELive 2014
 
POWER ANALYZER HIOKI PW3390 - Instrumentos de Medida S.L.
POWER ANALYZER HIOKI PW3390 - Instrumentos de Medida S.L.POWER ANALYZER HIOKI PW3390 - Instrumentos de Medida S.L.
POWER ANALYZER HIOKI PW3390 - Instrumentos de Medida S.L.
 
Sleep 2008 Electronicsv.3
Sleep 2008 Electronicsv.3Sleep 2008 Electronicsv.3
Sleep 2008 Electronicsv.3
 
Jd748a ds-cpo-tm-ae
Jd748a ds-cpo-tm-aeJd748a ds-cpo-tm-ae
Jd748a ds-cpo-tm-ae
 
Characteristic of transducetr.ppt
Characteristic of transducetr.pptCharacteristic of transducetr.ppt
Characteristic of transducetr.ppt
 
Pharmaceutical validation
Pharmaceutical validationPharmaceutical validation
Pharmaceutical validation
 
Noiseken electromagnetic field visualization system - denkei
Noiseken electromagnetic field visualization system - denkeiNoiseken electromagnetic field visualization system - denkei
Noiseken electromagnetic field visualization system - denkei
 
dsp dip.pptx
dsp dip.pptxdsp dip.pptx
dsp dip.pptx
 
Rion sxa1/Va Vibration Analysis Program
Rion sxa1/Va  Vibration Analysis ProgramRion sxa1/Va  Vibration Analysis Program
Rion sxa1/Va Vibration Analysis Program
 
Analog to Digital Converters
Analog to Digital ConvertersAnalog to Digital Converters
Analog to Digital Converters
 
Hioki Electrical Measuring Instruments in Bangladesh
Hioki Electrical Measuring Instruments in BangladeshHioki Electrical Measuring Instruments in Bangladesh
Hioki Electrical Measuring Instruments in Bangladesh
 
Hioki Electrical Measuring Instruments in Bangladesh
Hioki Electrical Measuring Instruments in BangladeshHioki Electrical Measuring Instruments in Bangladesh
Hioki Electrical Measuring Instruments in Bangladesh
 
Micro e systems_ops_ds_datasheet
Micro e systems_ops_ds_datasheetMicro e systems_ops_ds_datasheet
Micro e systems_ops_ds_datasheet
 
01. Sensors and Actuators.ppt
01. Sensors and Actuators.ppt01. Sensors and Actuators.ppt
01. Sensors and Actuators.ppt
 
Hantek DSO5072P Datasheet
Hantek DSO5072P DatasheetHantek DSO5072P Datasheet
Hantek DSO5072P Datasheet
 
Introduction of SG-O CIS / ALS / Light-Sensor Wafer Tester
Introduction of SG-O CIS / ALS / Light-Sensor Wafer TesterIntroduction of SG-O CIS / ALS / Light-Sensor Wafer Tester
Introduction of SG-O CIS / ALS / Light-Sensor Wafer Tester
 
Micro e systems_data_sheet-optira_series_preliminary_v2
Micro e systems_data_sheet-optira_series_preliminary_v2Micro e systems_data_sheet-optira_series_preliminary_v2
Micro e systems_data_sheet-optira_series_preliminary_v2
 
Hioki bt3564 High voltage Battery tester
Hioki bt3564 High voltage Battery testerHioki bt3564 High voltage Battery tester
Hioki bt3564 High voltage Battery tester
 
Datasheet Fluke 317. Hubungi PT. Siwali Swantika 021-45850618
Datasheet Fluke 317. Hubungi PT. Siwali Swantika 021-45850618Datasheet Fluke 317. Hubungi PT. Siwali Swantika 021-45850618
Datasheet Fluke 317. Hubungi PT. Siwali Swantika 021-45850618
 
Vibration meter vm 82-a_datasheet_rion
Vibration meter vm 82-a_datasheet_rionVibration meter vm 82-a_datasheet_rion
Vibration meter vm 82-a_datasheet_rion
 

More from NIHON DENKEI SINGAPORE

Quantum Computer - Low noise signal processing solution
Quantum Computer - Low noise signal processing solutionQuantum Computer - Low noise signal processing solution
Quantum Computer - Low noise signal processing solutionNIHON DENKEI SINGAPORE
 
MTI Japan Magnetic Field Measurement Instruments
MTI Japan Magnetic Field Measurement InstrumentsMTI Japan Magnetic Field Measurement Instruments
MTI Japan Magnetic Field Measurement InstrumentsNIHON DENKEI SINGAPORE
 
catalog-en-20190708_safety_training_machine.pdf
catalog-en-20190708_safety_training_machine.pdfcatalog-en-20190708_safety_training_machine.pdf
catalog-en-20190708_safety_training_machine.pdfNIHON DENKEI SINGAPORE
 
Ono sokki ds3000 Data Station DS-3000 series Sound and Vibration Real-time...
Ono sokki ds3000  Data Station  DS-3000 series  Sound and Vibration Real-time...Ono sokki ds3000  Data Station  DS-3000 series  Sound and Vibration Real-time...
Ono sokki ds3000 Data Station DS-3000 series Sound and Vibration Real-time...NIHON DENKEI SINGAPORE
 
HIOKI Current Series sensors probes_e1-1_zb
HIOKI Current  Series sensors probes_e1-1_zbHIOKI Current  Series sensors probes_e1-1_zb
HIOKI Current Series sensors probes_e1-1_zbNIHON DENKEI SINGAPORE
 
Hioki Field measuring instruments 2022 catalogue
Hioki Field measuring instruments 2022 catalogueHioki Field measuring instruments 2022 catalogue
Hioki Field measuring instruments 2022 catalogueNIHON DENKEI SINGAPORE
 
Hioki Electrical measuring instruments 2022 catalogue
Hioki Electrical measuring instruments 2022 catalogueHioki Electrical measuring instruments 2022 catalogue
Hioki Electrical measuring instruments 2022 catalogueNIHON DENKEI SINGAPORE
 
KG Electronic load DC power supply Ripple and Noise meter
KG Electronic load DC power supply Ripple and Noise meterKG Electronic load DC power supply Ripple and Noise meter
KG Electronic load DC power supply Ripple and Noise meterNIHON DENKEI SINGAPORE
 
ONO SOKKI Elevator Speedometer EC-2100
ONO SOKKI Elevator Speedometer  EC-2100ONO SOKKI Elevator Speedometer  EC-2100
ONO SOKKI Elevator Speedometer EC-2100NIHON DENKEI SINGAPORE
 
KIKUSUI PBZ Series Intelligent Bi-Polar Power Supplies
KIKUSUI PBZ Series Intelligent Bi-Polar Power Supplies KIKUSUI PBZ Series Intelligent Bi-Polar Power Supplies
KIKUSUI PBZ Series Intelligent Bi-Polar Power Supplies NIHON DENKEI SINGAPORE
 
Rion product for_the_automotive_industry
Rion product for_the_automotive_industry Rion product for_the_automotive_industry
Rion product for_the_automotive_industry NIHON DENKEI SINGAPORE
 
ADCMT DC Voltage Current Source/Monitor Catalog 6253 DENKEI
ADCMT DC Voltage Current Source/Monitor  Catalog 6253  DENKEIADCMT DC Voltage Current Source/Monitor  Catalog 6253  DENKEI
ADCMT DC Voltage Current Source/Monitor Catalog 6253 DENKEINIHON DENKEI SINGAPORE
 
RIGOL Programmable linear DC power supply DP800 Series
RIGOL  Programmable linear DC power supply DP800 SeriesRIGOL  Programmable linear DC power supply DP800 Series
RIGOL Programmable linear DC power supply DP800 SeriesNIHON DENKEI SINGAPORE
 
Aikoh General Catalogue in Japanese catj201907
Aikoh General Catalogue in Japanese  catj201907Aikoh General Catalogue in Japanese  catj201907
Aikoh General Catalogue in Japanese catj201907NIHON DENKEI SINGAPORE
 
TEAC Color Graphics digital indicator Td 9000 t
TEAC Color Graphics digital indicator Td 9000 t TEAC Color Graphics digital indicator Td 9000 t
TEAC Color Graphics digital indicator Td 9000 t NIHON DENKEI SINGAPORE
 

More from NIHON DENKEI SINGAPORE (20)

Quantum Computer - Low noise signal processing solution
Quantum Computer - Low noise signal processing solutionQuantum Computer - Low noise signal processing solution
Quantum Computer - Low noise signal processing solution
 
MTI Japan Magnetic Field Measurement Instruments
MTI Japan Magnetic Field Measurement InstrumentsMTI Japan Magnetic Field Measurement Instruments
MTI Japan Magnetic Field Measurement Instruments
 
catalog-en-20190708_safety_training_machine.pdf
catalog-en-20190708_safety_training_machine.pdfcatalog-en-20190708_safety_training_machine.pdf
catalog-en-20190708_safety_training_machine.pdf
 
Ono sokki ds3000 Data Station DS-3000 series Sound and Vibration Real-time...
Ono sokki ds3000  Data Station  DS-3000 series  Sound and Vibration Real-time...Ono sokki ds3000  Data Station  DS-3000 series  Sound and Vibration Real-time...
Ono sokki ds3000 Data Station DS-3000 series Sound and Vibration Real-time...
 
HIOKI Current Series sensors probes_e1-1_zb
HIOKI Current  Series sensors probes_e1-1_zbHIOKI Current  Series sensors probes_e1-1_zb
HIOKI Current Series sensors probes_e1-1_zb
 
Hioki Field measuring instruments 2022 catalogue
Hioki Field measuring instruments 2022 catalogueHioki Field measuring instruments 2022 catalogue
Hioki Field measuring instruments 2022 catalogue
 
Hioki Electrical measuring instruments 2022 catalogue
Hioki Electrical measuring instruments 2022 catalogueHioki Electrical measuring instruments 2022 catalogue
Hioki Electrical measuring instruments 2022 catalogue
 
9322 Hioki Differential Probe
9322 Hioki Differential Probe9322 Hioki Differential Probe
9322 Hioki Differential Probe
 
KG Electronic load DC power supply Ripple and Noise meter
KG Electronic load DC power supply Ripple and Noise meterKG Electronic load DC power supply Ripple and Noise meter
KG Electronic load DC power supply Ripple and Noise meter
 
HIOKI Power Analyzer Pw8001
HIOKI Power Analyzer  Pw8001 HIOKI Power Analyzer  Pw8001
HIOKI Power Analyzer Pw8001
 
ONO SOKKI Elevator Speedometer EC-2100
ONO SOKKI Elevator Speedometer  EC-2100ONO SOKKI Elevator Speedometer  EC-2100
ONO SOKKI Elevator Speedometer EC-2100
 
KIKUSUI PBZ Series Intelligent Bi-Polar Power Supplies
KIKUSUI PBZ Series Intelligent Bi-Polar Power Supplies KIKUSUI PBZ Series Intelligent Bi-Polar Power Supplies
KIKUSUI PBZ Series Intelligent Bi-Polar Power Supplies
 
Rion product for_the_automotive_industry
Rion product for_the_automotive_industry Rion product for_the_automotive_industry
Rion product for_the_automotive_industry
 
HIOKI BYPASS DIODE TESTER FT4310
HIOKI BYPASS DIODE TESTER FT4310HIOKI BYPASS DIODE TESTER FT4310
HIOKI BYPASS DIODE TESTER FT4310
 
TEAC Load cell catalog (JAPAN)
TEAC Load cell catalog  (JAPAN) TEAC Load cell catalog  (JAPAN)
TEAC Load cell catalog (JAPAN)
 
ADCMT DC Voltage Current Source/Monitor Catalog 6253 DENKEI
ADCMT DC Voltage Current Source/Monitor  Catalog 6253  DENKEIADCMT DC Voltage Current Source/Monitor  Catalog 6253  DENKEI
ADCMT DC Voltage Current Source/Monitor Catalog 6253 DENKEI
 
RIGOL Programmable linear DC power supply DP800 Series
RIGOL  Programmable linear DC power supply DP800 SeriesRIGOL  Programmable linear DC power supply DP800 Series
RIGOL Programmable linear DC power supply DP800 Series
 
Rz catalogue cn AIKOH 推拉力计
Rz catalogue cn AIKOH 推拉力计Rz catalogue cn AIKOH 推拉力计
Rz catalogue cn AIKOH 推拉力计
 
Aikoh General Catalogue in Japanese catj201907
Aikoh General Catalogue in Japanese  catj201907Aikoh General Catalogue in Japanese  catj201907
Aikoh General Catalogue in Japanese catj201907
 
TEAC Color Graphics digital indicator Td 9000 t
TEAC Color Graphics digital indicator Td 9000 t TEAC Color Graphics digital indicator Td 9000 t
TEAC Color Graphics digital indicator Td 9000 t
 

Recently uploaded

Platformless Horizons for Digital Adaptability
Platformless Horizons for Digital AdaptabilityPlatformless Horizons for Digital Adaptability
Platformless Horizons for Digital AdaptabilityWSO2
 
Finding Java's Hidden Performance Traps @ DevoxxUK 2024
Finding Java's Hidden Performance Traps @ DevoxxUK 2024Finding Java's Hidden Performance Traps @ DevoxxUK 2024
Finding Java's Hidden Performance Traps @ DevoxxUK 2024Victor Rentea
 
Navigating Identity and Access Management in the Modern Enterprise
Navigating Identity and Access Management in the Modern EnterpriseNavigating Identity and Access Management in the Modern Enterprise
Navigating Identity and Access Management in the Modern EnterpriseWSO2
 
The Zero-ETL Approach: Enhancing Data Agility and Insight
The Zero-ETL Approach: Enhancing Data Agility and InsightThe Zero-ETL Approach: Enhancing Data Agility and Insight
The Zero-ETL Approach: Enhancing Data Agility and InsightSafe Software
 
Corporate and higher education May webinar.pptx
Corporate and higher education May webinar.pptxCorporate and higher education May webinar.pptx
Corporate and higher education May webinar.pptxRustici Software
 
Vector Search -An Introduction in Oracle Database 23ai.pptx
Vector Search -An Introduction in Oracle Database 23ai.pptxVector Search -An Introduction in Oracle Database 23ai.pptx
Vector Search -An Introduction in Oracle Database 23ai.pptxRemote DBA Services
 
Modernizing Legacy Systems Using Ballerina
Modernizing Legacy Systems Using BallerinaModernizing Legacy Systems Using Ballerina
Modernizing Legacy Systems Using BallerinaWSO2
 
TEST BANK For Principles of Anatomy and Physiology, 16th Edition by Gerard J....
TEST BANK For Principles of Anatomy and Physiology, 16th Edition by Gerard J....TEST BANK For Principles of Anatomy and Physiology, 16th Edition by Gerard J....
TEST BANK For Principles of Anatomy and Physiology, 16th Edition by Gerard J....rightmanforbloodline
 
DEV meet-up UiPath Document Understanding May 7 2024 Amsterdam
DEV meet-up UiPath Document Understanding May 7 2024 AmsterdamDEV meet-up UiPath Document Understanding May 7 2024 Amsterdam
DEV meet-up UiPath Document Understanding May 7 2024 AmsterdamUiPathCommunity
 
CNIC Information System with Pakdata Cf In Pakistan
CNIC Information System with Pakdata Cf In PakistanCNIC Information System with Pakdata Cf In Pakistan
CNIC Information System with Pakdata Cf In Pakistandanishmna97
 
How to Check CNIC Information Online with Pakdata cf
How to Check CNIC Information Online with Pakdata cfHow to Check CNIC Information Online with Pakdata cf
How to Check CNIC Information Online with Pakdata cfdanishmna97
 
Introduction to use of FHIR Documents in ABDM
Introduction to use of FHIR Documents in ABDMIntroduction to use of FHIR Documents in ABDM
Introduction to use of FHIR Documents in ABDMKumar Satyam
 
Quantum Leap in Next-Generation Computing
Quantum Leap in Next-Generation ComputingQuantum Leap in Next-Generation Computing
Quantum Leap in Next-Generation ComputingWSO2
 
TrustArc Webinar - Unified Trust Center for Privacy, Security, Compliance, an...
TrustArc Webinar - Unified Trust Center for Privacy, Security, Compliance, an...TrustArc Webinar - Unified Trust Center for Privacy, Security, Compliance, an...
TrustArc Webinar - Unified Trust Center for Privacy, Security, Compliance, an...TrustArc
 
DBX First Quarter 2024 Investor Presentation
DBX First Quarter 2024 Investor PresentationDBX First Quarter 2024 Investor Presentation
DBX First Quarter 2024 Investor PresentationDropbox
 
Repurposing LNG terminals for Hydrogen Ammonia: Feasibility and Cost Saving
Repurposing LNG terminals for Hydrogen Ammonia: Feasibility and Cost SavingRepurposing LNG terminals for Hydrogen Ammonia: Feasibility and Cost Saving
Repurposing LNG terminals for Hydrogen Ammonia: Feasibility and Cost SavingEdi Saputra
 
Modular Monolith - a Practical Alternative to Microservices @ Devoxx UK 2024
Modular Monolith - a Practical Alternative to Microservices @ Devoxx UK 2024Modular Monolith - a Practical Alternative to Microservices @ Devoxx UK 2024
Modular Monolith - a Practical Alternative to Microservices @ Devoxx UK 2024Victor Rentea
 
Choreo: Empowering the Future of Enterprise Software Engineering
Choreo: Empowering the Future of Enterprise Software EngineeringChoreo: Empowering the Future of Enterprise Software Engineering
Choreo: Empowering the Future of Enterprise Software EngineeringWSO2
 
Stronger Together: Developing an Organizational Strategy for Accessible Desig...
Stronger Together: Developing an Organizational Strategy for Accessible Desig...Stronger Together: Developing an Organizational Strategy for Accessible Desig...
Stronger Together: Developing an Organizational Strategy for Accessible Desig...caitlingebhard1
 
Navigating the Deluge_ Dubai Floods and the Resilience of Dubai International...
Navigating the Deluge_ Dubai Floods and the Resilience of Dubai International...Navigating the Deluge_ Dubai Floods and the Resilience of Dubai International...
Navigating the Deluge_ Dubai Floods and the Resilience of Dubai International...Orbitshub
 

Recently uploaded (20)

Platformless Horizons for Digital Adaptability
Platformless Horizons for Digital AdaptabilityPlatformless Horizons for Digital Adaptability
Platformless Horizons for Digital Adaptability
 
Finding Java's Hidden Performance Traps @ DevoxxUK 2024
Finding Java's Hidden Performance Traps @ DevoxxUK 2024Finding Java's Hidden Performance Traps @ DevoxxUK 2024
Finding Java's Hidden Performance Traps @ DevoxxUK 2024
 
Navigating Identity and Access Management in the Modern Enterprise
Navigating Identity and Access Management in the Modern EnterpriseNavigating Identity and Access Management in the Modern Enterprise
Navigating Identity and Access Management in the Modern Enterprise
 
The Zero-ETL Approach: Enhancing Data Agility and Insight
The Zero-ETL Approach: Enhancing Data Agility and InsightThe Zero-ETL Approach: Enhancing Data Agility and Insight
The Zero-ETL Approach: Enhancing Data Agility and Insight
 
Corporate and higher education May webinar.pptx
Corporate and higher education May webinar.pptxCorporate and higher education May webinar.pptx
Corporate and higher education May webinar.pptx
 
Vector Search -An Introduction in Oracle Database 23ai.pptx
Vector Search -An Introduction in Oracle Database 23ai.pptxVector Search -An Introduction in Oracle Database 23ai.pptx
Vector Search -An Introduction in Oracle Database 23ai.pptx
 
Modernizing Legacy Systems Using Ballerina
Modernizing Legacy Systems Using BallerinaModernizing Legacy Systems Using Ballerina
Modernizing Legacy Systems Using Ballerina
 
TEST BANK For Principles of Anatomy and Physiology, 16th Edition by Gerard J....
TEST BANK For Principles of Anatomy and Physiology, 16th Edition by Gerard J....TEST BANK For Principles of Anatomy and Physiology, 16th Edition by Gerard J....
TEST BANK For Principles of Anatomy and Physiology, 16th Edition by Gerard J....
 
DEV meet-up UiPath Document Understanding May 7 2024 Amsterdam
DEV meet-up UiPath Document Understanding May 7 2024 AmsterdamDEV meet-up UiPath Document Understanding May 7 2024 Amsterdam
DEV meet-up UiPath Document Understanding May 7 2024 Amsterdam
 
CNIC Information System with Pakdata Cf In Pakistan
CNIC Information System with Pakdata Cf In PakistanCNIC Information System with Pakdata Cf In Pakistan
CNIC Information System with Pakdata Cf In Pakistan
 
How to Check CNIC Information Online with Pakdata cf
How to Check CNIC Information Online with Pakdata cfHow to Check CNIC Information Online with Pakdata cf
How to Check CNIC Information Online with Pakdata cf
 
Introduction to use of FHIR Documents in ABDM
Introduction to use of FHIR Documents in ABDMIntroduction to use of FHIR Documents in ABDM
Introduction to use of FHIR Documents in ABDM
 
Quantum Leap in Next-Generation Computing
Quantum Leap in Next-Generation ComputingQuantum Leap in Next-Generation Computing
Quantum Leap in Next-Generation Computing
 
TrustArc Webinar - Unified Trust Center for Privacy, Security, Compliance, an...
TrustArc Webinar - Unified Trust Center for Privacy, Security, Compliance, an...TrustArc Webinar - Unified Trust Center for Privacy, Security, Compliance, an...
TrustArc Webinar - Unified Trust Center for Privacy, Security, Compliance, an...
 
DBX First Quarter 2024 Investor Presentation
DBX First Quarter 2024 Investor PresentationDBX First Quarter 2024 Investor Presentation
DBX First Quarter 2024 Investor Presentation
 
Repurposing LNG terminals for Hydrogen Ammonia: Feasibility and Cost Saving
Repurposing LNG terminals for Hydrogen Ammonia: Feasibility and Cost SavingRepurposing LNG terminals for Hydrogen Ammonia: Feasibility and Cost Saving
Repurposing LNG terminals for Hydrogen Ammonia: Feasibility and Cost Saving
 
Modular Monolith - a Practical Alternative to Microservices @ Devoxx UK 2024
Modular Monolith - a Practical Alternative to Microservices @ Devoxx UK 2024Modular Monolith - a Practical Alternative to Microservices @ Devoxx UK 2024
Modular Monolith - a Practical Alternative to Microservices @ Devoxx UK 2024
 
Choreo: Empowering the Future of Enterprise Software Engineering
Choreo: Empowering the Future of Enterprise Software EngineeringChoreo: Empowering the Future of Enterprise Software Engineering
Choreo: Empowering the Future of Enterprise Software Engineering
 
Stronger Together: Developing an Organizational Strategy for Accessible Desig...
Stronger Together: Developing an Organizational Strategy for Accessible Desig...Stronger Together: Developing an Organizational Strategy for Accessible Desig...
Stronger Together: Developing an Organizational Strategy for Accessible Desig...
 
Navigating the Deluge_ Dubai Floods and the Resilience of Dubai International...
Navigating the Deluge_ Dubai Floods and the Resilience of Dubai International...Navigating the Deluge_ Dubai Floods and the Resilience of Dubai International...
Navigating the Deluge_ Dubai Floods and the Resilience of Dubai International...
 

Hioki series im7580_e6-99m Impedance analyzer 1.3GHz

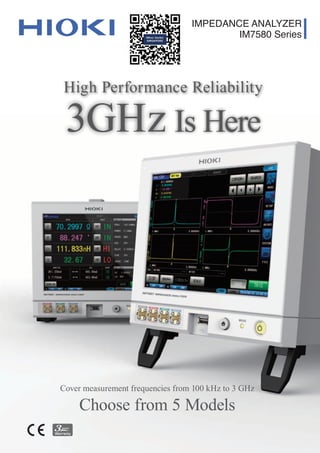
  • 1. IMPEDANCE ANALYZER IM7580 Series Is Here Cover measurement frequencies from 100 kHz to 3 GHz Choose from 5 Models 3GHz High Performance Reliability
  • 2. 2 2 SMD TEST FIXTURE IM9201 (option) Use the 6-in-1 SMD Test Fixture IM9201 (option) to perform easy and reliable measurements. * IM7587 High-stability, high-speed sweeping measurement up to 3 GHz High-stability Impedance Measurement up to 3 GHz* Cover a wide range of measurement frequencies, from 1 MHz to 3 GHz, with a single device. High-stability measurement with minimal variability delivers outstanding cost performance for research and development.
  • 3. 3 3 Stable measurement across a broad range Measurement technology that adds to superior stability Large solid shield for improved performance To achieve favorable frequency characteristics, we painstakingly carried out design true to our basic principles for the individual circuits, board patterning, and case structure. We also used numerical analysis and in-depth verification to optimize the shield structure and the shape of the internal board pattern, thus fitting all the technology necessary to achieve opti- mal frequency characteristics from 100 kHz to 3 GHz into a com- pact body. For the test head measurement terminals, in order to improve their measurement accuracy over a wide range, we used 3.5 mm (0.14 in) connectors with a wide frequency range, which also boast better removability than other microwave connectors. The measurement portion uses a high resolution A/D converter. By controlling the input signal’s level and frequency, the A/D converter’s dynamic range can be utilized to the fullest, achiev- ing measurement with a wide impedance range and minimum variability. In the sub FPGA, built into analog circuits, the digital filter ap- plied optimally for each circuit shuts out noise. At the main FPGA, the 64-bit floating point computation is put through a multi-layered pipeline to achieve high-speed computational pro- cessing with little margin of error. This helps increase the stabil- ity and speed of measurements. Each section uses a solid shield carved to match the on-board pattern or IC shape, thus reducing internal coupling. The shield also reduces external radia- tion and improves noise resis- tance, meeting a high level of EMC, despite being the light- est in its class. Test head for the IM7583, IM7585, and IM7587 Inside the solid shield Advanced Design for Reliable Testing
  • 4. 4 4 All models Repeatability and analog measurement time (Reference data) Maximum speed 0.5ms Achieve measurement with both high speed and high stability. Cut takt time and increase productivity. 0.1 0.1 0.1 0.1 IM7583, IM7585, IM7587 IM7580A, IM7581 Measurement frequency 3 GHz Measurement frequency 500 MHz Measurement frequency 100 MHz Measurement frequency 200 kHz Signal level : +1dBm Sample A : 1nH Signal level : +1dBm Sample B : 1nH Signal level: +1dBm Sample C : 100nH Signal level: +1dBm Sample D : 100μH 0 0 0 0 0.004 0.004 0.1 0.02 0.01 0.008 0.008 0.2 0.04 0.03 0.012 0.012 0.3 0.06 0.05 0.02 0.02 0.016 0.016 0.4 0.08 0.07 1 1 1 1 0.5ms 0.5ms 0.5ms 0.5ms 10 10 10 10 High-speed, highly stable measurement (Analog measurement time) Repeatability (Z, 3CV) [%] Repeatability (Z, 3CV) [%] Repeatability (Z, 3CV) [%] Repeatability (Z, 3CV) [%] Analog measurement time [ms] Analog measurement time [ms] Analog measurement time [ms] Analog measurement time [ms]
  • 5. 5 5 Compact body for greater mobility Test head fits in the palm of your hand Large display for easy operation The half-rack compact body is light and fit not only for line use, but also when measuring various sites on the go. The slim profile of the test head lets you install it close to the measurement target to help minimize influence from noise and other effects and enabling more accurate mea- surement. Customize the large screen according to desired bright- ness, color, and text size to fit your environment.   H ighly re sp o nsive to u ch screen makes measurement settings and adjustments even easier. Compact form factor – 2 analyzers fit side-by-side on a full-size rack. Remarkably lightweight and compact for a measuring instrument of this class. Turntable Fixture Number of display digits (3/4/5/6) Customizable display color (Background and display colors) Customizable text size Space-saving Half-rack Size
  • 6. 6 Photo: IM7581 Photo: IM7585 IMPEDANCE ANALYZER IM7580A IMPEDANCE ANALYZER IM7581 IMPEDANCE ANALYZER IM7583 IMPEDANCE ANALYZER IM7585 IMPEDANCE ANALYZER IM7587 Measurement frequency 1 MHz to 300 MHz Measurement range L : 0.0531 nH to .795 mH C : 0.1061 pF to i.59 μF (Depending on the measurement frequency) Measurement signal level -40.0 dBm to +7.0 dBm Basic accuracy Z : 0.72% rdg. θ: 0.41° Measurement frequency 100 kHz to 300 MHz Measurement range L : 0.0531 nH to 7.95 mH C : 0.1061 pF to 15.9 μF (Depending on the measurement frequency) Measurement signal level -40.0 dBm to +7.0 dBm Basic accuracy Z : 0.72% rdg. θ: 0.41° Measurement frequency 1 MHz to 600 MHz Measurement range L : 0.0265 nH to 0.795 mH C : 0.0531 pF to 1.59 μF (Depending on the measurement frequency) Measurement signal level -40.0 dBm to +1.0 dBm Basic accuracy Z : 0.65% rdg. θ: 0.38° Measurement frequency 1 MHz to 1.3 GHz Measurement range L : 0.0123 nH to 0.795 mH C : 0.0245 pF to 1.59 μF (Depending on the measurement frequency) Measurement signal level -40.0 dBm to +1.0 dBm Basic accuracy Z : 0.65% rdg. θ: 0.38° Measurement frequency 1 MHz to 3 GHz Measurement range L : 0.0053 nH to 0.795 mH C : 0.011 pF to 1.59 μF (Depending on the measurement frequency) Measurement signal level -40.0 dBm to +1.0 dBm Basic accuracy Z : 0.65% rdg. θ: 0.38° Select Your Testing Frequency from 5 Models 5 models support a wide variety of applications IM7580A 1MHz to 600 MHz 1MHz to 1.3 GHz 1MHz to 3 GHz IM7581 IM7583 IM7585 IM7587 100 kHz 1MHz 10 MHz 100 MHz 1GHz 3 GHz 1MHz to 300 MHz 100 kHz to 300 MHz
  • 7. 7 Use LCR Mode to make measurements by applying the desired frequency and level signal to the component being measured. This mode is ideal for evaluating passive samples such as capacitors and coils. Use Analyzer Mode to perform measurement while sweeping through a range of measurement frequencies and measurement signal levels. This mode is ideal for checking frequency characteristics and level characteristics. Dual measurement modes LCR Mode Analyzer Mode Display up to four measurement parameters simultaneously. Z Impedance G Conductance Rp Equivalent parallel resistance Cp Equivalent parallel capacitance Y Admittance B Susceptance Ls Equivalent series inductance D Loss factor tan δ θ Phase angle Q Q-factor Lp Equivalent parallel inductance V Monitor voltage* X Reactance Rs Equivalent series resistance (ESR) Cs Equivalent series capacitance I Monitor current* *Analyzer mode only - HI is displayed - IN is displayed - LO is displayed Comparator measurement : Yield a PASS/FAIL judgment for the target sample based on a single judgment criterion. Normal / segment sweep operation : Discover sample characteristics by sweeping through a range of frequencies and levels. Interval sweep operation : Discover element characteristics over time under set conditions. Bin measurement : Rank samples using multiple judgment criteria. Display HI IN LO Upper limit Reference value Lower limit BIN1 BIN2 BIN3 BIN4 BIN5 . . . . BIN10 IN Set upper and lower limits for each bin. The impedance analyzer will rank components using up to 10 categories. *Upper and lower limit settings are the same as for comparator measurement. Scope of reference value Display zoom function Monitor function Monitor voltage : 0.0 mV to 1000.0 mV Monitor current : 0.000 mA to 20.000 mA Display measured values using larger text for better visibility on production lines and in other field applications. Display the measurement signal level being applied to components in real time. Normal Segment Sweep parameters Frequency/signal level (power, voltage, current) Number of sweep points/segments Up to 801 points / Up to 20 segments (with a total of 801 points) Measurement condition settings Frequency, level, speed, average Measurement condition settings Frequency, level, speed, average Time interval 0 sec. to 1,000 sec. Number of sweep points/segments Up to 801 points / Up to 20 segments (with a total of 801 points) Sweep graph display (1-graph/4-graph display), XY graph display (1-graph/2-graph display), Multi-display (simultaneous display of sweep and XY), List display, Peak display The graph display can be switched based on the type of measurement being performed. (with a total of 7 layouts available) Upper and lower limit judgment: Set the upper and lower limits. Percentage judgment: Set the upper and lower limits as percentages of the reference value. Deviation percentage judgment: Set the upper and lower limits as percentages of the reference value. The impedance analyzer will display deviation of the measured value from the reference value (Δ%). Perform measurement after setting the sweep parameter (frequency or level), sweep range, number of sweep points, and measurement conditions. Set the sweep parameter, sweep range, number of sweep points, and measurement conditions on a segment-by- segment basis.
  • 8. 8 Intelligent measurement and analysis Continuous measurement function Measured value search function Convenient functionality for performing measurement, reviewing measurement results, and judging measured values. Functions available in analyzer mode Functions available in LCR mode Perform continuous measurement in the order of the measurement conditions saved with the panel save function. Measurements can combine LCR and Analyzer Mode measurement conditions. Continuous measurement can be performed using up to 46 measurement condition combinations, and can be implemented from EXT I/O. Save or load the measurement conditions, compensation values, and compensation conditions set in LCR mode or analyzer mode. Panel save and load function Number of panels that can be saved LCR Mode measurement conditions 30 Analyzer Mode measurement conditions 16 A: Panel numbers set for continuous measurement; B: Measured values; C: Parameter judgment results Selecting an Analyzer Mode panel displays the waveform. A B B C C The cursor can be moved automatically to a user- selected measured value point for one set of sweep measurement results. Move the cursor automatically according to user- configured settings once sweep measurement is complete. Auto search function Search options Maximum value Moves the cursor to the maximum value. Minimum value Moves the cursor to the minimum value. Target Moves the cursor to a user-set measured value. L-Max value Moves the cursor to the local maximum value (a filter can be set). L-Min value Moves the cursor to the local minimum value (a filter can be set). A: Cursor; B: Search result point; C: Measured values at result point A B C
  • 9. 9 Area and peak comparison functions Equivalent circuit analysis function Simulation function/residual error display Check whether measured values fall inside a previously configured judgment area. These functions are ideal for use in verifying non-defective products. Obtaining an overall judgment for each sweep For multiple-frequency simultaneous judgments Identifying resonance points Define a range by setting upper and lower limits and display the judgment results as IN or NG. Define a range by setting upper, lower, left, and right limits and display the judgment results as IN or NG. This function makes a judgment at a pre-set point during sweeping. (Up to 16 points) Area judgment Peak judgment Spot judgment Judgment area Judgment area IN judgment: Inside area IN judgment: Inside area NG judgment: Outside area NG judgment: Outside area A: Analysis results A Analyze individual component values (L/C/R) for elements in the following five circuits based on measurement results. R1 C1 L1 R1 C1 L1 R1 C1 L1 R1 C0 C1 L1 R1 C1 L1 Measured values Simulated values Z Frequency Difference Perform simulations based on the result of equivalent circuit analyses, compare that to actual measured values, and check the validity of the analysis result. Display the residual error to check the gap between the actual measurement and simulation numerically. Area judgment screen Spot judgment screen Peak judgment screen
  • 10. 10 Fully equipped with a range of built-in functions necessary for accurate and stable measurement. Compensation function Monitor the connection between the measurement terminals and the sample. This capability is ideal for carrying out contact checks of induc- tive components with low DC resistance values such as induc- tors, ferrite cores, and common-mode filters. Verify that components and terminals are in contact during measure- ment. The impedance analyzer will output an error if fluctuations in the RMS value exceed a user-configured range that has been set using the initially acquired RMS value waveform as the reference value. Judgments based on user-configured upper and lower contact resistance limits Guaranteed accuracy range 0.1 Ω to 100 Ω Measurement timing Before measurement, after measurement, or before and after measurement Output format Screen display / EXT I/O Output Activate this function in order to output a measurement terminal contact error if the impedance measured value is greater than a user-configured reference value. Valid setting range 1 Ω to 10000 Ω Output format Screen error display or EXT I/O error output Valid setting range 0.01% to 100.0% of the reference value Output format Screen error display or EXT I/O error output To truly measure accurately, all analyzers should first be set up to their optimal state. Electrical length compensation Open and short compensation Open, short, and load calibration The compensation process involves calibrating the measurement setup, from the impedance analyzer to the reference surface (ei- ther the test head terminals or the sample connection terminals). Connect the calibration kit (standard for open, short, and load), measure each piece of calibration data, and remove the cause of the margin of error. Enter the length of the electrical connection between the reference surface and the measurement sample connection surface to allow compensation of error caused by phase shift. If mounting a fixture on the test head, it is necessary to enter the fixture’s electrical length. Eliminate the causes of errors (such as fixtures or measurement cables) from the calibration standard surface to the sample con- nection terminal. Test head terminals (Calibration reference surface) Sample connection terminals (Calibration reference surface) Impedance analyzer Test head Cable(1 m (3.28 ft) or 2 m (6.56 ft)) Connector / cable / test fixture Measurement sample Functions for Efficient, Accurate Measurement Contact check Checking contact before and after measurement Judging the contact state based on measurement results Detecting chatter during measurement DCR measurement Hi-Z reject function Waveform judgment function Measured value > Upper limit: Displays “HI.” Upper limit ≥ Measured value ≥ Lower limit: Displays “IN.” Measured value < Lower limit: Displays “LO.” DCR measurement Contact check / Hi-Z reject function
  • 11. 11 Handler Interface Software Full Keyboard Large Screen for Better Viewing and Control Fast Measurement and Easy Screen Display 1 2 3 4 A C C Previous Previous Current TRIG Previous Current Current B D TRIG EOM EOM EOM Reset on Reset off Hold Pulse Delay INDEX Signal ERR ERR Perform intricate external control. Select whether to base input timing on the trigger’s rising edge or falling edge. B C A D Choose to enable or disable trigger input during measurement. By disabling input, you can prevent erroneous input caused by chatter. 2. Reset judgment result You can set the timing at which judgment results are reset. On: Reset the previous judgment results at the measurement complete signal’s rising edge. Off: Retain previous judgment until next judgment is output. When using trigger-synchronized output, you can ensure that the analog measurement signal is only output once the measurement signal has turned off. Screen size comparison for the IM3570 and IM7580 at the same ratio Trigger-synchronized output: The measurement signal is only applied to the sample during measurement. 1. Trigger input Timing and enable/disable settings Select whether to use pulse or hold output for the measurement complete signal. Pulse: You can set the duration for which the measurement complete signal is placed in the “on” state. Hold: The measurement complete signal switches from “on” to “off” at trigger input. You can set the duration of the delay from output of judgment results to output of the measurement complete signal. 3. Measurement complete signal Output method and output delay 4. Analog measurement signal Output delay The touch screen is equipped with a full keyboard function. Comfortably and reliably perform various input operations. Larger touch screen than legacy models for improved readability and comfort. The multicore CPU achieves both high-speed measurement and high-speed communication, as well as easy screen operation. It is equipped with a display mode that, even with the measurement screen displayed, achieves the same high-speed response as if the screen were off. IM7580s screen IM3570 screen
  • 12. 12 Expansive Interface Save measurement conditions and results in a USB flash drive Extensive range of interfaces for external control Use the IM7580’s LAN, USB, GP-IB, RS- 232C, and EXT I/O interfaces to control the instrument from an external device. *For more information, see page 15. Use the front USB terminal to save the measurement data, screen shots, or measurement conditions saved to the unit's internal memory to a USB drive. EXT I/O Connector D-sub 37-pin Female #4-40 inch thread Compatible connectors DC-37P-ULR (solder) DCSP-JB37PR (crimp) Japan Aviation Electronics Industry, Ltd. GP-IB RS-232C (optional) (optional) Connector 24-pin Standard IEEE 488.1 1987 Reference standard IEEE 488.2 1987 Terminator CR+LF, LF Connector D-sub 9-pin Flow control Software Transmission speed 9600 / 19200 / 38400 / 57600 bps LAN USB Connector RJ-45 connector Transmission method 10Base-T, 100Base-Tx, 1000Base-T Protocol TCP/IP Connector USB Type B Electrical specifications USB 2.0 (High Speed) *The GP-IB and RS-232C INTERFACE are optional 1. GP-IB 2. RS-232C 3. EXT I/O (Handler interface) 5. USB (for PC connectivity) 4. LAN GP-IB INTERFACE Z3000 RS-232C INTERFACE Z3001 268 mm (10.55 in) 348 mm (13.7 in) IM7581 Main unit front (Same as IM7580A) Main unit rear (Interface are the same for all five models) IM7587 Main unit front (Same as IM7583 / IM7585) Test head included with the IM7580A / IM7581 Test head included with the IM7583 / IM7585 / IM7587 IM7580A / IM7581 Main unit side IM7583 / IM7585 / IM7587 Main unit side 215 mm (8.46 in) 200 mm (7.87 in) 24 mm (0.94 in) 24 mm (0.94 in) 61 mm (2.40 in) 90 mm (3.54 in) 55 mm (2.17 in) 64 mm (2.52 in) *The GP-IB and RS-232C INTERFACE are optional (for PC connectivity)
  • 13. 13 Applications Common-mode filter measurement PASS/FAIL judgments of power inductors Panel save and continuous measurement Comparator function Carry out measurement smoothly, automatically switching compensation values and measurement conditions, such as when measuring a single part with two different measurement methods, or when using different compensation values/measurement conditions for each measurement point. By using the comparator function’s area and peak judgment functions, you can easily differentiate between defective and non-defective components. Compact design that fits two instruments into a full-size rack.Using two impedance analyzers simultaneously can dramatically reduce cycle times. Halve cycle times by using two instruments… Non-defective: IN Defective: NG Set the judgment area and then check whether component measurement results fall inside that area. This approach is well suited to differentiating between defective and non-defective components. As illustrated to the left, you can set a range around the peak value and use it to make judgments. If measuring a single part with two measurement methods. Continuous measurement Common mode Differential mode When compensation values and measurement conditions differ for each measurement point Progressive switching of compensation values and measurement conditions 1 → 2 → 3 → 4 1 2 3 4 Area judgment
  • 14. 14 SMD measurement procedure SMD TEST FIXTURE IM9201 CALIBRATION KIT IM9905 Exclusive Options All-in-One Fixture for 6 SMD Sizes - Definitive 3GHz High Frequency Analysis Made Easy. 2 Device Guides Let You Measure 6 Different SMD Sizes 1. Install the device guide and position the component 2. Release the stopper and anchor the pusher to secure the component Instrument / Options Device Guide for 0201 for 0402 to 1210 Stopper Pusher Device guide Release stopper Pusher holds down the component The following provisions are required when using the test fixture with the Hioki IM7580 series. SMD TEST FIXTURE IM9201 CALIBRATION KIT IM9905 TEST FIXTURE STAND IM9200 (includes magnifying glass) ADAPTER (3.5 mm to 7 mm) IM9906 Frequency range DC to 3 GHz Compatible package sizes (EIA) 0201, 0402, 0603, 0805, 1206, 1210 Electrode structure Bottom electrodes Maximum voltage ±42 Vpeak (AC+DC) Additional uncertainty Impedance : ±Ze [%] Phase : ±0.58 × Ze [ ° ] Ze = Ae + (Zse / Zx + Yoe × Zx) × 100 Zx : Measured impedance value [Ω] Ae : 4 × f2 [%] Zse : (100 + 500 × f) / 1000 [Ω] Yoe : (10 + 100 × f) / 1000000 [S] f [GHz] Specifications Product name Order code SMD TEST FIXTURE IM9201 IM9201 TEST FIXTURE STAND IM9200 IM9200 ADAPTER(3.5 mm to 7 mm) IM9906 IM9906 CALIBRATION KIT IM9905 IM9905 Product / Order code
  • 15. 15 Measurement parameters and measurement conditions Speed and accuracy Measurement modes LCR mode: Measurement using a single set of conditions Analyzer mode: Sweep measurement and equivalent circuit analysis Continuous measurement mode: Continuous measurement using previously saved conditions Measurement parameters Z Y θ X G B Q Impedance Admittance Phase angle Reactance Conductance Susceptance Q-factor Rs Rp Ls Lp Cs Cp D Equivalent series resistance (ESR) Equivalent parallel resistance Equivalent series inductance Equivalent parallel inductance Equivalent series capacitance Equivalent parallel capacitance Loss factor tan δ Display range Z Y θ X G B Q 0.00 m to 9.99999 GΩ 0.000 n to 9.99999 GS ±(0.000° to 180.000°) ±(0.00 m to 9.99999 GΩ) ±(0.000 n to 9.99999 GS) ±(0.000 n to 9.99999 GS) ±(0.00 to 9999.99) Rs Rp Ls Lp Cs Cp D Δ% ±(0.00 m to 9.99999 GΩ) ±(0.00 m to 9.99999 GΩ) ±(0.00000 n to 9.99999 GH) ±(0.00000 n to 9.99999 GH) ±(0.00000 p to 9.99999 GF) ±(0.00000 p to 9.99999 GF) ±(0.00000 to 9.99999) ±(0.000 to 999.999%) Measurable range 100 mΩ to 5 kΩ Output impedance Approx. 50 Ω Measurement frequency Range IM7580A 1 MHz to 300 MHz IM7581 100 kHz to 300 MHz IM7583 1 MHz to 600 MHz IM7585 1 MHz to 1.3 GHz IM7587 1 MHz to 3 GHz Resolution IM7580A 1.0000 MHz to 9.9999 MHz …… 100 Hz steps 10.000 MHz to 99.999 MHz …… 1 kHz steps 100.00 MHz to 300.00 MHz …… 10 kHz steps IM7581 100.00 kHz to 999.99 kHz ……… 10 Hz steps (1.0000 MHz to 300.00 MHz same as IM7580A) IM7583 / IM7585 / IM7587 ……… 100 kHz steps Accuracy ±0.01% of setting or less Measurement signal level Range IM7580A / IM7581 Power : -40.0 dBm to +7.0 dBm Voltage : 4 mV to 1001 mV rms Current : 0.09 mA to 20.02 mA rms IM7583 / IM7585 / IM7587 Power : -40.0 dBm to +1.0 dBm Voltage : 4 mV to 502 mV rms Current : 0.09 mA to 10.04 mA rms *User-configured power, voltage, and current Resolution 0.1 dB steps Accuracy ±2 dB(23 ℃±5 ℃), ±4 dB(0 ℃ to 40 ℃) Measurements Sweep measurement Up to 801 sweep points with user-configurable point delay Normal sweep: Measurement of up to 801 points Segment sweep: Up to 20 segments (with a total of 801 points) Time interval measurement Interval of 0.00000 sec. to max. 1,000.00 sec., 801 points Functionality Equivalent circuit analysis: 5 circuit models Cursor function: Automatically search for maximum and minimum values, target, local maximum and minimum values Comparator function: Area, peak and spot judgment Display List display graph display, XY graph display, judgment results display Scaling: Linear or logarithmic Measurements Bin measurement: 10 categories for 4 measurement parameters Comparator measurement: Hi, IN, and Lo judgments for 4 parameters Functionality Monitor function Monitor voltage range: 0.0 mV to 1000.0 mV Monitor current range: 0.000 mA to 20.000 mA Display Zoom display function: Enlarged display of measured values Trigger function User-selectable internal or external trigger (EXT I/O, interface, manual) Trigger delay: 0 sec. to 9 sec. Trigger-synchronized output: Stabilization wait time of 0 sec. to 9 sec. INDEX signal delay time of 0 sec. to 0.1 sec. Trigger types: Sequential, repeat, step*1 Compensation function Open/short/load calibration: From Main unit to test head Open/load compensation: Compensation of fixture component Electrical length compensation: 0 mm to 100 mm Correlation compensation: Compensation of display values based on user-input compensation coefficient Contact check DCR measurement, Hi-Z reject function, waveform judgment function Key lock function Lock operation of the instrument using the panel. Unlock by entering a passcode Beep tone Enable or disable for judgment results and key operation Warm-up function The instrument will display a message 60 minutes after it is powered on Selection of number of display digits 3, 4, 5, or 6 digits Display settings LCD display on/off Backlight brightness adjustment Measurement screen background color (white or black) Switchable parameter colors Display 8.4-inch color TFT with touch panel Number of measured values that can be stored in memory LCR Mode: 32000 Analyzer Mode: 100 sweeps Panel save and load functions Measurement conditions: 30 sets for LCR mode, 16 sets for Analyzer mode Compensation values only: 30 sets for LCR mode Interfaces HANDLER, USB, LAN, GP-IB (optional), RS-232C (optional) Command HIOKI unique SCPI Operatingtemperatureandhumidityrange 0°C to 40°C (32°F to 104°F), 20% RH to 80% RH, non-condensing Storagetemperatureandhumidityrange -10°C to 50°C (14°F to 122°F), 20% RH to 80% RH, non-condensing Operating environment Use indoors at an elevation of 2,000 m or less in an environment with a maximum pollution level of 2 Powersupplyandmaximumratedpower 100 V to 240 V AC (50/60 Hz), 70 VA Dielectric strength 1.62 kV AC for 1 min. between power line and ground line Standards compliance EMC: EN 61326, EN 61000 Safety: EN 61010 Dimensions and mass IM7580A / IM7581 Approx. 215 W×200 H×268 D mm (8.46 W×7.87 H ×10.55 D in), approx. 6.5 kg (229.3 oz) IM7583 / IM7585 / IM7587 Approx. 215 W×200 H×348 D mm (8.46 W×7.87 H ×13.7 D in), approx. 8.0 kg (282.3 oz) Accessories Power cord ×1, Instruction manual ×1, Impedance analyzer application disc ×1 Measurement speed (analog measurement) FAST MED SLOW SLOW2 0.5 ms 0.9 ms 2.1 ms 3.7 ms Averaging Valid setting range: 1 to 256 (in steps of 1) Basic accuracy IM7580A / IM7581…… Z : 0.72% rdg. θ : 0.41° IM7583 / IM7585 …… Z : 0.65% rdg. θ : 0.38° Guaranteed accuracy range 100 mΩ to 5 kΩ(impedance) Accuracy guaranteed 1 year, Post-adjustment accuracy guaranteed for 1 year Terminal design 2-terminal design LCR mode Recording and interface Display and sound Other Supplementary functionality Analyzer mode *1 Analyzer mode only Measurements Continuous measurement using up to 46 combinations of the following measurement conditions: 30 LCR mode measurement conditions and 16 analyzer mode measurement conditions Continuous measurement mode
  • 16. 16 Ea = 0.5 + Er (Frequency : 1MHz to 300MHz) Ea = 1.0 + Er (Frequency : 100kHz to 999.99kHz) P : Power setting [dBm] P : Power setting [dBm] P : Power setting [dBm] Measurement accuracy IM7580A / IM7581 Z : ± (Ea + Eb) [%] θ : ± 0.58 × (Ea + Eb) [ ° ] Conditions Guaranteed accuracy temperature and humidity range 0°C to 40°C (32°F to 104°F), 20% rh to 80% rh (non-condensing) However, must be within ±5°C of the temperature at the time of calibration. Guaranteed accuracy period 1 year (with open/short/load calibration enabled) Open/short/load calibration enabled period Within 24 hours after calibration Warm-up time At least 60 min. Measurement conditions Frequency, power, and speed points at which open, short, and load calibration have been performed Frequency Signal level Er α FAST MED SLOW SLOW2 100 kHz to 999.99 kHz -7 dBm to +7 dBm α 0.24 0.18 0.15 0.12 -40 dBm to -7.1 dBm 3 × 10 (-0.043P + α) -1.3 -1.4 -1.5 -1.6 1 MHz to 100 MHz -7 dBm to +7 dBm α 0.09 0.06 0.036 0.03 -40 dBm to -7.1 dBm 3 × 10 (-0.046P + α) -1.8 -2 -2.15 -2.3 100.01 MHz to 300 MHz -7 dBm to +7 dBm α 0.108 0.078 0.039 0.036 -40 dBm to -7.1 dBm 3 × 10 (-0.048P + α) -1.75 -1.9 -2.1 -2.25 Frequency Signal level Zsr α FAST MED SLOW SLOW2 100 kHz to 999.99 kHz -7 dBm to +7 dBm α 36 27 21 15 -40 dBm to -7.1 dBm 3 × 10 (-0.042P + α) 0.9 0.8 0.7 0.6 1 MHz to 300 MHz -7 dBm to +7 dBm α 13.5 9 5.1 3.9 -40 dBm to -7.1 dBm 3 × 10 (-0.048P + α) 0.36 0.2 0 -0.15 Frequency Signal level Yor α FAST MED SLOW SLOW2 100 kHz to 999.99 kHz -7 dBm to +7 dBm α 15 12 6.6 5.4 -40 dBm to -7.1 dBm 6 × 10 (-0.043P + α) 0.6 0.5 0.4 0.3 1 MHz to 300 MHz -7 dBm to +7 dBm α 7.5 5.7 3.3 2.4 -40 dBm to 7.1 dBm 3 × 10 (-0.046P + α) 0.1 0 -0.2 -0.4 Frequency Zsk 100 kHz to 999.99 kHz 50 1 MHz to 300 MHz 20 Frequency Yok 100 kHz to 199.99 kHz 120 200 kHz to 300 MHz 30 [Ω] ( F : measurement frequency [MHz] ) [S] ( F : measurement frequency [MHz] ) Zs = Yo = ( Zsk + Zsr + 0.5 × F ) 1000 ( Yok + Yor + 0.15 × F ) 1000000 [%] ( Zx : Z measured value in [Ω] ) Eb = Zs Zx Yo × 100 Zx + . ( )
  • 17. 17 Ea : IM7583 / IM7585 / IM7587 Frequency Signal level Ea FAST MED SLOW SLOW2 1 MHz to 100 MHz +1 dBm 0.581 0.557 0.532 0.524 -22.9 dBm to +0.9 dBm 1.005 0.815 0.71 0.63 -40 dBm to -23 dBm 3.622 2.501 1.7 1.43 100.1 MHz to 500 MHz +1 dBm 0.652 0.634 0.621 0.616 -22.9 dBm to +0.9 dBm 0.858 0.769 0.71 0.678 -40 dBm to -23 dBm 1.72 1.336 1.06 0.85 500.1 MHz to 1300 MHz +1 dBm 0.86 0.841 0.823 0.818 -22.9 dBm to +0.9 dBm 1.093 0.988 0.92 0.881 -40 dBm to -23 dBm 2.068 1.625 1.31 1.16 1300.1 MHz to 1800 MHz +1 dBm 2.066 2.037 2.025 2.02 -22.9 dBm to +0.9 dBm 2.381 2.228 2.128 2.113 -40 dBm to -23 dBm 5.773 4.156 3.423 3.133 1800.1 MHz to 3000 MHz +1 dBm 4.539 4.5 4.46 4.437 -22.9 dBm to +0.9 dBm 4.867 4.753 4.608 4.547 -40 dBm to -23 dBm 9.748 7.682 6.468 5.874 Frequency Signal level Zsr FAST MED SLOW SLOW2 1 MHz to 300 MHz +1 dBm 41.7 37.6 34.3 32.3 -22.9 dBm to +0.9 dBm 75.4 62.9 49.4 43.1 -40 dBm to -23 dBm 495.66 293.25 185.7 142.05 300.1 MHz to 1000.0 MHz +1 dBm 61.7 57.6 54.3 52.3 -22.9 dBm to +0.9 dBm 95.4 82.9 69.4 63.1 -40 dBm to -23 dBm 515.66 313.25 205.7 162.05 1000.1 MHz to 1300 MHz +1 dBm 111.7 107.6 104.3 102.3 -22.9 dBm to +0.9 dBm 145.4 132.9 119.4 113.1 -40 dBm to -23 dBm 565.66 363.25 255.7 212.05 1300.1 MHz to 1800 MHz +1 dBm 112.8 108.7 104.7 103.9 -22.9 dBm to +0.9 dBm 145.4 132.9 119.4 113.1 -40 dBm to -23 dBm 565.66 363.25 255.7 212.05 1800.1 MHz to 3000 MHz +1 dBm 212.8 208.7 204.7 203.9 -22.9 dBm to +0.9 dBm 245.4 232.9 219.4 213.1 -40 dBm to -23 dBm 665.66 463.25 355.7 312.05 Frequency Signal level Yor FAST MED SLOW SLOW2 1 MHz to 300 MHz +1 dBm 15.6 13.8 12.3 11.8 -22.9 dBm to +0.9 dBm 48 35.6 25.5 21.7 -40 dBm to -23 dBm 277.15 193.45 122.5 87.1 300.1 MHz to 1000.0 MHz +1 dBm 35.6 33.8 32.3 31.8 -22.9 dBm to +0.9 dBm 68 55.6 45.5 41.7 -40 dBm to -23 dBm 297.15 213.45 142.5 107.1 1000.1 MHz to 1300 MHz +1 dBm 45.6 43.8 42.3 41.8 -22.9 dBm to +0.9 dBm 78 65.6 55.5 51.7 -40 dBm to -23 dBm 307.15 223.45 152.5 117.1 1000.1 MHz to 1300 MHz +1 dBm 75.6 73.8 72.3 71.8 -22.9 dBm to +0.9 dBm 108 95.6 85.5 81.7 -40 dBm to -23 dBm 337.15 253.45 182.5 147.1 1000.1 MHz to 1300 MHz +1 dBm 143.2 140.2 135.9 134.6 -22.9 dBm to +0.9 dBm 168 155.6 145.5 141.7 -40 dBm to -23 dBm 397.15 313.45 242.5 207.1 Zs = ( Zsr + 0.5 × F ) 1000 Yo = ( Yor + 0.15 × F ) 1000000 [%] ( Zx : Z measured value in [Ω] ) Eb = Zs Zx Yo × 100 Zx + . ( ) [Ω] ( F : measurement frequency [MHz] ) [S] ( F : measurement frequency [MHz] )
  • 18. 18 Frequency [MHz] Frequency [MHz] 0.01 0.01 0.1 0.1 1 1 10 10 100 100 1000 1000 10000 10000 1 p 1 f 1 n 1 p 1 m 1 u 1 u 1 n 10 p 10 f 10 n 10 p 10 m 10 u 10 u 10 n 100 p 100 f 100 n 100 p 100 m 100 u 100 u 100 n L [ H ] C [ F ] Basic measurement confirmation table Range of measurements Range of measurements L Range of measurements C IM7580A / IM7581 IM7583 / IM7585 / IM7587 (For -7dBm to +7dBm, SLOW2.) (For +1dBm, SLOW2.) 0.8 % 0.8 % 1 % 1 % 2 % 2 % 5 % 5 % 10 % 10 % Measurement frequency [MHz] Measurement frequency [MHz] Z [Ω] Z [Ω] 0.1 1 1 10 100 1000 10 100 1000 1000 100 100 10 10 1 1 0.1 0.1
  • 19. 19 External control List of EXT I/O handler interface signals Timing chart *In this example, the TRIG signal’s active edge is the falling edge (ON). EOM: Off from trigger input to end of measurement processing INDEX: Off during probe chuck (probe cannot be removed from target) Pin I/O Signal 1 IN TRIG 2 IN Unused 3 IN Unused 4 IN LD1 5 IN LD3 6 IN LD5 7 IN Unused 8 - ISO_5V 9 - ISO_COM 10 OUT ERR 11 OUT PARA1-HI,BIN1,PARA1-NG 12 OUT PARA1-LO,BIN3,PARA2-NG 13 OUT PARA2-IN,BIN5,PARA3-NG 14 OUT AND,BIN7 15 OUT PARA3-IN,BIN9,PARA4-IN 16 OUT PARA4-HI 17 OUT PARA4-LO 18 OUT Unused 19 OUT OUT_OF_BINS,CIRCUIT_NG 20 IN Unused 21 IN Unused 22 IN LD0 23 IN LD2 24 IN LD4 25 IN LD6 26 IN LD_VALID 27 - ISO_COM 28 OUT EOM 29 OUT INDEX 30 OUT PARA1-IN,BIN2,PARA1-IN 31 OUT PARA2-HI,BIN4,PARA2-IN 32 OUT PARA2-LO,BIN6,PARA3-IN 33 OUT PARA3-HI,BIN8,PARA4-NG 34 OUT PARA3-LO,BIN10 35 OUT PARA4-IN 36 OUT Unused 37 OUT Unused Signal Function TRIG External trigger LD0 to LD6 Panel number selection EOM Measurement complete signal INDEX Analog measurement complete signal ERR Detection level error LD_VALID Panel load ISO_5V Isolated power supply 5 V input ISO_COM Isolated power supply common PARA1-HI to PARA4-HI Comparator judgment result: HI judgment PARA1-IN to PARA4-IN Comparator judgment result: IN judgment PARA1-LO to PARA4-LO Comparator judgment result: LO judgment OUT_OF_BINS Bin measurement result BIN1-BIN10 Bin judgment allocation: Bin 1 to Bin 10 CIRCUIT_NG Equivalent circuit analysis: Comparator judgment result PARA1-NG to PARA4-NG Peak judgment result PARA1-IN to PARA3-IN Peak judgment result AND Result of applying a logical AND operation to judgment results for measured values for four parameters (output when all judgment results are IN) Connector used D-sub 37-pin Female #4-40 inch thread Compatible connectors DC-37P-ULR (solder) DCSP-JB37PR (crimp) Japan Aviation Electronics Industry, Ltd. Judgment result Previous judgment result Chuck ON ON ON ON ON OFF OFF OFF Chuck Open Connection state TRIG (Measurement start signal) EOM (Measurement complete signal) INDEX (Analog measurement complete signal) ERR (Error signal) (Judgment result output) LD_VALID LD0 to LD6 Example of LCR Mode measurement timing Example of Analyzer Mode measurement timing Judgment result Previous judgment result Chuck ON ON ON ON ON OFF OFF OFF Chuck Open Connection state TRIG (Measurement start signal) EOM (Measurement complete signal) INDEX (Analog measurement complete signal) ERR (Error signal) (Judgment result output) LD_VALID LD0 to LD6 2 1 4 3 6 5 8 7 9 20 21 22 23 24 25 26 27 28 29 30 31 32 33 34 35 36 37 14 15 16 17 18 19 10 11 12 13 Electrical specifications Input signals Photocoupler-isolated, no-voltage contact input Input “on” voltage: 0 V to 0.9 V / input “off” voltage: open or 5 V to 24 V Output signals Isolated NPN open collector output Maximum load voltage: 30 V / maximum output current: 50 mA/channel Residual voltage: 1 V or less (10 mA) or 1.5 V or less (50 mA) Built-in isolated power supply Voltage: 4.5 V to 5 V / maximum output current: 100 mA Floating relative to protective ground potential and measurement circuit
  • 20. HEADQUARTERS 81 Koizumi, Ueda, Nagano 386-1192 Japan https://www.hioki.com/ All information correct as of Sept. 9, 2019. All specifications are subject to change without notice. series_IM7580E6-99M Printed in Japan DISTRIBUTED BY Note: Company names and Product names appearing in this catalog are trademarks or registered trademarks of various companies. Options Interfaces GP-IB INTERFACE Z3000 RS-232C INTERFACE Z3001 RS-232C CABLE 9637 Cable length : 1.8 m (5.91 ft) GP-IB CONNECTION CABLE 9151-02 Cable length : 2 m (6.56 ft) *Any interlink-compatible cross-cable can be used as the RS-232C CABLE. Instrument Product / Order code Composition : Main unit, Test Head, Connection cable Accessories : Power cord, Instruction manual, Impedance analyzer application disc Photo: IM7581 Photo: IM7587 Model (Measurement frequency) Connection cable length Order code IMPEDANCE ANALYZER IM7580A (1 MHz to 300 MHz) 1 m (3.28 ft) IM7580A -1 2 m (6.56 ft) IM7580A - 2 IMPEDANCE ANALYZER IM7581 (100 kHz to 300 MHz) 1 m (3.28 ft) IM7581 - 01 2 m (6.56 ft) IM7581 - 02 IMPEDANCE ANALYZER IM7583 (1 MHz to 600 MHz) 1 m (3.28 ft) IM7583 - 01 2 m (6.56 ft) IM7583 - 02 IMPEDANCE ANALYZER IM7585 (1 MHz to 1.3 GHz) 1 m (3.28 ft) IM7585 - 01 2 m (6.56 ft) IM7585 - 02 IMPEDANCE ANALYZER IM7587 (1 MHz to 3 GHz) 1 m (3.28 ft) IM7587- 01 2 m (6.56 ft) IM7587- 02 Test fixtures or probes are not included with the main unit. Dedicated test fixture required. (See page 14 in this catalog.) Accuracy calculation with included software Free software for automatically calculating measurement accuracy based on user-entered measurement conditions and measurement results can be downloaded from Hioki’s website.