TEAC Color Graphics digital indicator Td 9000 t
•
0 likes•41 views

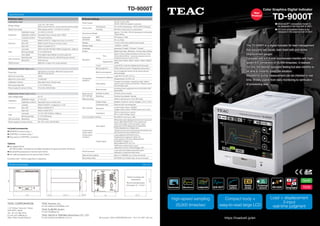
The TD-9000T is a digital indicator for load management that supports two inputs, load (load cell) and stroke (displacement gauge). High-speed A/D conversion of 25,000 times/sec and equipped with a 4.3-inch touchscreen monitor in DIN1/4 (92 x 92) size. While being high-end, it is a high-performance model that realizes a low price. Waveforms during measurement can be checked in real time. Widely usable from daily monitoring to verification of processing data.

Recommended
More Related Content
What's hot
What's hot (20)
Similar to TEAC Color Graphics digital indicator Td 9000 t
Similar to TEAC Color Graphics digital indicator Td 9000 t (20)
More from NIHON DENKEI SINGAPORE
More from NIHON DENKEI SINGAPORE (20)
Recently uploaded
Recently uploaded (20)
TEAC Color Graphics digital indicator Td 9000 t
- 1. Color Graphics Digital Indicator TD-9000T n Ethernet/IP™ compatible model to be released in the first half of 2021 n CC-Link compatible model to be released in the second half of 2021 New Product The TD-9000T is a digital indicator for load management that supports two inputs, load (load cell) and stroke (displacement gauge). Equipped with a 4.3-inch touchscreen monitor with high- speed A/D conversion of 25,000 times/sec. It realizes not only the desired operation feeling but also visibility to be able to instantly grasp the situation. Waveforms during measurement can be checked in real time. Widely usable from daily monitoring to verification of processing data. https://loadcell.jp/en High-speed sampling 25,000 times/sec Compact body + easy-to-read large LCD Load + displacement 2-input real-time judgment Included accessories l SENSOR connector plug 1 l CONTROL connector plug 1 l Plug case for CONTROL connector TD-9000T External drawings Specifications Units: mm Panel mounting hole dimensions Recommended panel thickness:1.6 –3.2mm n Sensor input Load sensor unput Bridge voltage 2.5V / 5V / 10V ±10% (30mA current maximum, can be used with remote sensing) Signal input range Strain gauge sensor –3.2mV/V to 3.2mV/V Calibration Calibration range 0.1mV/V to 3.2mV/V Calibration method Equivalent Input / Actual Load / TEDS Linearize function* Five-point tracking Precision Linearity Within 0.01%F.S. +1digit (when input is 3.2mV/V) Zero drift Within 0.5μV/ºC (Input conversion value) Gain drift Within ±0.005%F.S/ºC Filter Low pass OFF/3/10/30/100/300/1000Hz (Digital filter, –6dB/oct) Moving average 0 / 2 to 2048 times Auto digital Only digital value display (constant judgment) A/D conversion Sampling rate 5000 times per second, 25000 times per second Resolution 24-bit (binary) TEDS function IEEE1451.4 class 2 mix mode interface Displacement Sensor Input (pulse) Pulse type A/B phase or A phase, differential square wave (RS-422 conformance) Maximum input freq. 2MHz Maximum count value 15,000,000 Calibration method Equivalent Input / Actual Load Moving average filter 0 / 2 to 2048 times Power supply for sensor driving 5V (±10%), 500mA Max. Displacement Sensor Input (voltage) Input voltage range ±5.2V Calibration Calibration range 0.1 to 5.2V Calibration method Equivalent Input / Actual Load Precision Linearity Within 0.01%F.S. ±1digit (Input ≥3.3V) Zero drift Within 0.005%F.S/ºC Gain drift Within 0.02%F.S/ºC Filter Low pass 10 / 30 / 100 / 300Hz (–6dB/oct) Moving average 0 / 2 to 2048 times A/D conversion Resolution 24-bit (binary) Power supply for sensor driving DC 12V (±10%), 250mA Max. n Device settings Power supply 24V DC (±10%) 13W, AC100-240V (AC adapter is optional) Environment Temperature 0ºC to 40ºC (Operating) / –20ºC to 60ºC (Storage) Humidity 85% RH or less (without condensation) Dimensions/ Weight Approx. 114 x 96 x 140mm (protrusions not included) / About 960g Applicable standards EMC FCC (class A, TBA) Safety CE, UL (TBA) Display 4.3 inch LCD color resistive touch panel Display range –32000 to +32000 Language Japanese / English / Chinese* / Korean* Screen Digital load value, Waveform, Archive data, Setting Waveform X-axis Time 80ms*/170ms*/400ms/800ms/2.0s/4.0s/10.0s /30.0s/60.0s/90.0s *cannot be selected when the sampling frequency is set to 5 kHz. Displacement 2000 / 4000 / 6000 / 8000 / 10000 / 15000 / 20000 / 30000 Y-axis Load (STD) / Load and displacement (biaxially) Comparison waveform Band judgment Offset reference band / Designated value band Multi-zone judgment Up to 5 judgment zones can be set by device/ external signal Comparison judgment Load: HH / HI / OK / LO / LL Displacement: HI / OK / LO Hold setting Constant comparison, sampling, peak, bottom, peak to peak, maximum/minimum, inflection point and average value Beep function Sounding when judgments are not OK (ON / OFF Switchable) Measurement work settings Number of works 16 (Work can be copied) Switching External input signal / manual Data recording Built-in memory (up to 70) or SD cards D/A converter Output range Isolated, Current (4-20mA), Voltage (–10V to +10V) Conversion rate Same as A/D converting rate Resolution current output: about 1/43000, voltage output: about 1/59000 (when set to ±10V) Impedance 350Ω or less (Current output) / 2kΩ or more (Voltage output) Communication interface RS-232C (D-sub 9-pin), USB Control input/ output signal (Photocoupler Insulation) Input signal Differential pulse displacement sensor (A phase, B phase), Back light On/Off, Touch panel lock, reset, work select, hold zone select, clear, judgment On/Off, Measurement Start/End, Preset displacement, Digital zero *Signals are input when shorted/opened between any input terminal and the COM terminal. Output signal Load judgment (HH/HI/OK/LO/LL), Displacement judgment (HI/OK/LO), Load cell error, Unit error, Measurement Completed, Trigger (1, 2), Band judgment (HI, OK, LO) *NPN open collector (Sync type) *Maximum Current: 20mA/Voltage: 30V Check functions Load cell check (static strain/nterruption detection), contact terminal check Date and time setting Date (YYYY/MM/DD, etc.) / time can be set Recording media SD/ SDHC (2 to 32GB, Class 10 recommended) Options l AC adapter PA-91 (AC100 to 240V, compliant to the safety standards of Japan and North America) l Ethernet/IP (scheduled for the first half of 2021) l CC-LINK (scheduled for the second half of 2021) Functions with * will be supported in sequence. © Copyright TEAC CORPORATION 2021 2101 TCJ-PDF / ISD-133 TEAC CORPORATION 1-47 Ochiai, Tama-shi, Tokyo 206-8530, Japan Tel: +81-42-356-9154 E-mail: ipd-cs@teac.jp Web: https://loadcell.jp/en/ TEAC America, Inc., E-mail: datarecorder@teac.com TEAC EUROPE GmbH. E-mail: info@teac.eu TEAC SALES & TRADING (ShenZhen) CO., LTD. E-mail: teacservice3@teac.com.cn
- 2. Recommended Operating Environment CPU: 2nd generation Intel® Core™ i5, 3.0GHz or faster OS: Windows 10 Memory: 4GB or more 5-2 Linearization calibration function* 9-1 EXT. TERMINAL check Possible to check the control I/O signal status, which can be used for wiring checks and others. 9-2 Multilingual support Languages can be switched among Japanese, English, Chinese*, and Korean*. 9-3 Screen BMP function The contents displayed on the home screen can be saved and exported as a bitmap image. 9-4 Compliance of various regulations and standards CE, UL (TBA), FCC (TBA) 9-5 Support for date and time settings The date and time are recorded along with the measurement results. Color Graphics Digital Indicator TD-9000T Switchable display between “Graph ⇄ Numeric” modes Press-fitting machine PC PLC RS-232C CC-Link* EtherNet/IP* (options) SDHC card USB Calibration information High-speed processing 25000 times/sec Intelligent calibration functions Judgment result display function Load cell diagnostic functions Useful functions Compact + Large touchscreen Displacement input is a standard feature Data saving functions Output functions Realizing more reliable measurement without missing momentary changes. The data you care about can be checked on the spot with the judgment result. Communication options* A variety of fieldbuses are available as options to support various systems. l Ethernet/IP (scheduled for the first half of 2021) l CC-Link (scheduled for the second half of 2021) Power option AC adapter l PA-91 (AC100 to 240V, compliant to the safety standards of Japan and North America) Download site https://loadcell.jp/td-9000t/ Functions with * will be supported in sequence. Free download from the Web 6-1 Built-in memory saving (up to 70) Not only measurement values, but also waveforms and judgment results are saved in the main unit memory. The saved data can be used for judgment settings of other measurements. Dedicated offline data viewer TD-View TD-View is software that displays and statistically analyzes the data recorded on the SD/SDHC card on a personal computer. It shows its true ability in statistical process control. Displayable contents vary depending on hold mode and others. Not merely individual measurement data (Time-Load, Time-Displacement, Displacement-Load), but also trends and histograms of OK/NG judgment points for the entire list and statistically calculated values (Data, OK/NG Count, Average, Maximum, Minimum, Variance, S.D, Fluct., Cp) are displayed. A 4.3-inch wide touchscreen monitor is mounted on a general-purpose 92 x92mm panel mounting hole size. Supporting pulse input (A/B phase or A phase, differential square wave (RS-422 compliant)) and voltage input ±5.2V. Not just Time-Load but also Displacement-Load management is possible. 4-1 Analog output l Voltage output: 0 to ±10V l Current output: 4 to 20mA 4-2 Digital output l RS-232C l USB RS-232C and USB cannot be used at the same time. 5-1 TEDS function (Sensor Plug and Play) Realizing sensitivity automatic calibration by supporting TEDS. Contributing to reducing complicated procedures and management in calibration. 6-2 Equipped with SD card drive Measurement data, setting information, judgment results (OK/NG, judgment values) and others are saved in CSV format on the SD card, which can be verified with your spreadsheet software. * One (1) data size approx. 30KB-60KB * Data is processed and recorded for 2240 dots on the horizontal axis of the screen. The processing interval varies depending on the full-scale value on the horizontal axis. However, the judgment method value is not a processing target. * To ensure stable recording, use an SD/SDHC card with a capacity of 2GB or more. Please refer to the instruction manual for details. Compatible with IEEE1451.4 (V1.0), support for 4K-bit products, Class 2 mixed-mode interface 8-1 Static strain display The function can investigate defects such as load cell deterioration and plastic deformation. 8-2 Disconnection detection Also, the disconnection detection allows to check the location of the load cell disconnection. By linearly interpolating between any five points, an output with little error close to the output characteristics can be obtained. General linearity error Judgment by both load and displacement Linearization calibration reduces errors. 100% Calibration curve Error Reference straight line 0 0 Display example 4.3-inch touchscreen monitor 91mm 91mm Combination judgment Continuous judgment Multi-zone judgment Band judgment Simultaneous judgment by combining band and multi- zone judgments. Even complicated waveforms can be judged in detail. Values are held by judgment methods set in respective zones. The indicator value shows the value of "Peak 1". The hold value to be shown can be designated in settings. Continuous judgment is conducted when “CONTINUE” is the status displayed on the screen. Support for 4 contacts of high high limit, high limit, low limit, and low low limit. OK/NG judgment in real time for the load value for a certain value. OK/NG judgment in a maximum of 5 zones for one process. Judgment in combination with various holds (constant comparison, sampling, peak, bottom, peak to peak, average value, maximum/minimum and inflection point). OK/NG judgment by comparing a measurement value with a reference curve having high and low ranges. The increase or decrease of the load to changes in time and displacement is judged by a series of flows. Band setting with saved waveform and measurement waveform Up to five zone designations. Zone switching from external input is also possible. Bottom Inflection point Peak 1 1 2 3 4 5 Notification by beep sound in addition to the display 1 5 7 8 9 2 3 6 4 NG is shown in red Deviation points are shown in red Peak 2 Load cell Displacement sensor Waveform judgment in real time Features Options System configuration Software