C:\Fakepath\M Gadberry Arkansas Evaluationof Hay Waste
1. EVALUATION OF HAY WASTE BETWEEN
VARIOUS FEEDING METHODS
Gadberry, M.S.1, Rhoades,* S.R.2, Simon, K.J.3
1. Assistant Professor, University of Arkansas Division of Agriculture, Little Rock, Arkansas 72203
2. Extension Agent, University of Arkansas Division of Agriculture, Waldron, Arkansas 72958
3. Program Associate, University of Arkansas Division of Agriculture, Little Rock, Arkansas 72203
Abstract
The feeding of hay is a major expense to cow/calf production in Arkansas. Three
on-farm demonstrations were conducted over a 2 yr period to examine the effect of
feeding method on hay waste. At location 1, feeding hay unprotected (UNP) was
compared to processed hay (SHRED) fed in tire feeders. In yr 1, both UNP and
SHRED hay were fed within 3 herds. In yr 2, the 3 herds were grouped. At
location 2, feeding hay in a ring (RING) was compared to unrolling (UNR). Hay
Introduction was offered at approximately 29 lb dry matter per cow, daily. Bales were fed to
The costs associated with hay feeding on a cow/calf operation are significant prevent waste cross-contamination. Three bales for each feeding method were
to a producer’s bottom line. These costs are incurred from the actual examined for waste. Waste was determined by measuring the land area covered by
production of the hay, baling and handling, and losses associated with storage bale residue after feeding. After determining coverage, hay was removed from
and feeding. This project targets the losses (i.e., waste) from feeding hay by within a randomly tossed 2-ft square (avoiding areas of fecal contamination) to
various methods commonly employed by Arkansas cow/calf producers – estimate dry matter waste. In yr 1 at location 1, waste was analyzed as a
unprotected (UNP), fed in ring (RNG), unrolled (UNR) and processed (PRO). randomized complete block design. The herd block effect was not significant and
Additionally, an economic analysis is conducted to determine costs associated was removed from the model; afterwards, yr 1 was combined with yr 2 and
with three feeding systems on a 200 head cow/calf herd. analyzed for treatment, year, and treatment x year effects. Treatment was the only
significant source of variation in waste (P < 0.001). Waste for UNP and SHRED
was 49.17, 0.03, 34.98, 0.14 ± 8.3% f yr 1 and 2, respectively. At l
for d l location 2,
UNR areas tended to have more waste (P = 0.07) than RING, 23.7 versus 13.0 ±
Objective 3.1%, respectively.
The objective of this project was to compare the waste and economics of
feeding systems based on processed hay, ring fed hay, and unrolled hay.
50
Experimental Procedures
Figure 2. A random sample is being collected from an unprotected bale
Hay Loss Estimation. Hay loss was estimated from 2 cow-calf production
replication.
systems in Scott Co, Arkansas. In 2008 and 2009, a system that incorporated
processing large round bales in a vertical grinder-mixer (PRO) was compared
p g g g ( ) p
40
to unprotected (UNP) hay feeding (location 1). To estimate hay waste, bales
were weighed to determine an average fed bale weight. In the PRO system, 2 Results and Discussion
Waste (%)
bales were processed simultaneously and augered into large tire feeders. 30 Hay Loss Estimate. For location 1, feeding method was the only significant
After a 24 h feeding period, the remaining hay was removed from the tires, source of variation (P < 0.001). Waste for UNP and PRO was 42 and 0.09 ±
weighed and composited for DM determination. For the UNP system, hay 5.8%, respectively. In 2008, the hay loss for UNP was high. Initial thought
loss was determined by measuring the circumference waste area of a bale was cattle were adapted to eating processed hay from tire feeders. However,
offered over a 24 h feeding period. Within the area, a 2 ft square was 20 in 2009, cattle were given UNP for a longer period of time, yet wastes were
randomly thrown 3 times (Figure 2.) and the area within the square was still high and the full model, year by treatment interaction was insignificant (P
collected, weighed, and dried for DM determination and estimation of waste. > 0.20). At location 2, UNR areas tended to have more waste (P = 0.07) than
At experimental location 2, unrolling hay (UNR) was compared to feeding
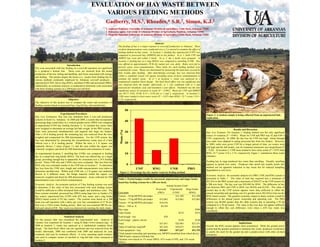
p , g y( ) p g 10 RNG, 23.7 versus 13.0 ± 3.1%, respectively. Figure 1. summarizes these waste
hay in a round bale ring feeder (RNG). The herd was offered hay as a single estimates.
group, providing enough hay to apparently be consumed over a 24 h feeding
period. Three UNR sites and 3 RNG sites were evaluated. Hay loss from the Feeding hay in rings produced less waste than unrolling. Visually, unrolling
RNG sites was estimated similar to the UNP sites at location 1. To determine 0 appears to permit less waste. Producers that unroll hay usually prefer this
hay loss from the UNR sites, length and width measurements were taken to method not for apparent reduction in hay waste but for reduced trampling
UNP RNG UNR PRO degradation to soil cover.
determine unrolled area. Within each UNR site, a 2 ft square was randomly Figure 1. Percentage hay dry matter waste by feeding method.
thrown in 4 different areas; the forage material within the square was
Economic Analysis. An economic analysis of a PRO, UNP, and RNG system is
removed, weighed and dried for DM determination. Areas collected for DM
Table 1. Partial budget results for processed, unprotected, and ringer feeder presented in Table 1. The value of total hay required was a minimum of
determination were void of fecal contamination.
based hay feeding systems for a 200 cow herd. $21,816 in the PRO system and a maximum of $30,672 in the UNP system for
Economic Analysis. An economic analysis of 3 hay feeding systems was used
y y y g y a 200 cow herd. The hay cost was $24,408 for RNG. The difference in hay
y , y
Annual S t C t c
A l System Costs
to determine if the value of hay loss associated with each feeding system cost between PRO and UNP or RNG was $8,856 and $2,592. The value of
would be sufficient to offset increased farm supply and machinery costs. The Processed Unprotected Ring Feeder wasted hay in the UNP system appears more than sufficient to offset the
three systems included: processed hay (PRO) using large tires as feeders (1% Cost itema (PRO) (UNP) (RNG) annual ownership and operating cost of a grinder-mixer ($4,344/yr) but not the
hay waste), unprotected hay (UNP) with 42% hay waste, and a ring feeder Tractor – 58 hp,MFWD,cab,loader $11,548 $11,548 RNG based system. The greatest economic impact to these systems would be
(RNG) based system (13% hay waste). The systems were based on a 200 Tractor – 75 hp,MFWD,cab,loader $15,063 $15,063 $15,063 differences in the annual tractor ownership and operating cost. The PRO
head cow-calf operation with a daily, per cow, hay consumption of 27 lb (as- Tractor – 95 hp,MFWD,cab,loader $18,416 system was $6,868 greater than the other systems due to operating a 95 hp
fed) over a 120-d winter feeding period. Bale size was assumed 900 lbs (as- Mixer – 540 cu. ft. $4,344 compared to a 58 hp tractor. The value in hay loss does not appear sufficient
fed) and valued at $30. Hay waste was factored into meeting the daily intake. enough to offset this cost difference, even when a 42% hay waste was
Hay rings $386
considered.
Cake Feeder $214 $214
Statistical A l i
St ti ti l Analysis Feed trough - ti
F dt h tire $28
For this project, bale was considered the experimental unit. Analysis of Feed trough – plastic culvert $140 $140
variance was examined for location 1 using R (http://www.r-project.org). In Total $37,851 $26,965 $27,351 Implications
2008 at location 1, waste was analyzed as a randomized complete block Overall, the RNG system appears most economical. While the grinder-mixer
Value of total hay requiredb $21,816 $30,672 $24,408
design. The herd block effect was not significant and was removed from the system had the greatest potential to minimize hay waste, producers would have
model; afterwards, 2008 was combined with 2009 and analyzed for year, Total equipment + hay $59,667 $57,637 $51,759
aTotal annual ownership and operating cost, MFWD (modified front wheel drive).
to justify the need for the greater hp and a grinder-mixer with other on-farm
treatment, and year by treatment effects. A t-test, assuming equal variance, enterprises.
b900 lb bales valued at $30/bale fed.
was used to compare means of unrolled or ring-fed bale waste measured at
cSystems were based on 1% waste (PRO), 42% waste (UNP), and 13% waste
location 2.
(RNG).