1. Monitoring Utilization of Pasture and Rangeland Forage to Assist
Grazing Management Decisions: A Central Texas County Case Study
Scasta, J.D. (County Extension Agent, Agriculture and Natural Resources, Texas AgriLife Extension Service, Texas A&M University, Corsicana, TX)
ABSTRACT 2009 GRAZING MANAGEMENT AND FORAGE DEMAND
The goal of this project was to implement a user friendly forage utilization monitoring program on a central Texas ranch to serve as a
county demonstration model. This project will seek to assist landowners with improper forage utilization which is a critical issue affecting 2 herd, 2 pasture continuous grazing system Table 1: Comparison of Average Percent Utilization Figures
profits, cattle performance and natural resources. The program required two days annually and minimal labor. Short and long term grazing
exclosures were established in two pastures. Measurements of plant height and biomass were taken in the fall, inside and outside of South Pasture Herd: 34 cows and 2 bulls - 365 days. Average weight of the cows is South Pasture North Pasture
exclosures. Percent utilization figures were calculated. Vegetation transect surveys and photo points were established for long term
monitoring. The ranch utilized a two herd, two pasture grazing system. 34 Hereford crossbred cows and 2 bulls (1 Hereford, 1 Black
1,000 lbs and 1,600 lbs for bulls. Measuring Forage Heightw 75.5% 44.2%
Angus) grazed the South Pasture and 24 replacement crossbred heifers grazed the North Pasture. Forage utilization in the South Pasture was North Pasture Herd: 24 replacement heifers - 365 days. Average weight is 600 lbs. Clipping Forage Plotsx *92.0% 42.9%
high (average 80.9%) and evenly distributed (standard deviation 11.4%) while utilization in the North Pasture was low to moderate (average
42.5%) and unevenly distributed (standard deviation 26.4%). Subsequently, mature cows were identified for culling in the South Pasture
herd and alternate supplemental feeding locations used in the North Pasture. This county level, agricultural demonstration will be used to
1 AU = Animal Unit = 1,000 lbs cow w/ calf at side Calculating Forage Demandy 75.2% 40.5%
instruct other ranch managers on how to apply a forage utilization monitoring program. This will assist them in making critical grazing
management decisions based on ranch specific data acquired with minimal time and labor.
AUE = Animal Unit Equivalent conversion factor Percent Utilization Averagez 80.9% 42.5%
Daily Forage Requirement for 1 AU = 26 lbs of air dry forage *Variation attributed to difficulty in clipping extremely overgrazed forage plots
OBJECTIVES HUE = Harvest Use Efficiency (25%) loss from trampling, insects, desiccation wCalculating Percent Utilization using Residual Plant Height measurements inside & outside grazing exclosures
1. Quantify forage production to assist in forage budgeting and setting xCalculating Percent Utilization using clipping, drying and weighing of forage plots inside & outside grazing exclosures
appropriate stocking rates. SOUTH PASTURE HERD yCalculating Percent Utilization based on forage production figures from forage clipping & animal demand
34 cows w/ calves and 2 bulls grazing for 365 days
2. Evaluate short term (annual) forage utilization to assist in yearly zAverage Percent Utilization calculated from three methods applied
37.2 Animal Units x 26 lbs forage/cow/day x 365 days = 353,028 lbs forage to feed
management decisions.
herd for 1 year
3. Evaluate long term impacts of grazing management on plant communities 180 acres @ 3,906.7 lbs average dry forage/acre annually = 703,206 lbs forage
and identify range trends. Supply = 703,206 lbs forage annually CONCLUSION
4. Assist ranchers in making confident g
g grazing management decisions based on
g g Forage utilization in the South Pasture was high (average 80.9%) and evenly
timely, ranch specific data with minimal labor. Demand distributed (standard deviation 11.4%) while utilization in the North Pasture
Herd Demand = 353,028 lbs forage annually was low to moderate (average 42.5%) and unevenly distributed (standard
MATERIALS AND METHODS Harvest Use Efficiency (25%) = 175,801.5 lbs forage annually deviation 26.4%) (Table 1, Figure 1). The vegetation inventory quantified the
Total Demand = 528,829.5 lbs forage annually vegetational composition of each pasture. The South Pasture is 69% grass,
This project was established on a Navarro County ranch in early 2009. The
28% forbs and 3% brush while the North Pasture is 64% grass, 23% forbs and
North Pasture (185 acres) had 24 yearling commercial crossbred beef heifers
Potential Utilization = (Demand/Supply) = (528,829.5 / 703,206) * 100 = 75.2% 13% brush. Based on this information, the following management decisions
grazing year round. It is primarily rangeland with mesquite (Prosopis
and considerations have been made:
glandulosa) and eastern red cedar (Juniperus virginiana) brush and a high
diversity of grasses and forbs (13 and 5 species identified respectively). The NORTH PASTURE HERD
24 replacement heifers grazing for 365 days 1. The South Pasture herd was reduced to 21 cows and 1 bull (to reduce
South Pasture (180 acres) had 34 Hereford crossbred cows and 2 bulls. This
14.4
14 4 Animal Units x 26 lbs forage/co /da x 365 da s = 136 656 lbs forage to feed
forage/cow/day days 136,656 demand on forage) for a new stocking rate of 8 0 ac/AU (4 8 ac/AU prior)
8.0 (4.8 prior).
pasture consists of both improved pasture and rangeland dominated by
herd for 1 year 2. In the North Pasture, a bull was put in with the now 800 lbs heifers (8
bermudagrass (Cynodon dactylon) and annual threeawn (Aristida purpurea)
185 acres @ 4,753.77 lbs average dry forage/acre annually = 879,434.5 lbs forage heifers were sold, leaving 16 heifers) for maintain a stocking rate of 12.7
with brush and forbs encroaching. Soil is an acidic sandy loam.
Supply = 879,434.5 lbs forage annually ac/AU. Alternative feeding locations were also used to improve grazing
distribution in the North Pasture.
Demand 3. Brush management, water developments and cross fencing are being
Herd Demand = 136,656 lbs forage annually considered to further enhance forage production and grazing distribution.
Figure 1: Aerial Maps Harvest Use Efficiency (25%) = 219,858.6 lbs forage annually 4. Monitoring will be continued annually to identify range trends and forage
and Exclosure Locations Total Demand = 356,514.6 lbs forage annually production to ensure the sustainability of the ranching operation.
Potential Utilization = (Demand/Supply) = (356,514.6 / 879,434.5) * 100 = 40.5% Future inventories will allow for a comparison to assess if vegetational
F t i t i ill ll f i t t ti l
composition is changing over time as a function of grazing management.
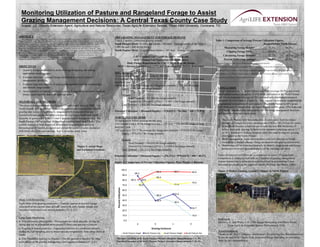
Figure 2: Comparison of Percent Utilization Figures: Plant Height vs Biomass Annual monitoring in subsequent years is critical in determining if past
decisions are producing the expected results (McGinty and White, 1998).
100.0 Figure 3: Heifers Grazing Around Exclosure in North Pasture
96.5 96.7 95.8
88.2
90.0
85.4
80.0 80.3 80.6
75.0
70.0
70 0 70.0
70 0 71.4
Percent Utilization
60.0
50.0 52.4
50.0
Short-Term Monitoring 40.0 39.5
36.4
Eight Short-term grazing exclosures – Four per pasture to monitor forage
30.0
utilization of the current years growth, measured, and clipped (inside and
24.7
outside of exclosures) and moved annually (32” x 32”) 20.0
10.0 10.0
Long-Term Monitoring
References
Two permanent photo points - Photographs are taken annually during the 0.0
McGinty, A., and White, L.D. 1998. Range Monitoring with Photo Points.
spring and fall at permanent photo points (T-Post) and grazing exclosures a b c d
Texas AgriLife Extension Service Publication L-5216.
Vegetation transect surveys - Vegetation transects are conducted annually Grazing Exclosure
during the Fall sampling date to assess species composition; from photo point to Acknowledgments
North Pasture Height North Pasture Clip South Pasture Height South Pasture Clip
North Thanks to Mr. Paul Currington, ranch owner, for allowing this demonstration to
be put out and to Dr. Charlie Hart, Extension Range Specialist, for providing
Two Permanent grazing exclosures – One per pasture to monitor the long- 1Standard Deviation of All South Pasture Percent Utilization Measurements = 11.4%
2Standard Deviation of All North Pasture Percent Utilization Measurements = 26.4% input for this demonstration.
term effects of the grazing management and vegetation changes (4’ x 4’)