
Recommended
Recommended
More Related Content
Similar to FCF012345SensitivityMarket Size000000Market Share000000.docx
Similar to FCF012345SensitivityMarket Size000000Market Share000000.docx (15)
More from mydrynan
More from mydrynan (20)
Recently uploaded
Recently uploaded (20)
FCF012345SensitivityMarket Size000000Market Share000000.docx
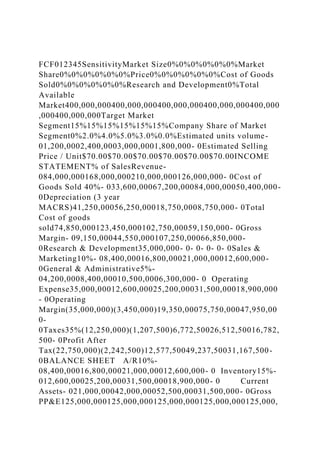
- 1. FCF012345SensitivityMarket Size0%0%0%0%0%0%Market Share0%0%0%0%0%0%Price0%0%0%0%0%0%Cost of Goods Sold0%0%0%0%0%0%Research and Development0%Total Available Market400,000,000400,000,000400,000,000400,000,000400,000 ,000400,000,000Target Market Segment15%15%15%15%15%15%Company Share of Market Segment0%2.0%4.0%5.0%3.0%0.0%Estimated units volume- 01,200,0002,400,0003,000,0001,800,000- 0Estimated Selling Price / Unit$70.00$70.00$70.00$70.00$70.00$70.00INCOME STATEMENT% of SalesRevenue- 084,000,000168,000,000210,000,000126,000,000- 0Cost of Goods Sold 40%- 033,600,00067,200,00084,000,00050,400,000- 0Depreciation (3 year MACRS)41,250,00056,250,00018,750,0008,750,000- 0Total Cost of goods sold74,850,000123,450,000102,750,00059,150,000- 0Gross Margin- 09,150,00044,550,000107,250,00066,850,000- 0Research & Development35,000,000- 0- 0- 0- 0- 0Sales & Marketing10%- 08,400,00016,800,00021,000,00012,600,000- 0General & Administrative5%- 04,200,0008,400,00010,500,0006,300,000- 0 Operating Expense35,000,00012,600,00025,200,00031,500,00018,900,000 - 0Operating Margin(35,000,000)(3,450,000)19,350,00075,750,00047,950,00 0- 0Taxes35%(12,250,000)(1,207,500)6,772,50026,512,50016,782, 500- 0Profit After Tax(22,750,000)(2,242,500)12,577,50049,237,50031,167,500- 0BALANCE SHEET A/R10%- 08,400,00016,800,00021,000,00012,600,000- 0 Inventory15%- 012,600,00025,200,00031,500,00018,900,000- 0 Current Assets- 021,000,00042,000,00052,500,00031,500,000- 0Gross PP&E125,000,000125,000,000125,000,000125,000,000125,000,
- 2. 000125,000,000MACRS 3 year schedule33.0%45.00%15.00%7.00%Annual Depreciation41,250,00056,250,00018,750,0008,750,000- 0Accumulated Deprecaition41,250,00097,500,000116,250,000125,000,000125, 000,000 Net PP&E125,000,00083,750,00027,500,0008,750,000- 0- 0Total Assets125,000,000104,750,00069,500,00061,250,00031,500,000 - 0A/P8%- 06,720,00013,440,00016,800,00010,080,000- 0 Current Liabilities- 06,720,00013,440,00016,800,00010,080,000- 0Retained Earnings(22,750,000)(24,992,500)(12,415,000)36,822,50067,99 0,00067,990,000Memo: Net Working Capital Required- 014,280,00028,560,00035,700,00021,420,000- 0FREE CASH FLOW (FCF)OCF (EBIT less taxes plus non cash items)(22,750,000)39,007,50068,827,50067,987,50039,917,500- 0Investment in NWC (change in NWC from prior period)- 014,280,00014,280,0007,140,000(14,280,000)(21,420,000)PPE Expenditures (change in LT Assets from prior period)125,000,000- 0- 0- 0- 0(6,500,000)Free Cash Flow (FCF)(147,750,000)24,727,50054,547,50060,847,50054,197,500 27,920,000DECISION CRITERIAPayback3.14(123,022,500)(68,475,000)(7,627,500)46 ,570,00074,490,000NPV19,879,496IRR15.0%MRR12.8%Profita bility Index1.13(147,750,000)22,479,54545,080,57945,715,62737,017 ,62217,336,123WACC10% Salvage ValueEquipment Purchase Price125,000,00010 year straight line depreciationSalvage Value at year 510,000,000Tax Rate35%0123456Equipment Cost125,000,0003 year MACRS Depreciation33.0%45.00%15.00%7.00%0%0%Depreciation Expense41,250,00056,250,00018,750,0008,750,000- 0- 0Book Value125,000,00083,750,00027,500,0008,750,000- 0- 0- 0Sell Equipment at end of Year 5Selling Price10,000,000Book Value- 0Gain on sale10,000,000Less taxes on Gain3,500,000Net Cash6,500,000
- 3. FIN 319 – Case #2 Capital Budgeting – New Product Decision Precision Castparts Precision Castparts Corporation has long been a leader in supplying complex metal components and parts to the aerospace and other markets. However the aerospace market has matured with growth slowing and some analysts even forecasting a flat or declining market. One growth area in the aerospace market is occurring in drones, namely unmanned aircraft used in a wide range of applications to include: defense, agriculture, firefighting, general commercial and personal / recreational uses. Precision Castparts currently does not have any significant market share in the drone market. Precision Castparts is considering launching a new set of products to be sold into the drone market. The drone market was relatively nonexistent ten years ago, but has grown quite rapidly and is expected to do so into the future. Precision Castparts has already invested $15 million in research, $5M in test marketing
- 4. and believes their products will be competitive with product offerings from other companies. You have been approached by the president of the company to analyze the proposed project and make a recommendation on whether Precision Castparts should launch the initial line drone products for the commercial and defense sectors (Precision Castparts does not plan to introduce produces for drones used in the personal / recreational sector). In the current year 20,000 drones are expected to be sold worldwide and estimated to grow at rapid rate of 45% per year. Of that total, 75% of the sales are currently classified as being used in commercial and defense and the mix of commercial and defense is expected to decrease by 2.5 percentage points each year in the future. Being a relatively new entrant to the market, Precision Castparts expects to initially get a 5% share of the commercial and defense drone market and that market share will grow by one percentage point per year. Once ready for sale, Precision Castparts’s first product line is expected to be sold for 5 years, in the 6 th
- 5. year Precision Castparts plans to transition to a second generation of drone products. In that 6 th year half of the sales are expected to be comprised of the initial product line and the other half comprised of the second generation. The set of products that Precision Castparts is planning for the drone market could currently have a combined average selling price of $40,000 / drone unit based on competitive offerings and the price is forecast to decrease by 4% per year. The company is fairly confident in most of its projections, but market share and price are the two items with the most variability. The variable cost of goods sold is forecast to be $19,000 /drone unit at time of product launch and is forecast to decrease by 5% / year as the company gains experience with the manufacturing process. Selling and administrative expenses are expected to be 8% of sales each year. Prior to launching the new product line, Precision Castparts will need to spend an additional $75 million on R&D over the next two years to complete the design ($50M
- 6. in the current year and $25M next year), $10 million on test marketing and $100M on capital equipment to support the manufacturing process. The equipment purchase and test marketing will be done one year prior to the start of sales. The equipment will be depreciated using the seven year MACRS schedule. The equipment will have a $15 million salvage value after all sales of the initial product line have been completed and might be able to be used in a future company project. Also, the company will need to invest $20 million in net working capital prior to the first year of sales. Once sales begin the company will plan to maintain 55 days of accounts receivable, 180 days of inventory and 60 days of accounts payable. The corporate tax rate is 32%. To establish a discount rate, please use the Industry Approach (Pure Play) to estimate the cost of equity. Please use The Boeing Company (BA) as the comparable company as the majority of its business is in the commercial and defense segments of aerospace. In your recommendation please include the payback period, NPV, IRR, MIRR and profitability index. Also
- 7. include an analysis to assess potential risk. I am interested in the structured frameworks you use to solve the problem/s, assumptions made, analysis, recommendation and ability to clear communicate. Grading will consider: • Critical Thinking: Have you formulated meaningful questions (what are the critical issues or problem), synthesized information and financial data, considered alternatives or improvements, proposed position / solutions. • Analysis: Have you chosen the appropriate analytical framework/s to utilize and appropriately applied them. Assess quality of supporting evidence, key assumptions are identified and a clear recommendation supported by the analysis. • Communication: The paper must be written clearly with a central message and logical organization. Ideas and recommendations are well supported. The case should contain an executive summary, framing of the problem, analysis, consideration of alternative solutions and recommendation. Please ensure correct spelling, grammar and clear formatting of financial exhibits. Use of tables and charts are often an efficient means
- 8. to communicate financial information. Papers should be between 3-5 pages in length plus any exhibits in an appendix. Absent Satisfactory Excellent WACC 0 1 2 3 4 Comment Overall framework and WACC Cost of Equity (industry approach) FCF Forecast Overall framework Proforma Income Statement Proforma Balance Sheet FCF Forecast Decision Criteria Decision Frmework NPV, IRR, MIRR, PI Risk Assessment
- 9. Communication Overall Presentation Executive Summary Supporting evidence Synthesis & Recommendation Grammar, spelling Use of Exhibits, Charts Agenda Comprehending risk when modeling investment (project) decisions Standalone Risk Market Risk 1 1 Project Risk Standalone Risk: Risk based on uncertainty of a projects cash flows
- 10. Sensitivity Scenarios Breakeven Simulations Market Risk: Risk of the project as seen by a well diversified investor Beta 2 Sensitivity, Scenario, and Break-Even Each allows us to look behind the NPV number to see how stable our estimates are. Breakeven: sales required to breakeven Accounting break-even: sales volume at which net income = 0 Cash break-even: sales volume at which operating cash flow = 0 Financial break-even: sales volume at which net present value = 0 Sensitivity: how sensitive a particular NPV calculation is to changes in an input variable holding all other assumptions are held constant Scenario: examine impact on NPV given a confluence of factors When working with spreadsheets, try to build your model so that you can adjust variables in a single cell and have the NPV calculations update accordingly. 3 3
- 11. Monte Carlo Simulation A more sophisticated variation of the scenario analysis is Monte Carlo simulation. In a Monte Carlo simulation, analysts specify a range or a distribution of potential outcomes for each of the model’s assumptions. Pick a probability distribution for each input variable (units, price, variable costs, etc). The computer program will pick a random value from each input variable, calculate the NPV and store the result. This is a trial. Repeat the process many times, saving the input variables and the output (NPV). End result: Probability distribution of NPV based on sample of simulated values. 4 Example 5 6 When a firm with both debt and equity invests in an asset similar to its existing assets (business), the WACC is the appropriate discount rate to use in NPV calculations. In conglomerates, the WACC reflects the return that the firm must earn on average across all its assets to satisfy investors, but using the WACC to discount cash flows of a particular investment leads to mistakes. Any project’s cost of capital depends on the use to which the
- 12. capital is being put—not the source. Therefore, it depends on the risk of the project and not the risk of the company. When a firm invests in an asset that is different from its existing assets, it should look for pure-play firms to find the right discount rate. 6 Finding the Right Discount Rate 6 You are a financial analyst at General Electric and are preparing a cost of equity estimate for a project analysis using NPV: CAPM = Risk Free Rate + Beta * Market Risk Premium 9.5% = 3.0% + 1.1 * 5.9% Lines of Business Financial Services Power Generation Aviation Transportation Health Care Consumer Goods When evaluating a new power generation investment for GE, which cost of capital should be used? Capital Budgeting & Project Risk 7 Beta 1.8 0.6
- 13. 1.2 1.3 0.8 1.1 7 17 Capital Budgeting & Project Risk Project IRR Project’s risk (b) 9.5% 1.1 1.8 0.6 R = 3% + 0.6×(5.9% ) = 6.5% 6.5% reflects the opportunity cost of capital on an investment in power generation, given the unique risk of the project.
- 14. 6.5% 13.6% Investments in Financial Services have higher risk and should have higher discount rates Security Market Line (SML) 8 8 Using an Industry Beta Pure Play Approach It can be argued that a better estimate of a firm’s beta or project beta can be developed by analyzing companies in the industry. If you believe that the operations of the firm are similar to the operations of the rest of the industry you can use an industry beta. If you believe that the operations of the firm are fundamentally different from the operations of the rest of the industry, you should use the firm’s beta. The Industry approach can also be used if The company being analyzed is not public as Beta can not be directly observed. Attempting to estimate a Beta for a division or project Steps to use an industry beta: Indentify Comparable Firms and their beta
- 15. Calculate the unlevered (asset beta) for each comparable firm (pure plays) Beta is influenced by nature of industry, operating leverage, financial leverage (debt) Calculate an average asset beta based for the firms Lever the beta (equity beta) based on the capital structure of the firm of interest. Controls for capital structure (amount of debt), which impacts beta 9 Levered Beta = Unlevered Beta * [ 1 + ( 1- tax rate) * (Debt / Equity Ratio)] Or if your firm is private 9 Industry Beta Example You want to estimate cost of equity for an energy project. You have identified a comparable company in the energy industry (Energy Inc) Beta (levered) 0.43 Debt / Equity Ratio 0.75 Tax Rate 35% Energy Inc’s unlevered (asset) beta = 0.29 0.29 = 0.43 / [1 + (1 - .35) * (0.75)] Unlevered Beta = Levered Beta / [ 1 + ( 1- tax rate) * (Debt / Equity Ratio)] General Electric has chosen to have more debt in their capital structure.
- 16. GE Debt / Equity Ratio 1.4 GE Tax Rate 25% An estimate of GE’s beta for it’s energy business is 0.6 0.6 = 0.29 * [ 1 + (1 - .25) * (1.4)] Levered Beta = Unlevered Beta * [ 1 + ( 1- tax rate) * (Debt / Equity Ratio)] The Beta of 0.6 would be appropriate to use for calculating the cost of capital of a project in GE’s energy business unit. 10 Look at some online betas, are they asset or equity betas? 10 Assignments for Next Week Monday, November 3rd Case #2 Due and in class review Mid term Exam overview. Wednesday, November 5th Mid Term Exam 11 12 Firms establish a “base-case” set of assumptions for a particular project and calculate the NPV based on those assumptions.
- 17. Managers allow one variable to change while holding all others fixed, and they recalculate the NPV based on that change. Repeating this process for all the uncertain variables in an NPV calculation: Allows managers to see how sensitive the NPV is to changes in baseline assumptions. Understand which variables have the most impact on the NPV Issues: Ignores relationships among variables 12 Sensitivity Analysis 12 13 Scenario Analysis A more complex variation on sensitivity analysis Rather than adjust one assumption up or down, analysts conduct scenario analysis by calculating the project NPV when a whole set of assumptions changes in a particular way. Assign probabilities to the to scenarios For Example: Best, Worse, Base Case Scenarios Better understanding of project risk Issues: Only considers a few possible out-comes. Assumes that inputs are perfectly correlated—all “bad” values occur together and all “good” values occur together. 13
- 18. 13 Capital Budgeting & Project Risk A firm that uses one discount rate for all projects may over time increase the risk of the firm while decreasing its value. Project IRR Firm’s risk (beta) rf bFIRM Incorrectly rejected positive NPV projects Incorrectly accepted negative NPV projects Hurdle rate
- 19. The SML can tell us why: 14 14 To estimate the cost of capital for a division, a “pure play” approach could be used, although finding exactly similar firms may be difficult, particularly considering underlying financial and operational structure. 0% 2% 4% 6% 8% 10% 12% 14% 16% 18% ($475,145)($339,389)($203,634)($67,878)$67,878$203,634$339 ,389$475,145 NPV Probability of NPV SML )( F M FIRMF Agenda Capital Budgeting Decision Frameworks
- 20. 1 1 Capital Budgeting Process Goal of management is to maximize value Companies continually invests in a portfolio of projects In theory all projects that create value should be approved In reality, a company may not invest in all projects estimated to create value Capital budgeting is the process to assess: if an investment will create value for the investors Expected project return > cost of capital If constrained, how to prioritize across investments. Capital constraints Non-Capital constraints Estimation Bias 2 2 Describe process to create a budget ZBB process What would you like to see in approving a project
- 21. Capital Budgeting 3 New Product Upgrade the Factory Marketing Program Open new Sales office Leadership Training ‘Big Data’ Software New Feature for existing product Compliance with new Federal regulation Capital Budgeting Process Approved Projects 3 4 The Capital Budgeting Decision Process The capital budgeting process involves a few basic steps: Identifying potential investments Ensure potential investments are linked to strategic direction Types of Projects: Safety, Replacement, Contraction, Expansion (products or markets), Mergers Reviewing, analyzing, and selecting from the proposals that have been generated Strategic Alignment Does the project create value? Implementing and monitoring the proposals that have been selected © 2010 Cengage Learning. All Rights Reserved. May not be scanned, copied or duplicated, or posted to a publicly accessible
- 22. Web site, in whole or in part. 4 Analyzing involves valuing the project -> same principles as valuing a security or business 5 A capital budgeting process should… Be easy to apply and explain Focus on cash flow Account for the time value of money Account for project risk Lead to investment decisions that maximize shareholders’ wealth © 2010 Cengage Learning. All Rights Reserved. May not be scanned, copied or duplicated, or posted to a publicly accessible Web site, in whole or in part. 5 Investment Decision Frameworks Net Present Value (NPV) Internal Rate of Return (IRR) Modified Internal Rate of Return (MIRR) Profitability Index Payback Discounted Payback All frameworks will require a financial forecast Most require size of cash flows, timing of cash flows and risk. 6 Typical profile: investment in development, marketing, capital
- 23. and inventory revenue ramp and then transition down costs to support and then reclaim of some investment Does the profile make economic sense? Create value 6 7 What Companies Do Globally © 2010 Cengage Learning. All Rights Reserved. May not be scanned, copied or duplicated, or posted to a publicly accessible Web site, in whole or in part. 7 Project Analysis General Framework What are the cash flows associated with the project Understand the strategy and operational assumptions related to the project Forecast the pro forma financials Income statement and balance sheet Percent of sales approach as starting point Utilize ratios & competitive positioning to guide assumptions Free Cash flow = CF from Operations - Investment in WC – Investment in LT Assets Only new, incremental cash flows should be included Assess riskiness of cash flows: Discount Rate WACC: Cost of Equity (CAPM) and Cost of Debt (after tax
- 24. yield) Market based costs and Target or Market weights Risk based on the project cash flows, not necessarily that of the company Apply decision criteria (NPV, IRR, payback) NPV generally the best method Test the decision and the critical assumptions What are the key inputs that have the most uncertainty? What causes the decision to change? Utilize Scenarios, Sensitivity, Breakeven to focus on key assumptions Recommendation with key risks identified and suggestions to mitigate 8 8 Capital Budgeting Decision Frameworks 9 Net Present Value Present Value of all future cash flows Discount rate based on risk of project Acceptance Criteria: NPV > $0 NPV Amount = amount of value creation IRR / MIRR Discount rate that results in NPV = 0 Cash flow forecast same as NPV analysis Acceptance Criteria: IRR > Cost of Capital Profitability Index Present Value of Cash Inflow divided by
- 25. Present Value of Cash Outflow Cash flow forecast same as NPV analysis Acceptance Criteria: PI > 1.0 Payback Numbers of time periods required to recoup the investment Cash flow forecast same as NPV analysis Acceptance Criteria: Arbitrary NPV Profile 10 Project NPV +$ $0 -$ Discount Rate NPV > $0 IRR > Discount Rate NPV < $0 IRR < Discount Rate
- 26. IRR of Project NPV versus IRR NPV and IRR will generally give the same decision. Exceptions: Mutually exclusive projects Scale is substantially different Timing of cash flows is substantially different Non-conventional cash flows – cash flow signs change more than once Modified IRR can help with the non conventional cash flows and re-investment rate assumptions 11 11 Profiles of non traditional CFs Reinvest rate assumptions: NPV= cost of capital IRR= IRR MIRR, define the reinvestment rate MIRR Example Company is considering investing in a new product requiring $35M in R&D and $125M in capital equipment. Total available market (TAM) size is 400M units / year. Company expects to address 15% of TAM and initially capture 2% market share.
- 27. Product price is $70 / unit COGS is 40% of price Sales and Marketing expense is estimated at 10% of revenue. General and administrative is 5% of revenue Working capital is forecast as: A/R at 10% of sales, Inventory at 15% of sales, A/P at 8% of sales Depreciation based on 3 year MACRS Tax rate is 35% Product life is approx 4 years. Equipment will have a $10M salvage value Cost of capital = 10% Should the company invest in the new product? 12 12 Which Cash Flows -> Incremental Cash Flows Cash flows matter—not accounting earnings. Incremental cash flows matter. Sunk costs do not matter. Don’t forget start-up and salvage value cash flows Opportunity costs matter. Externalities like cannibalism and erosion matter. Inflation matters. Taxes matter: we want incremental after-tax cash flows.
- 28. 13 13 14 14 Depreciation Many countries allow firms to use one depreciation method for tax purposes and another for reporting purposes. Accelerated depreciation methods such as the modified accelerated cost recovery system (MACRS) increase the present value of an investment’s tax benefits. Relative to MACRS, straight-line depreciation results in higher reported earnings early in an investment’s life. Which method would you expect companies to use when they file their taxes, and which would they use when preparing public financial statements? For capital budgeting analysis, it is the depreciation method for tax purposes that matters. 14 Assignments for Next Class Investment Decisions and Risk Analysis Chapter 11 15
- 29. 15 Summary – Investment Decision Frameworks Net present value Difference between market value and cost Accept the project if the NPV is positive Has no serious problems Preferred decision criterion Internal rate of return Discount rate that makes NPV = 0 Take the project if the IRR is greater than the required return Same decision as NPV with conventional cash flows IRR is unreliable with non-conventional cash flows or mutually exclusive projects MIRR can address the non-conventional cash flow issue Profitability Index Benefit-cost ratio Take investment if PI > 1 Cannot be used to rank mutually exclusive projects May be used to rank projects in the presence of capital rationing Payback Time required to recoup the initial investment Does not account for timing, risk or cash flows beyond payback period Payback decision criteria is arbitrary 16 16 NPV is preferred
- 30. Benefits of other methods -> provide insight on margin of safety A B NPV $10M $10.5M IRR 30% 12% Investment $5M $60M Example 17 A company has two potential projects to invest in: Each has a cost of capital of 10% What would you recommend? 17 18 Net Present Value r represents the minimum return that the project must earn to satisfy investors. r varies with the risk of the firm and/or the risk of the project. A key input in NPV analysis is the discount rate. Net Present Value (NPV) = Total PV of cash inflows – PV of costs Minimum Acceptance Criteria: Accept if NPV > 0 © 2010 Cengage Learning. All Rights Reserved. May not be scanned, copied or duplicated, or posted to a publicly accessible Web site, in whole or in part.
- 31. 18 19 Internal Rate of Return IRR found by computer/calculator or manually by trial and error The IRR decision rule is: If IRR is greater than the cost of capital, accept the project. If IRR is less than the cost of capital, reject the project. Internal rate of return (IRR) is the discount rate that results in a zero NPV for the project. © 2010 Cengage Learning. All Rights Reserved. May not be scanned, copied or duplicated, or posted to a publicly accessible Web site, in whole or in part. 19 Similar to a YTM calculation Significance of IRR / NPV=0 ? 20 Pros and Cons of Using NPV as Decision Rule NPV is the “gold standard” of investment decision rules. NPV is the present value of cash inflows less present value of cash outflows How much the project contributes to shareholder wealth Key benefits of using NPV as decision rule Focuses on cash flows, not accounting earnings Makes appropriate adjustment for time value of money
- 32. Can properly account for risk differences between projects Though best measure, NPV has some drawbacks. Lacks the intuitive appeal of payback Doesn’t capture managerial flexibility (option value) well 20 © 2010 Cengage Learning. All Rights Reserved. May not be scanned, copied or duplicated, or posted to a publicly accessible Web site, in whole or in part. 20 21 Pros and Cons of Payback Method Computational simplicity Easy to understand Focus on cash flow Disadvantages of payback method: Does not account properly for time value of money Does not account properly for risk Cutoff period is arbitrary Does not lead to value-maximizing decisions Advantages of payback method: © 2010 Cengage Learning. All Rights Reserved. May not be scanned, copied or duplicated, or posted to a publicly accessible Web site, in whole or in part. 21 The Profitability Index (PI) Minimum Acceptance Criteria: Accept if PI > 1
- 33. Ranking Criteria: Select alternative with highest PI Advantages: Easy to understand and communicate Correct decision when evaluating independent projects Disadvantages: Problems with mutually exclusive investments 22 Present Value of Future Cash Flows Initial Investment 22 Initial Cost 01234 Project S -$10,000$5,000$4,000$3,000$1,000 Project L -$10,000$1,000$3,000$4,000$6,750 After-Tax, End of Year, Project Cash Flows, CF t