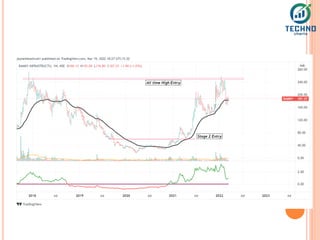
MULTIBAGGER STUDIES
By Jaynesh Kasliwal
NOTE
 In all my charts
 Red line is 21 ema
 Green line is 50 ema
 RS : 52 on weekly and 65 on Daily
 Black Line 30 wema
 DTF: daily time frame
SCREENER
 Excel Link for List of Stocks
 https://docs.google.com/document/d/1J-
DNTbgjTotI67P3zsh5SsSWfTOMsRzkQYzkZBUj-
Sc/edit?usp=sharing
RELATIVE STRENGTH
 Relative strength is a strategy used in momentum
investing and in identifying value stocks.
 It focuses on investing in stocks or other investments
that have performed well relative to the market as a
whole or to a relevant benchmark.
 For example, a relative strength investor might
select technology companies that have outperformed
the Nifty50, or stocks that are outperforming the
Nifty 500
 This is basically used for Identifying the strongest
sector , stocks , asset class by comparing the relative
performance
IN INDICATOR SECTION
 Type
 “Relative Strength”
 Choose any
 By bharattrader
 By traderlion
 By Modhelius
 I use by bharattrader
 In setting use 52 period
RS WHY?
 Helps to filter out stocks in good momentum and
that are giving better returns than nifty
 These stocks tend to outperform the market for a
long term
 These are potentially superstocks
 52 period signifies 1 Year of trading
 In 1 Year we have around 52 trading Weeks
OUTPERFORMANCE ON DTF
UNDERPERFORMANCE ON DTF
STAGE ANALYSIS
 Stan Weinstein's Stage Analysis offers traders a
powerful methodology to identify trends in the
markets while following strict risk management
principles.
STAGE 1
 Stage 1: The Basing Area This stage occurs at the
bottom of a longer term base or during the first
primary base a stock forms after it’s IPO. During
this stage the stock is oscillating under a
declining 30 week moving average.
 Traits in Stage 1 Buyers and sellers start to
balance each other out There is a volume dry up,
signaling major selling has subsided Volume will
start to increase towards the end of the period
without significant price concession
IEX CHART
STAGE 2 : INVESTING
 Stage 2: Advancing Phase This is the stage where
we should be looking to take long positions in a
stock or index. Buyers are now in control and the
balance of power is now in line with demand
 Stage 2: The Ideal Buy Point for Investors
Investors should watch for the first breakout on
volume just as the stock begins a new Stage 2
uptrend. Investors can buy the breakout or the
retest of the pivot point
TRADING STRATEGY
 Let us now summarize everything and apply the
whole concept in real trading
 What are we looking for ?
 Stock breaking out of stage 1 and above 30 wema
 Relative strength > 0 and increasing
 The more time RS was positive before the
breakout the better .
 Enter on Stage 1 Breakout
 Look for rising Volumes on right side of base
 3 types of entries
 Stage 1 Breakout
 52 week high Breakout
 All time / Multi Year Breakout
NAHAR POLY
ELECON
PG ELECTROPLAST
OLECTRA
OBSERVATION
 Most Stocks doubled Before entering into Stage 2
Uptrend
 52 week RS was positive in stage 2
 90% stocks even gave all time high breakout
after Stage 2
 Only ¼ of the stocks were trading above 100
before they became 5X
 Out of 85 Stocks only 20 were above 100 rs
 Even now 50 Stocks are having market Cap less
than 5000 Cr that means they were having
market cap of around 1k cr before they become
5X
 20 Stocks are having market cap above 20k cr
now
 66 Stocks have market cap 10k Cr now !
 Only 11 Stocks had ROE and ROCE >20 That
means Fundamentals didn’t matter that much
STOPLOSS HIT
PRAKASH INDUSTRY
 Risk Reward Will always be > 1:10 As if we ride
the complete trend till stage 3 Breakdown then
stocks become 2X 3X easily
 Small Losses should be Booked and Re entry
should be Taken if stock regains momentum

BSE
ONWARD
CENTURY PLY
SCREENER
 Screener Fitting criteria of old Study
 https://chartink.com/screener/multibagger-
stocks-564
DAILY CHART: GANESH HOUSING
HOW TO ENTER
POTENTIAL CHARTS FOR NEXT
MULTIBAGGERS
 Shankara Building
 Goa Crabon
 Ruchira Papers
 20 microns
 Tvs Electronics
 Eih
EIH
RUCHIRA
20 MICRONS
ORBIT EXPORTS
SHANKARA
 Understanding Bases:
 https://www.investors.com/ibd-university/how-to-
buy/bases-overview-1/
 https://marketsmithindia.com/post/how-to-count-
bases-why-you-should-3
Understanding Stage Analysis and Relative
Strength Videos 10 Hours+ Videos
https://tagmango.app/d79439f854
For Paid Calls , Swing Trading Strategy and
additional Services please dm :wa.link/mzh9un

Multibagger Studies (1).pdf

  • 1.
  • 2.
    NOTE  In allmy charts  Red line is 21 ema  Green line is 50 ema  RS : 52 on weekly and 65 on Daily  Black Line 30 wema  DTF: daily time frame
  • 3.
    SCREENER  Excel Linkfor List of Stocks  https://docs.google.com/document/d/1J- DNTbgjTotI67P3zsh5SsSWfTOMsRzkQYzkZBUj- Sc/edit?usp=sharing
  • 5.
    RELATIVE STRENGTH  Relativestrength is a strategy used in momentum investing and in identifying value stocks.  It focuses on investing in stocks or other investments that have performed well relative to the market as a whole or to a relevant benchmark.  For example, a relative strength investor might select technology companies that have outperformed the Nifty50, or stocks that are outperforming the Nifty 500  This is basically used for Identifying the strongest sector , stocks , asset class by comparing the relative performance
  • 6.
  • 7.
     Type  “RelativeStrength”  Choose any  By bharattrader  By traderlion  By Modhelius  I use by bharattrader  In setting use 52 period
  • 8.
    RS WHY?  Helpsto filter out stocks in good momentum and that are giving better returns than nifty  These stocks tend to outperform the market for a long term  These are potentially superstocks  52 period signifies 1 Year of trading  In 1 Year we have around 52 trading Weeks
  • 9.
  • 10.
  • 11.
    STAGE ANALYSIS  StanWeinstein's Stage Analysis offers traders a powerful methodology to identify trends in the markets while following strict risk management principles.
  • 12.
    STAGE 1  Stage1: The Basing Area This stage occurs at the bottom of a longer term base or during the first primary base a stock forms after it’s IPO. During this stage the stock is oscillating under a declining 30 week moving average.  Traits in Stage 1 Buyers and sellers start to balance each other out There is a volume dry up, signaling major selling has subsided Volume will start to increase towards the end of the period without significant price concession
  • 13.
  • 14.
    STAGE 2 :INVESTING  Stage 2: Advancing Phase This is the stage where we should be looking to take long positions in a stock or index. Buyers are now in control and the balance of power is now in line with demand  Stage 2: The Ideal Buy Point for Investors Investors should watch for the first breakout on volume just as the stock begins a new Stage 2 uptrend. Investors can buy the breakout or the retest of the pivot point
  • 16.
    TRADING STRATEGY  Letus now summarize everything and apply the whole concept in real trading  What are we looking for ?  Stock breaking out of stage 1 and above 30 wema  Relative strength > 0 and increasing  The more time RS was positive before the breakout the better .  Enter on Stage 1 Breakout  Look for rising Volumes on right side of base
  • 17.
     3 typesof entries  Stage 1 Breakout  52 week high Breakout  All time / Multi Year Breakout
  • 23.
  • 24.
  • 25.
  • 26.
  • 27.
    OBSERVATION  Most Stocksdoubled Before entering into Stage 2 Uptrend  52 week RS was positive in stage 2  90% stocks even gave all time high breakout after Stage 2
  • 28.
     Only ¼of the stocks were trading above 100 before they became 5X  Out of 85 Stocks only 20 were above 100 rs  Even now 50 Stocks are having market Cap less than 5000 Cr that means they were having market cap of around 1k cr before they become 5X  20 Stocks are having market cap above 20k cr now  66 Stocks have market cap 10k Cr now !
  • 29.
     Only 11Stocks had ROE and ROCE >20 That means Fundamentals didn’t matter that much
  • 30.
  • 31.
  • 32.
     Risk RewardWill always be > 1:10 As if we ride the complete trend till stage 3 Breakdown then stocks become 2X 3X easily  Small Losses should be Booked and Re entry should be Taken if stock regains momentum 
  • 33.
  • 34.
  • 35.
  • 36.
    SCREENER  Screener Fittingcriteria of old Study  https://chartink.com/screener/multibagger- stocks-564
  • 37.
  • 38.
  • 39.
    POTENTIAL CHARTS FORNEXT MULTIBAGGERS  Shankara Building  Goa Crabon  Ruchira Papers  20 microns  Tvs Electronics  Eih
  • 40.
  • 42.
  • 43.
  • 44.
  • 45.
  • 46.
     Understanding Bases: https://www.investors.com/ibd-university/how-to- buy/bases-overview-1/  https://marketsmithindia.com/post/how-to-count- bases-why-you-should-3
  • 47.
    Understanding Stage Analysisand Relative Strength Videos 10 Hours+ Videos https://tagmango.app/d79439f854 For Paid Calls , Swing Trading Strategy and additional Services please dm :wa.link/mzh9un