1. PT47–12_2 CONTAINER
HANDLING
Automation and safety on container
terminals
Accidents and injuries on the quayside have reduced
dramatically over the past 50 years, so how can we continue
this trend into the future?
Mark Sisson, PE, Senior Port Planner, AECOM, Oakland, CA, USA
Fewer injuries to one and all another paper. This paper focuses on post-containerization safety
“An Injury to One Is an Injury to All” is the famous slogan of trends, and explores the possibility of generating further safety
the International Longshore and Warehouse Union (ILWU) benefits by increasing automation at West Coast ports.
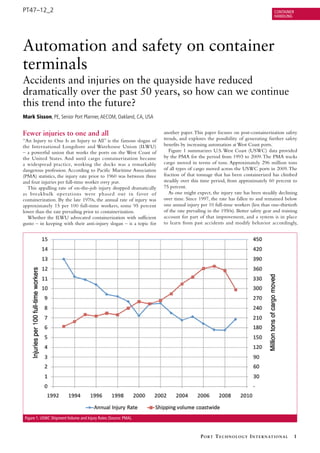
– a powerful union that works the ports on the West Coast of Figure 1 summarizes U.S. West Coast (USWC) data provided
the United States. And until cargo containerization became by the PMA for the period from 1993 to 2009. The PMA tracks
a widespread practice, working the docks was a remarkably cargo moved in terms of tons. Approximately 296 million tons
dangerous profession. According to Pacific Maritime Association of all types of cargo moved across the USWC ports in 2009. The
(PMA) statistics, the injury rate prior to 1960 was between three fraction of that tonnage that has been containerized has climbed
and four injuries per full-time worker every year. steadily over this time period, from approximately 60 percent to
This appalling rate of on-the-job injury dropped dramatically 75 percent.
as breakbulk operations were phased out in f avor of As one might expect, the injury rate has been steadily declining
containerization. By the late 1970s, the annual rate of injury was over time. Since 1997, the rate has fallen to and remained below
approximately 15 per 100 full-time workers, some 95 percent one annual injury per 10 full-time workers (less than one-thirtieth
lower than the rate prevailing prior to containerization. of the rate prevailing in the 1950s). Better safety gear and training
Whether the ILWU advocated containerization with sufficient account for part of that improvement, and a system is in place
gusto – in keeping with their anti-injury slogan – is a topic for to learn from past accidents and modify behavior accordingly,
Figure 1. USWC Shipment Volume and Injury Rates (Source: PMA).
P o rt t e c h n o l o g y I n t e r n at I o n a l 1
2. CONTAINER PT47–12_2
HANDLING
Figure 2. Injury rate by region.
which should result in a continuing drop in injuries on the job. larger, more modern terminals in Southern California benefit
Progressively higher rates of containerization (versus breakbulk from safer design features.
cargo) may also be a factor in driving down the injury rates. Perhaps when volumes decline, the demographics of the work
force change as older workers with more seniority are now forced
Safety in (tonnage) numbers? to do the physically tougher jobs that were done in busy times
The decline in injury rate has not been uniform, however, and it by younger (and presumably fitter) workers with less seniority.
is interesting to examine years when it went up to try to explain Perhaps the economic stress of a downturn in cargo volume
why increases might have occurred. Two years stand out in motivates some workers to apply for injury-related benefits to
particular: 2001 and 2009. One thing these years have in common cover lesser injuries that are ignored in good times (when
is that volume dropped in each of these years compared to the desirable overtime work may be more plentiful). This paper offers
previous year. no concrete answers to these intriguing questions, but hopefully
From 2008 to 2009, the total coastwide tonnage declined 16 does offer inspiration for further study and improvement –
percent, yet the injury rate increased 19 percent. This seems to particularly for USWC ports north of Los Angeles.
suggest some type of safety-in-scale effect at marine terminals.
Figure 2 plots injury rate by region for each of the four regions Automation equals safety
tracked by the PMA: Southern California, Northern California, Terminal automation is often touted as a way to achieve
Oregon, and Washington. substantial safety benefits. Both yard cranes and terminal transport
Figure 2 reinforces the notion that increased volume somehow equipment can be fully automated, although none of the yard
equates to increased safety. The Southern California region has equipment used on the USWC was automated in 2009. In order
by far the largest volume, and also the lowest rate of injury, of to estimate the potential decrease in injuries due to automation,
the four PMA regions. Rainy weather does not seem to be a it is important to examine the categories of workers that were
major factor affecting the injury rate, since rainy Washington has injured at USWC ports in 2009.
a lower rate of injury than sunny Northern California. The level Table 1 shows the number of injuries by worker category,
of containerization does not seem to be a major factor either. as well as an estimated reduction potential for two different
Heavily containerized Northern California shipments had a circumstances. Column (a) shows the potential reduction in
similar injury rate as bulk-heavy Oregon, which operates at the injuries at a terminal working with automated stacking cranes
same overall tonnage volume. (ASCs) and manned shuttle carriers such as APMT’s Virginia
So what factors drive down the rate of injury as volume Terminal. Column (b) shows estimated reductions for a container
increases? Perhaps there are certain fixed sources of injury, such terminal working with ASCs and automated guided vehicles
as vessel mooring. A vessel undertaking 500 container moves (AGVs) such as the Euromax Terminal in Rotterdam. (Note:
requires the same amount of line handling, and offers the same Reduction percentages are the author’s best estimates based on
opportunities for injury during line handling, as one doing 5,000 mainly anecdotal data.)
moves in a single port call. Perhaps yard tractor drivers and other Tractor Driver: With AGVs in place no tractor drivers are
workers develop a safer work pattern on vessels that are doing a needed, and therefore all associated driver injuries are eliminated.
high number of container moves per call. Or perhaps the typically With manned shuttle operations, approximately half the number
2 P o rt t e c h n o l o g y I n t e r n at I o n a l www.porttechnology.org
3. PT47–12_2 CONTAINER
HANDLING
Figure 3. Injury reduction potential of automated terminals.
of vehicles would be required compared to a conventional Gantry crane driver: This refers to both rubber-tired gantry
terminal, so injuries could be expected to decline by half as well. (RTG) and quay cranes, with quay crane drivers accounting for
Mechanic: In either case, there are fewer vehicles and less overall the majority of the hours. Since all RTG driver positions will be
maintenance activity required due to the more regular pattern of eliminated, any associated injuries will be eliminated as well. The
operations. Spreaders, for example, require much less maintenance need for top-pick drivers will also be eliminated. Although top-
in automated terminals because the automated cranes always pick drivers are not listed on the most frequently injured list and
set containers down gently. A 25 percent reduction in injuries their hours are not tracked in this category, presumably they incur
is estimated, based on anecdotal evidence from representative some injuries that will be eliminated by converting to ASCs. An
terminals. overall reduction rate of 50 percent reflects the elimination of
all injuries to both RTG and top-pick drivers, but no change in
Foreman and clerk supervisor: The number of supervisors
injury rate to gantry crane drivers.
required is a function of the overall number of workers engaged
Even if a USWC terminal is converted to a highly automated
at a facility. With automated terminals and automatic container
design such as that used at Euromax, no change is expected in the
positioning, far fewer supervisors will be required, and injury rates
number of lashers, holdmen or dockmen. These are people who are
should decline accordingly. Therefore the estimated reduction
handling mooring lines, securing the containers on the ship, and
in injuries to supervisory staff is 67 percent with AGVs, or 50
installing or removing inter-box connectors (twist-locks). These
percent with shuttles in place.
are strenuous jobs that frequently result in muscle strain or other
injuries if the worker is not fit or is using improper technique.
Table 1: 2009 InjurIes by caTegory, and poTenTIal If the factors from Table 1 are applied to a hypothetical future
for reducTIon vIa auTomaTIon scenario – with all container ports on the USWC converted to
Estimated Injury Reduction
ASC-based terminals – injuries would be reduced as shown in
(%) with: Figure 3.
Conversion from existing manual operations to full automation
2009 Injuries Column (a) Column (b) (including AGVs) could potentially reduce injur ies by
ASC+Shuttles ASC+AGV
approximately 40 percent. A 25 percent reduction in injuries is
Tractor driver 298 50 100 expected from conversion to an ASC/shuttle-type terminal. These
Lasher 214 0 0 reductions equate to a prevention of approximately 450 and 290
Mechanic 216 25 25
injuries per year respectively across the entire USWC.
One promising technology for further injury prevention is the
Holdman 124 0 0 use of automated mooring with vacuum devices, as opposed to
Dockman 88 0 0 using traditional ropes. Figure 4 compares traditional mooring
Foreman 77 50 67 with vacuum-based automated mooring technology; the exposed
workers in the left image are simply unneeded – and therefore
Clerk supervisor 53 50 67 not at risk – when better technology is used.
Gantry crane driver 35 50 50 Approximately 2 percent of the total longshore hours were
charged to line handing in 2009. Complete conversion to
P o rt t e c h n o l o g y I n t e r n at I o n a l 3
4. CONTAINER PT47–12_2
HANDLING
Figure 4. Manual versus automated mooring.
automated mooring should have the potential to reduce injuries Safety on the docks of the U.S. West Coast has come a long
by at least 2 percent, compared to 2009 levels. way in the past 50 years, and further improvements are still
Dockmen who are responsible for twist-lock handling readily available through the use of automation. However, with
account for 8 percent of the injuries listed in the PMA’s top no automation on the horizon for on-ship lashing or equipment
eight categories shown in Figure 3. But devices such as the repair (another essential activity that is burdened with high
PinSmart machine developed by RAM Spreaders may be able to injury rates), some level of injuries will continue to occur on
significantly reduce the labor required to install and remove twist- container terminals. Continuous vigilance and increasingly
locks from containers, thereby eliminating many of the associated thorough training will be required to reduce the injuries incurred
injuries. performing these types of manual tasks.
abouT THe auTHor enquIrIes
mark sisson, PE, is a senior analyst with AECOM’s marine practice. He is based in AECOM, 300 South Grand Avenue, Second Floor, Los Angeles, CA 90071, USA
Oakland, California, USA and can be reached at Mark.Sisson@aecom.com or at Tel: +1 (213) 330 7200 Fax: +1 (213) 330 7291
+01 510 844 0549. Web: www.aecom.com
4 P o rt t e c h n o l o g y I n t e r n at I o n a l www.porttechnology.org