2. Among other iron based compounds, FePt is an ideal com-
pound, but the cost and availability of Pt make it unsuitable for
mass application.
A relatively cheaper but interesting compound, Fe3Se4, has
been studied since the 1950s,8,9
but its hard magnetic property
remained unattended for a long time. Fe3Se4 has a NiAs-type
structure, and the iron vacancies are arranged in an ordered
fashion.8
Single crystal studies on Fe3Se4 have shown that it has
a monoclinic unit cell of dimensions a = 6.167 Å, b = 3.537 Å,
c = 11.17 Å, and β = 92.0°.11,12
Fe3Se4 orders ferrimagnetically
below 313 K. The easy axis of magnetization is in the c plane.
However, the magnetization does not saturate even at 11 T.8
The importance of this compound lies in its large uniaxial
magnetocrystalline anisotropy. In the case of anisotropic nano-
structures the anisotropy of the system can be further enhanced.
Recently, Zhang et al. have synthesized Fe3Se4 nanostructures
by a simple solution phase method that exhibits hard mag-
netic properties.10
There are only a few reports where this
ferrimagnetic monoclinic phase of iron chalcogenide has been
studied in nano dimensions.10−14
A coercivity value as large
as 40 kOe has been achieved at 10 K.6
The temperature
dependence of magnetocrystalline anisotropy of this compound
was studied both experimentally and theoretically by Wang
et al.13
Despite possessing such a unique property, the energy
product of this compound is low because of its low satura-
tion magnetization. At room temperature, a typical reported
magnetization value at a field of 9 T is ∼5 emu/g;10
however,
smaller values of magnetization, such as 1.89 emu/g at 300 K13
and 2.2 emu/g at 293 K12
for Fe3Se4 nanostructures, are also
reported.
Figure 2. (a−h) High resolution transmission electron microscope images (a) for Fe3Se4 and (b−h) for Fe3−xMnxSe4 (x = 0.01, 0.02, 0.03, 0.04,
0.05, 0.07, 0.1) samples at 200 nm scale. (i−p) High resolution transmission electron microscope images for Fe3−xMnxSe4 (x = 0.01, 0.02, 0.03, 0.04,
0.05, 0.07, 0.1) samples at 50 nm scale.
The Journal of Physical Chemistry C Article
dx.doi.org/10.1021/jp411956q | J. Phys. Chem. C 2014, 118, 4016−40224017
3. The most imperative figure of merit for the hard magnets is
the maximum energy product (BH)max. The theoretical maxi-
mum of (BH)max is given by the following equation:2
μ=BH M( )
1
4
max 0 s
2
(1)
where μ0 is the permeability of free space and Ms is the
saturation magnetization. As the saturation magnetization (Ms)
plays a very important role in deciding the energy product,
increasing the Ms value is very crucial for its application in hard
magnetic materials.
The ferrimagnetism in Fe3Se4 arises due to the ordered iron
vacancy on the alternate layers of iron.10
Substitution of some
Fe with Mn ions may have an important influence on the net
ferrimagnetic moment of the system. In this work, we report a
significant increase in the saturation magnetization of Fe3Se4
nanostructures by doping Mn ions in Fe sites, Fe3−xMnxSe4
(x = 0.01−0.2). We also report a detailed analysis of the Raman
spectra explaining the effect of manganese ion doping on the
crystal structure, which may be related to the increase in satu-
ration magnetization.
2. EXPERIMENTAL SECTION
2.1. Materials. Iron(III) 2,4-pentanedionate [Fe(acac)3]
(>97%), manganese(III) 2,4-pentanedionate [Mn(acac)3]
(technical grade), Se (powder, 99.999%), and oleylamine
(80−90%) were purchased from Sigma-Aldrich and were used
without any further purification.
2.2. Synthesis of Fe3Se4 Nanoparticles. The synthesis
was done by a high temperature organic solution phase method
as reported elsewhere.10
Briefly, 0.53 g (1.5 mmol) of Fe(acac)3
and 0.158 g (2 mmol) of Se powder were added to 15 mL of
oleylamine in a 100 mL three-neck flask under N2 atmosphere.
The mixture was heated to 120 °C and kept for 1 h. Then, the
temperature was increased to 200 °C and kept for 1 h. Finally,
the solution temperature was raised to 300 °C and kept for 1 h.
After 1 h, the heat source was removed and the solution was
allowed to cool naturally to room temperature. The Fe3Se4
nanoparticles were precipitated by the addition of 20 mL of
2-propanol. The precipitate was then centrifuged and washed
with a solution containing hexane and 2-propanol in a 3:2 ratio.
2.3. Synthesis of Mn-Doped Fe3Se4 Nanoparticles.
[Fe(acac)3] and [Mn(acac)3] were mixed in a certain ratio (total
1.5 mmol) to synthesize Mn doped iron selenide nanoparticles
(Fe3−xMnxSe4) with x = 0.01, 0.02, 0.03, 0.04, 0.05, 0.07, 0.1,
or 0.2.
2.4. Characterization Methods. Powder X-ray diffraction
(XRD) patterns were collected with the use of a PANalytical
X’PERT PRO instrument using iron filtered Cu Kα radiation
(λ = 1.5406 Å) in the 2θ range of 20−70° with a step size of
0.02°. The size and morphology of the prepared particles were
obtained with the use of an FEI Technai F30 high resolution
transmission electron microscope (HRTEM) equipped with
a supertwin lens (s-twin) operated at 300 keV accelerating vol-
tage with a Schottky field emitter source with a maximum beam
current (>100 nA) and small energy spread (0.8 eV or less).
The point-to-point resolution of the microscope is 0.20 nm
with a spherical aberration of 1.2 mm and a chromatic aberration
of 1.4 mm with a 70 μm objective aperture size. The powders
obtained were dispersed in hexane and then drop-cast on a
carbon-coated copper TEM grid with 200 mesh and loaded to a
single tilt sample holder.
Raman spectra were recorded on an HR-800 Raman spec-
trophotometer (Jobin Yvon-Horiba, France) using monochro-
matic radiation (achromatic Czerny−Turner type monochro-
mator with silver treated mirrors) emitted by a He−Ne laser
(633 nm), operating at 20 mW and with accuracy in the range
between 450 and 850 nm ± 1 cm−1
, equipped with a ther-
moelectrically cooled (with Peltier junctions), multichannel,
spectroscopic grade CCD detector (1024 × 256 pixels of
26 μm) with dark current lower than 0.002 electron pixel−1
s−1
.
An objective of 50× LD magnification was used both to focus
and to collect the signal from the powder sample dispersed on
the glass slide.
Static magnetic property measurements of Fe3Se4 nano-
particles were performed using a physical property measure-
ment system (PPMS) from Quantum Design Inc., San Diego,
CA, equipped with a 9 T superconducting magnet. We per-
formed dc magnetization vs temperature (M−T) and magnetic
field vs magnetization hysteresis (M−H) measurements using a
vibrating sample magnetometer (VSM) attachment. For dc
magnetic measurements, the samples were precisely weighed
and packed inside a plastic sample holder which fit into a brass
sample holder provided by Quantum Design Inc. with neg-
ligible contribution in the overall magnetic signal. We collected
M−H loops at a rate of 50 Oe/s in a field sweep from −85 to
85kOe at the vibrating frequency of 40 Hz. The M−T mea-
surements were also carried out in the temperature range from
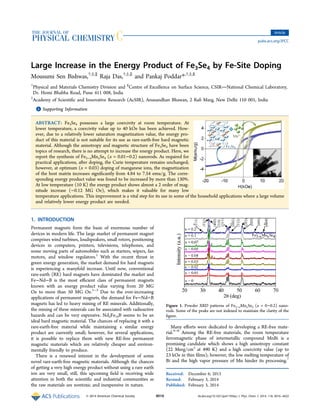
Figure 3. (A) Raman spectra of Fe3−xMnxSe4 (x = 0−0.2) nanorods.
(B) Zoomed-in view of the encircled region in (A).
The Journal of Physical Chemistry C Article
dx.doi.org/10.1021/jp411956q | J. Phys. Chem. C 2014, 118, 4016−40224018
4. 3 to 350 K at 100 Oe. The cooling and heating rates were kept
constant at 2 K/min for all the measurements. First, at 350 K,
the desired field was applied and the system was cooled to 3 K
and data were recorded while the sample was heated from 3 to
350 K. The curve obtained was designated as field cooled (FC)
cooling and field cooled heating, respectively. For zero field
cooled (ZFC) measurements, the sample was first cooled from
350 to 3 K in zero magnetic field and data were collected in
heating mode once the field was applied at 3 K.
3. RESULTS AND DISCUSSION
3.1. X-ray Diffraction. The crystal structure of Fe3Se4 was
characterized from the powder X-ray diffraction patterns. The
XRD peaks of the pure Fe3Se4 nanostructures are in good
agreement with bulk Fe3Se4 (JCPDS Card No. 657252), which
has monoclinic structure with a space group I2/m (12) and unit
cell lattice parameters a = 12.73, b = 3.493, and c = 6.159 Å (see
Supporting Information, Figure S1). The strongest line in the
pattern corresponds to the (111) plane. No significant changes
in the peak positions were observed in the XRD patterns of
Mn-doped samples compared with undoped Fe3Se4 (Figure 1).
Some peak broadening was observed for the (311) and (6̅02)
doublet peak with increasing doping concentration. The peak
broadening might be due to increase in lattice strain after
doping with Mn. Moreover, the X-ray form factors for Fe and
Mn are 15.6 and 14.9, respectively, and ionic radii for Fe3+
and
Mn3+
are 55 and 65 pm, respectively. Therefore, it is difficult
to interpret the intensity profile from Fe and Mn using a
lab source X-ray diffractometer. For the highly doped samples
(x = 0.1 and 0.2), the intensity of the (1̅12) and (6̅02) peaks
decreases slightly compared to other lightly doped samples.
The reason for this decrease of intensity of the (1̅12) and (6̅02)
peaks is not clear to us yet.
3.2. Electron Microscopy Imaging and Diffraction
Study. The HRTEM study of the Fe3Se4 nanostructures and
Mn-doped nanostructures shows that the rod-shaped nano-
structures are highly aggregated for all the samples (Figure 2)
due to their ferrimagnetic nature at room temperature.
Moreover, the image quality for magnetic particles is also
affected due to the strong Lorentz interaction of electrons with
oriented spins inside the particles. The diameter of the nano-
rods is in the range 30−50 nm. From high resolution images
(see Supporting Information, Figure S2), the lattice fringe with
interplanar distance d111 = 0.27 nm is clearly visible (which is
slightly larger than the point resolution of our microscope in
Scherzer defocus condition and atoms are visible as dark spots).
No significant changes in the morphology, size, and interplanar
distance of rods are observed after Mn doping. The selected
area electron diffraction (SAED) pattern shows (see Supporting
Information, Figure S3) the ring pattern though each particle
is single crystalline in nature (see Supporting Information,
Figure S3), which is due to the random orientation of a large
collection of such particles contributing from the selected area
by the SAED aperture in the back focal plane of the electron
microscope. From the energy dispersive spectra (EDS) of as-
synthesized Fe3Se4nanostructures, the Kα emission gives the
Figure 5. (A) Comparison of magnetization versus temperature curves
(in ZFC and FC modes) for undoped and doped (x = 0.04) Fe3Se4
nanorods. (B) Zoomed-in view of M−T curve around the transition
temperature to show that the Curie temperature does not change with
doping.
Figure 4. (A) Variation of the fwhm of Raman modes of 225 and
400 cm−1
in the Raman spectra with doping concentration x. (B)
Variation of the peak shift of Raman modes of 225 and 400 cm−1
in the
Raman spectra with doping concentration x with respect to pure Fe3Se4.
The Journal of Physical Chemistry C Article
dx.doi.org/10.1021/jp411956q | J. Phys. Chem. C 2014, 118, 4016−40224019
5. ratio of the atomic percent of iron and selenium as 0.75 (see
Supporting Information, Figure S4 and Table S1).
3.3. Raman Study. Raman scattering is an excellent tool to
study the lattice strain and bond disorder. We observed that the
Raman spectra of all samples (doped and undoped) are the
same with little shift in peak position and change in the full
width at half-maximum (fwhm). We believe that this is the first
report of Raman spectra of Fe3Se4, and therefore, due to the
absence of any previous report on Raman spectra of Fe3Se4
in the literature, we compared our results with those for
β-Mg2SiO4, which crystallizes in a similar I2/m space group
symmetry.15,16
The peaks at ∼228 and 411 cm−1
in Fe3Se4
spectra can be assigned to lattice vibration (Figure 3). The shift
in Raman peak position as a function of Mn doping concen-
tration is shown in Figure 4. It was found that both Raman
peaks shift to lower cm−1
as the Mn doping concentration
increases and show a dip at x = 0.05 and then again shift to
higher cm−1
. From this observation, it can be concluded that,
for the increase in the doping until x = 0.05, the lattice strain
decreases and, for higher doping, the lattice strain increases.
The fwhm also shows the same doping concentration (x =
0.05) as a peak and higher doping concentration samples show
almost similar values of fwhm. The increase in fwhm can be due
to the increase in disorder in the lattice.
3.4. Magnetic Studies. The temperature-dependent
magnetization is measured in a 100 Oe field. From the M−T
curve, the Curie temperature of iron selenide nanoparticles is
found to be 328 K (Figure 5A). According to earlier reports of
doping with transition metals,6
the Curie temperature and the
saturation magnetization decreased with increased concen-
tration of Co ion doping and the samples become paramagnetic
at room temperature. The coercivity at room temperature was
reduced to zero with cobalt ion doping. From the zoomed-in
view of the M−T curve (Figure 5B), it is clear that the Curie
temperature does not change with Mn ion doping.
All the doped and undoped samples show hard magnetic
properties (Figure 6).The room temperature coercivity (Hc) of
Fe3Se4 is found to be 2.74 kOe. This coercivity value is com-
parable to those of the RE-based nanoparticles of SmCo5
(Hc 2−8 kOe) and Nd2Fe12B (Hc 1.2−4 kOe).17−20
The inset
of Figure 6 shows a zoomed-in view of the hysteresis curves
clearly depicting the coercive and remanence field for samples
with varying doping concentration. At lower temperature a
colossal increase in coercivity is observed and Hc reaches
27.08 kOe at 10 K (Figure 7), which is in good agreement with
the earlier reports.6,8,9
M−H data show no saturation of magne-
tization even at the field value of 8.5 T (Figure 6).This may be
due to a superparamagnetic contribution in the magnetization
which may come from some ultrafine particles;9
also, any
“ferri”magnetic system requires a higher field to align all the
spins and we may have uncompensated spin and spin disorder
at the surface of the nanorods. For Fe3Se4 the magnetization at
8.5 T is 4.8 emu/g at 300 K, which increases to 14.18 emu/g at
10 K (Figure 7). The saturation magnetization is determined
from the M versus 1/H plot at the high field range (above 6 T).
As we increase the Mn doping concentration slowly from x =
0.01 to 0.03, the magnetization value (Ms) increases from 5.76
to 7.5 emu/g; the remanence magnetization (Mr) also shows an
increase in this range. Beyond x = 0.03 (for x = 0.04, 0.05,
0.07), the Ms values decrease with increase in doping concen-
tration. As the Mn doping is further increased (x = 0.1, 0.2),
Table 1. Summary of Magnetization Parameters Calculated for Fe3−xMnxSe4 Nanorodsa
no. x Hc(300 K) (kOe) Ms (emu/g) Mr (emu/g) Mr/Ms Ha(300 K) (kOe) K(300 K) (erg/cm3
) energy product (kG Oe)
1 0 2.74 4.84 1.63 0.336 7.053 1.12 × 10⁵
4.377
2 0.01 2.76 5.79 1.9 0.328 7.376 1.4 × 10⁵
5.858
3 0.02 2.47 6.73 2.11 0.313 6.028 1.33 × 10⁵
7.352
4 0.03 2.17 7.54 2.5 0.331 5.169 1.38 × 10⁵
10.22
5 0.04 2.4 5.74 1.93 0.336 6.054 1.14 × 10⁵
6.139
6 0.05 2.65 5.55 1.97 0.354 6.427 1.17 × 10⁵
6.457
7 0.07 2.3 5.20 1.84 0.353 5.497 0.94 × 10⁵
5.575
8 0.1 1.99 4.56 1.35 0.296 5.154 0.82 × 10⁵
3.08
9 0.2 1.94 4.41 1.09 0.247 5.211 0.75 × 10⁵
1.953
a
Hc, coercivity; Ha, anisotropy field; K, anisotropy constant.
Figure 6. Comparison of M−H curves for Fe3−xMnxSe4 (x = 0, 0.01,
0.02, 0.03, 0.04, 0.05, 0.07, 0.1, and 0.2) nanorods at 300 K.
Figure 7. Comparison of M−H curves for Fe3−xMnxSe4 (0, 0.1, and
0.2) nanorods at 10 and 300 K.
The Journal of Physical Chemistry C Article
dx.doi.org/10.1021/jp411956q | J. Phys. Chem. C 2014, 118, 4016−40224020
6. the saturation magnetization shows a significant decrease and
drops even below that of the Fe3Se4 sample (Table 1). A similar
phenomenon of decrease in saturation magnetization at higher
doping concentration is also observed when monoclinic
zirconia is doped with manganese ions.21
The reason for this
decrease in saturation magnetization with higher Mn ion con-
centration may be attributed to the antiferromagnetic coupling
between manganese ions at higher doping concentration.23
For
Fe3Se4 the Mr/Ms value was found to be 0.336; for a heavily
doped sample (x = 0.2) this ratio drops to 0.247 (Figure 8).
The coercivity experiences a very small decrease with manga-
nese doping for low doping concentration. However, for x = 0.1
and 0.2, the coercivity reduces significantly (Table 1). The
reason for the increase in saturation magnetization initially with
manganese ion doping may be due to the net contribution of
Mn ions to the ferrimagnetic moment. At 10 K, the coercivity
of Fe3Se4 increases to 29.5 kOe, which is 10-fold greater than
the value at 300 K. The M−H loop becomes close to square at
10 K and the Mr/Ms ratio increases to 0.587.
The upper limit to coercivity is determined by the anisotropy
field of the material.4
As a general trend, the coercivity of the
material reaches nearly 25% of the anisotropy field. We have
determined the anisotropy field by extrapolating the magne-
tization graph in easy and hard axis directions.22,23
The aniso-
tropy constant (K) at 300 K was calculated from the saturation
magnetization (Ms) and anisotropy field (Ha) according to the
following equation.
=K M H
1
2
s a
(2)
At 300 K, K for Fe3Se4 is 1.12 × 10⁵
erg/cm3
. The K value was
determined for all nine samples and is tabulated in Table 1. As
observed earlier,6
the K value for Fe3Se4 is an order of
magnitude higher than that for Fe3O4.
The energy product of all the samples was calculated from
the third quadrant of the B−H hysteresis loop at 300 K. The
third quadrant of the B−H loop for pure Fe3Se4 nanostructures
is shown in Figure 9. The area under the shaded portion repre-
sents the energy product of the sample. For Fe3Se4 the energy
product is found to be 4.38 kG Oe, which increases to 10.22 kG
Oe for Fe2.97Mn0.03Se4. At 10 K, the energy product increases
by almost 2 orders of magnitude for Fe3Se4 (∼0.12 MG Oe).
The practical energy product that we can get from a permanent
magnet depends strongly on its processing. The alignment
of easy axes in a particular direction can greatly enhance the
Mr/Ms ratio and help in increasing the energy product.
Compacting the magnetic nanoparticles with high packing
densities is very crucial for the development of permanent
magnets. This enhancement of the energy product by more
than 130% is a vital step in developing new rare-earth-free
alternatives to permanent magnets.
4. CONCLUSION
In conclusion, we have successfully synthesized manganese
doped iron selenide nanostructures in an attempt to increase
the energy product of the sample. The magnetization value in-
creased from 4.84 to 7.54 emu/g, without any change in the
Curie temperature, which is important for its application in
hard magnets. We could obtain a more than 130% increase in
the energy product value in manganese doped iron selenide
nanostructures. At lower temperatures, a 2 order of magnitude
increase in the energy product is observed. The reason for the
decrease in coercivity and saturation magnetization in highly
doped samples is not clear and is a subject of further study with
the help of neutron diffraction studies, etc.
■ ASSOCIATED CONTENT
*S Supporting Information
X-ray diffraction pattern image, selected area diffraction pattern,
high resolution images of lattice fringes, and EDX spectrum
images. This material is available free of charge via the Internet
at http://pubs.acs.org.
■ AUTHOR INFORMATION
Corresponding Author
*E-mail: p.poddar@ncl.res.in.
Author Contributions
∥
M.S.B. and R.D. contributed equally to this work.
Notes
The authors declare no competing financial interest.
■ ACKNOWLEDGMENTS
P.P. acknowledges the Centre of Excellence on Surface Science
at the National Chemical Laboratory and network project
Nano-SHE funded by the Council of Scientific and Industrial
Research (CSIR), India, and Department of Science &
Technology (DST), India (DST/INT/ISR/P-8/2011). M.S.B.
Figure 8. Variation of Ms and Mr/Ms ratio with doping concentration
(x) for Fe3−xMnxSe4 nanorods.
Figure 9. M−H plot and B−H plot for Fe3Se4 nanocrystals at 300 K.
(inset) Calculation of maximum energy product from the B−H
hysteresis loop of Fe3Se4 at 300 K.
The Journal of Physical Chemistry C Article
dx.doi.org/10.1021/jp411956q | J. Phys. Chem. C 2014, 118, 4016−40224021
7. acknowledges the Department of Science and Technology,
INSPIRE, India, for financial support. R.D. acknowledges the
Council of Scientific and Industrial Research (CSIR), India, for
providing a Senior Research Fellowship (SRF).
■ REFERENCES
(1) Cullity, B. D.; Graham, C. D. Introduction to Magnetic Materials;
IEEE Press, John Wiley & Sons, Inc.: Hoboken, NJ, 2009.
(2) Coey, J. M. D. Hard Magnetic Materials: A Perspective. IEEE
Trans. Magn. 2011, 47, 4671−4681.
(3) Kirchmayr, H. R. Permanent Magnets and Hard Magnetic
Materials. J. Phys. D: Appl. Phys. 1996, 29, 2763−2778.
(4) Kurmoo, M.; Kepert, C. J. Hard Magnets Based on Transition
Metal Complexes with the Dicyanamide Anion, {N(CN)2}−
. New J.
Chem. 1998, 22, 1515−1524.
(5) Gutfleisch, O.; Lyubina, J.; Müller, K. H.; Schultz, L. FePt Hard
Magnets. Adv. Eng. Mater. 2005, 7, 208−212.
(6) Kramer, M. J.; Mccallum, R. W.; Anderson, I. A.; Constantinides,
S. Prospects for Non-Rare Earth Permanent Magnets for Traction
Motors and Generators. JOM 2012, 64, 752−763.
(7) Kharel, P.; Shah, V. R.; Li, X. Z.; Zhang, W. Y.; Skomski, R.;
Shield, J. E.; Sellmyer, D. J. Structural and Magnetic Properties of Pr-
alloyed MnBi Nanostructures. J. Phys. D: Appl. Phys. 2013, 46, 095003.
(8) Hirakawa, K. The Magnetic Properties of Iron Selenide Single
Crystals. J. Phys. Soc. Jpn. 1957, 12, 929−938.
(9) Andresen, A. F. A Neutron Diffraction Investigation of Fe3Se4.
Acta Chem. Scand. 1968, 22, 827−835.
(10) Zhang, H.; Long, G.; Li, D.; Sabirianov, R.; Zeng, H. Fe3Se4
Nanostructures with Giant Coercivity Synthesized by Solution
Chemistry. Chem. Mater. 2011, 23, 3769−3774.
(11) Lin, C. R.; Siao, Y. J.; Lu, S. Z.; Gau, C. Magnetic Properties of
Iron Selenide Nanocrystals Synthesized by the Thermal Decom-
position. IEEE Trans. Magn. 2009, 45, 4275−4278.
(12) Long, G.; Zhang, H.; Li, D.; Sabirianov, R.; Zhang, Z.; Zeng, H.
Magnetic Anisotropy and Coercivity of Fe3Se4 Nanostructures. Appl.
Phys. Lett. 2011, 99, 202103.
(13) Wang, J.; Duan, H.; Lin, X.; Aguilar, V.; Mosqueda, A.; Zhao, G.
M. Temperature Dependence of Magnetic Anisotropy Constant in
Iron Chalcogenide Fe3Se4: Excellent Agreement With Theories. J.
Appl. Phys. 2012, 112, 103905.
(14) Li, D.; Jiang, J. J.; Liu, W.; Zhang, Z. D. Positive
Magnetoresistance in Fe3Se4 Nanowires. J. Appl. Phys. 2011, 109,
07C705.
(15) Kleppe, A. K.; Jephcoat, A. P.; Olijnyk, H.; Slesinger, A. E.;
Kohn, S. C.; Wood, B. J. Raman Spectroscopic Study of Hydrous
Wadsleyite. (β-Mg2SiO4) to 50 GPa. Phys. Chem. Miner. 2001, 28,
232−241.
(16) Yang, X.; Dubrovinsky, L.; Manthilake, M. A. G. M.; Wei, Q.
High-Pressure and High-Temperature Raman Spectroscopic Study of
Hydrous Wadsleyite (β-Mg2SiO4). Phys. Chem. Miner. 2012, 39, 57−
64.
(17) Balamurugan, B.; Sellmyer, D. J.; Hadjipanayis, G. C.; Skomski,
R. Prospects for Nanoparticle-Based Permanent Magnets. Scr. Mater.
2012, 67, 542−547.
(18) Balamurugan, B.; Skomski, R.; Li, X.; Valloppilly, S. R.; Shield, J.
E.; Hadjipanayis, G. C.; Sellmyer, D. J. Cluster Synthesis and Direct
Ordering of Rare-Earth Transition-Metal Nanomagnets. Nano Lett.
2011, 11, 1747−1752.
(19) Balamurugan, B.; Skomski, R.; Li, X. Z.; Hadjipanayis, G. C.;
Sellmyer, D. J. Magnetism of Directly Ordered Sm-Co Clusters. J.
Appl. Phys. 2012, 111, 07B527.
(20) Akdogan, N. G.; Hadjipanayis, G. C.; Sellmyer, D. J. Novel
Nd2Fe14B Nanoflakes and Nanoparticles for the Development of High
Energy Nanocomposite Magnets. Nanotechnology 2010, 21, 295705.
(21) Zippel, J.; Lorenz, M.; Setzer, A.; Wagner, G.; Sobolev, N.;
Esquinazi, P.; Grundmann, M. Defect-Induced Ferromagnetism in
Undoped and Mn-doped Zirconia Thin Films. Phys. Rev. B 2010, 82,
125209.
(22) Joy, P. A.; Date, S. K. Comparison of the Zero-Field-Cooled
Magnetization Behavior of Some Ferromagnetic and Ferrimagnetic
Systems. J. Magn. Magn. Mater. 2000, 218, 229−237.
(23) Joy, P. A.; Date, S. K. Unusual Magnetic Hysteresis Behavior of
Oxide Spinel MnCo2O4. J. Magn. Magn. Mater. 2000, 210, 31−34.
The Journal of Physical Chemistry C Article
dx.doi.org/10.1021/jp411956q | J. Phys. Chem. C 2014, 118, 4016−40224022