
Recommended
More Related Content
Similar to Comparative StudyReviewer______________________Author of .docx
Similar to Comparative StudyReviewer______________________Author of .docx (10)
More from monicafrancis71118
More from monicafrancis71118 (20)
Recently uploaded
Recently uploaded (20)
Comparative StudyReviewer______________________Author of .docx
- 1. Comparative Study Reviewer:______________________ Author of the Study:__________________ Criteria Feedback 1. Ask A Question · Is the question clearly stated? · Is the population clear? · Are the variables clearly defined? 2. Collect Data · Do you understand how this data was gathered? · Does the author state the potential biases? · Are there any potential problems with how this data was gathered (that have not been addressed by the researcher)? 3. Analyze the data · Are the analyses appropriate for the data? Support/Explain. · Are the analyses labeled and explained? Support/Explain. · Are any of the representations of the data misleading or potentially misleading? Support/Explain. · Do you have any questions? 4. Interpret the data · Has the question been answered?
- 2. · Is this interpretation clearly supported by the analysis? Explain. · Do you have any questions? 5. Reflection · Has the author reflected on both positive and negative experiences? · Has he/she commented on surprising or unexpected results/experiences? · Has he/she considered how to improve the study? Engineers and swing dancing Clayton 8/19/2014 The Question: Are Engineers attracted to Swing Dancing?
- 3. In more detail: Is the percentage of swing dance engineers significantly greater than the percentage of non-swing dance engineers 2 Why this question? It seems like almost everybody at a swing dance is an engineer Is this because I live in Boston? I have been a swing dancer for many years, and it has always struck me as odd that there are so many engineers. I am curious to find out if the quantity of engineers at our dances is a result of the dance itself, or a result of high concentration of engineers in the Boston area. 3 My Hypothesis I believe the percentage of engineers at a swing dance is significantly greater than the percentage engineers in the general populace
- 4. I know Boston has a lot of engineers, but I personally think that there is something about swing dancing that attracts them. If my hypothesis is valid, then I will be able to consider “why” they are attracted to swing. 4 The Variables Whether or not a person is an engineer Whether or not a person is a swing dancer The analysis really only requires one variable, whether or not a person is an engineer; however, whether or not a person is a swing dancer is a significant part of reaching a conclusion. 5 Population The population surveyed is active lindy hoppers in the Boston area Data for the general population is provided utilizing online sources
- 5. It should be noted that there are many forms of swing dance, and I have chosen to just focus on one type, Lindy Hop, due to knowing the scene well and being able to make all of the major dances. Research was done ahead of time to make sure general population statistics were available online 6 Data Collection Lindy hop data Data collected over one week at the three major swing dances in the area Most of the dancers at each dance were surveyed The survey asked for information about where the participant lived, what they did for work, as well as some other questions related to years dancing, education, and gender Population of the area data Data collected using a Census search tool that can be found at http://factfinder2.census.gov/faces/nav/jsf/pages/index.xhtml Based off 2012 census data Most of the dancers refers to me going to everybody I could get to at each dance. I first asked permission, then made sure I had not already spoken to them. I would venture that I was able to get to 80%+ people at the first dance, and 95%+ people at the second two dances. I also asked some other questions that were unrelated to this project in hopes that I could garner some other statistical data that might be helpful to know. 7
- 6. Possible Bias Not everybody was surveyed at the dances I only was able to survey people at the dances, missing people who were not there that week Only one type of swing dance was covered Census data was from 2012 (the most current available) I could not come up with a way to do a random sample while surveying at the dance, so I decided to go after the whole population. This lead to some convenience bias’ (mentioned above). The census data not being current is a form of measurement bias that was impossible to avoid. 8 Organizing the Data The survey initially yielded 230 data points, but the places where the candidates lived were all over the place. I chose to work with the top seven locations of participants: Arlington, Boston, Brookline, Cambridge, Medford, Newton, and Somerville. This narrowed my data points down to 135, and made it possible for me to gather necessary data from the US census website.
- 7. If I had wanted to use all of the locations (including international), I would have had to gather population statistics for each of the places listed in response to the survey. Due to the fact that the study is meant to compare a local swing population to it’s general population, I decided to only use the places that had representation of 4 or more participants. It just so happens that the places used account for a good portion of the major cities in metro Boston. This does add a caveat to my results, however, since this is now a test for these cities rather than all of the Boston area. 9 Testing the Hypothesis The null Hypothesis (H0) is that the outcomes of the sample group (the swing dancers) will be relative to that of the general population (census statistics) The alternative Hypothesis (HA) is that the outcomes of the sample group (the swing dancers) will be significantly different from that of the general population (census statistics) A Goodness-of-fit Chi-square test will be used to analyze the data The level of significance will be: alpha = 0.5% Due to this not having multiple variables to work with, it is impossible for me to do a Chi-square test hypothesis test for independence. I did some research and came across a goodness- of-fit chi-square test that works with my data. I considered forcing the test for independence, but realized that it just was not a good fit.
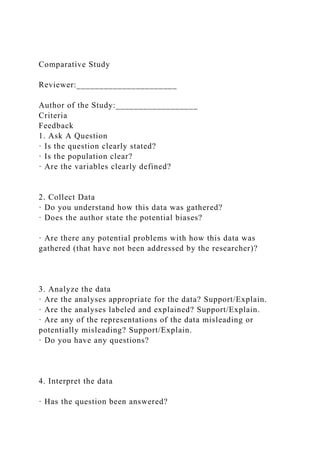
- 8. 10 Initial Analysis – Bar Graph Once I had my data, I used the occupation categorization that the US Census utilizes to assign the participants into an occupation group. This graph is a comparison of the swing populations job distribution compared to the general populations job distribution. 1300-1560 is the comparison most related to this study as it includes all engineering job-types. The bar graph shows a large difference between the two populations. 11 Goodness-of-fit Chi-Square Test The p-value is less 0.05%, therefore we can reject H0 and accept HA
- 9. 12 Results Based on the bar graph, we can see that the percentage of engineers at a swing dance is far greater than the percentage of engineers in the general population of the cities used in this test. Combined with the significant results from the Goodness-of-Fit Chi-Square test, we can say that my hypothesis is correct: The percentage of engineers at a swing dance is significantly greater than the percentage engineers in the general populace! The statistics are in! We are correct! 13 Reflection Positive experiences Discovering an alternate test for my analysis was a huge relief The conversations I was able to have with curious participants were wonderful. Most of them are very curious to learn about my results Negative experiences Realizing that the chi-square test for independent variables did not apply! Parsing the census data Surprises! Additional data provided very interesting information: like19/20 of the engineers in my sample were male Most of the engineers only have a bachelors, yet I assume they make twice as much as me
- 10. I really enjoyed doing this project. The topic has come up so often between myself and my friends, and now I can say that it is indeed true, engineers are attracted to swing dancing. There were some tough parts of putting this together, but I learned a lot. 14 Moving Forward I wish I could conduct this study in multiple cities to find out if the results are similar. Now I know there is a statistical significance in the amount of engineers, but that does not explain why. I think a proper study would also cover the other forms of swing dance. I am definitely going to analyze the data for other results as well that will be useful to the swing scene (How many newcomers in a week? How educated are swing dancers? What is the average amount of time a person has been a swing dancer?) It is a pity that I can only collect this data for Boston. I am so curious to find out if it is a product of our city (we do a lot of recruiting at MIT), or if this is world-wide (dancers from other
- 11. scenes say they have tons of engineers). If the results in other cities are similar, then maybe I can start theorizing about why engineers are attracted to the dance (maybe because it has a formula… who knows?). I also look forward to providing information to the leaders of the swing scene about years people have danced and other interesting facts. 15 Students / Unemployed / Unable to categorize:0000 Management Occupations:0010-0430 Business and Financial Operations Occupations:0500-0950 Computer and mathematical occupations:1000-1240 Architecture and Engineering Occupations:1300-1560 Life, Physical, and Social Science Occupations:1600-1965 Community and Social Service Occupations:2000-2060 Legal Occupations:2100-2160 Education, Training, and Library Occupations:2200-2550 Arts, Design, Entertainment, Sports, and Media Occupations:2600-2960 Healthcare Practitioners and Technical Occupations:3000-3540 Healthcare Support Occupations:3600-3655 Protective Service Occupations:3700-3955 Food Preparation and Serving Related Occupations:4000-4160 Building and Grounds Cleaning and Maintenance Occupations:4200-4250 Personal Care and Service Occupations:4300-4650 Sales and Related Occupations:4700-4965 Office and Administrative Support Occupations:5000-5940 Farming, Fishing, and Forestry Occupations:6005-6130 Construction and Extraction Occupations:6200-6940 Installation, Maintenance, and Repair Occupations:7000-7630 Production Occupations:7700-8965 Transportation Occupations:9000-9420 Material Moving Occupations:9500-9750 Observed survey
- 12. outcomes Probability of Expected outcome (based off of census statistics) Expected responses(obs-exp)2 / exp Yes200.0131.755189.6752279 No1150.987133.2452.498255282 Sum1351135192.1734832 p Value:7.382 x 10^-4 Are you a swing dancer? Sheet225Andover1Andover1108Andover2Andover236Arlington 1Arlington150Arlington2Arlington291Arlington3Arlington3125 Arlington4Arlington4126Arlington5Arlington5128Arlington6Ar lington6186Arlington7Arlington7212Arlington8Arlington8216A rlington9Arlington9218Arlington10Arlington1010192Barringto n, NH1Barrington, NH152Berlin, Int1Berlin, Int134Berlin, MA1Berlin, MA1167Beverly1Beverly1160Billerica1Billerica12Boston1Bost on116Boston2Boston221Boston3Boston353Boston4Boston458B oston5Boston571Boston6Boston681Boston7Boston783Boston8B oston8112Boston9Boston9113Boston10Boston10130Boston11B oston11131Boston12Boston12136Boston13Boston13137Boston1 4Boston14155Boston15Boston15158Boston16Boston16159Bost on17Boston17217Boston18Boston18208Allston1Boston, Allston1932Brighton1Boston, Brighton2033Brighton2Boston, Brighton21138Brighton3Boston, Brighton2248Dorchester1Boston, Dorchester2361Dorchester2Boston, Dorchester24203Dorchester3Boston, Dorchester25183East BostonBoston, East Boston2624Jamaica PlainsBoston, JP2756Jamaica PlainsBoston, JP28133Jamaica PlainsBoston, JP29185Jamaica PlainsBoston, JP30214Jamaica PlainsBoston, JP31219Jamaica PlainsBoston,
- 13. JP323213Brookline1Brookline131Brookline2Brookline2101Bro okline3Brookline3118Brookline4Brookline4150Brookline5Broo kline5151Brookline6Brookline6152Brookline7Brookline7746Br ussels, int1Brussels, int18Cambridge1Cambridge111Cambridge2Cambridge214Camb ridge3Cambridge317Cambridge4Cambridge422Cambridge5Cam bridge537Cambridge6Cambridge638Cambridge7Cambridge742 Cambridge8Cambridge844Cambridge9Cambridge954Cambridge 10Cambridge1060Cambridge11Cambridge1169Cambridge12Ca mbridge1277Cambridge13Cambridge1382Cambridge14Cambrid ge1485Cambridge15Cambridge1599Cambridge16Cambridge161 00Cambridge17Cambridge17104Cambridge18Cambridge18114C ambridge19Cambridge19117Cambridge20Cambridge20121Camb ridge21Cambridge21127Cambridge22Cambridge22129Cambridg e23Cambridge23156Cambridge24Cambridge24157Cambridge25 Cambridge25161Cambridge26Cambridge26162Cambridge27Ca mbridge27174Cambridge28Cambridge28176Cambridge29Cambr idge29198Cambridge30Cambridge30199Cambridge31Cambridg e31204Cambridge32Cambridge32209Cambridge33Cambridge33 215Cambridge34Cambridge34221Cambridge35Cambridge35222 Cambridge36Cambridge36226Cambridge37Cambridge37232Ca mbridge38Cambridge3838115Chelmsford1Chelmsford157Chels ea1Chelsea1211Concord1Concord164Dedham1Dedham1102Dra cut1Dracut15Durham, NH1Durham, NH1220East Lansing, MichiganEast Lansing, Michigan159East TempletonEast Templeton1179EverettEverett1194FoxboroFoxboro1165Framing hamFramingham1173FraminghamFramingham2195FranklinFran klin1196FranklinFranklin2107GermanyGermany1154Glastonbur y, CTGlastonbury, CT128Greenville, SCGreenville, SC119HoldenHolden1223HollistonHolliston1166HudsonHudson 1103Hyde ParkHyde Park1134IpswichIpswich1210LexingtonLexington1224Little Rock, AKLittle Rock, AK112LowellLowell123LynneLynne147Lyol, intLyol, int149MaldenMalden1122MaldenMalden2123MaldenMalden318 9MaldenMalden415Manchester, NHManchester,
- 14. NH1139MansfieldMansfield1140MansfieldMansfield2201Mansf ieldMansfield370MarbleheadMarblehead1197MarbleheadMarble head268MarshfieldMarshfield184MedfordMedford195Medford Medford296MedfordMedford3170MedfordMedford4180Medford Medford5190MedfordMedford6191MedfordMedford7200Medfor dMedford88187MelroseMelrose1205MelroseMelrose2231Melro seMelrose3184MiddleboroughMiddleborough1168MiddletonMid dleton1169MiddletonMiddleton2225Minneapolis, MNMinneapolis, MN17NashuaNashua197NashuaNashua240NeedhamNeedham14 1NeedhamNeedham2172New Morken, NHNew Morken, NH198NewburyportNewburyport1111Newcaslte, MENewcaslte, ME118NewtonNewton130NewtonNewton245NewtonNewton393 NewtonNewton494NewtonNewton5141NewtonNewton6142Newt onNewton7164NewtonNewton8175NewtonNewton9202Newton Newton10206NewtonNewton111129North Kingstown, RINorth Kingstown, RI143North ReadingNorth Reading1177NorthboroNorthboro1178NorthboroNorthboro2193 NortonNorton16Pawtucket, RIPawtucket, RI1188PeabodyPeabody1116PhiladelphiaPhiladelphia1135Ports mouth, NHPortsmouth, NH163ProvidenceProvidence186Providence, RIProvidence, RI2229QuincyQuincy155RevereRevere1149San Antonio. TXSan Antonio. TX166ScituateScituate167ScituateScituate21SomervilleSomervi lle13SomervilleSomerville24SomervilleSomerville327Somervill eSomerville435SomervilleSomerville539SomervilleSomerville6 51SomervilleSomerville765SomervilleSomerville873Somerville Somerville974SomervilleSomerville1075SomervilleSomerville1 178SomervilleSomerville1279SomervilleSomerville1380Somerv illeSomerville1487SomervilleSomerville1589SomervilleSomerv ille1692SomervilleSomerville17109SomervilleSomerville18110 SomervilleSomerville19119SomervilleSomerville20120Somervil leSomerville21143SomervilleSomerville22153SomervilleSomer ville23171SomervilleSomerville24181SomervilleSomerville252 07SomervilleSomerville26213SomervilleSomerville27228Somer
- 16. 55 30 24 11 13 7 8 9 6 5 12 3 4 3 4 11 4 1 1 2 1 DataData #How long have you been a swing dancer?Where do you currently live?What do you do for work?What was your highest level of education?If still a student, what are you studying?What gender do you identify with?sheet2081AllstonSoftware EngineerMastersM11251.5AndoverInterior DesignSome CollegeF21081AndoverTeacherMastersF6364ArlingtonDefense Contractor / AerospaceBachelorsScienceM2502ArlingtonStudentHSUndecide dF3917ArlingtonSpeech Language PathologistMastersF512515ArlingtonSoftware EngineerMastersM71262.5ArlingtonProgram Coordinator / Non- profitBachelorsF712812ArlingtonSoftware EngineerBachelorsM71866ArlingtonUnemployedBachelorsSoft ware EngineerM1021216ArlingtonSoftware EngineerMastersM1121615ArlingtonProfessor / TeacherPHDM1221816ArlingtonManagement / Education Content / BusinessMastersF121926Barrington, NHTeacher / UNH BiochemPHDM10522Berlin, IntDesign Historian / HumanitiesPHDF33415Berlin, MAChemical EngineerBachelorsF21672.5BeverlyITSome GraduateM91607BillericaElectrical EngineerBachelorsM926BostonAccountantBachelorsM11615Bos tonBallroom DancerBachelorsM1212BostonTeacher / StudentOn BachelorsPrintmakingF2539BostonEducator / GuidanceOn DoctorateM35811BostonResearch AnalystBachelorsM3714BostonStudentOn PHDChemistryM4813BostonComputer Science / ResearcherPHDF5832BostonMechanical EngineerPHDM51121BostonStudentOn BachelorsBusinessF61138BostonStudentOn BachelorsMaterial ScienceM61301BostonSoftware EngineerBachelorsM71311.5BostonOffice ManagerBachelorsF71360BostonIndustrial Engineer / Systems
- 17. EngineerMastersM71370BostonEconomistBachelorsF71551Bost onBusiness AnalystMastersF81581BostonStudentOn PHDMechanical EngineerM81590BostonStudentOn PHDComp SciF81721713BostonEducation / Instructional designerMastersF121054Boston suburbTeacherBachelorsM6320BrightonStudentOn DoctorateBiologyF2330BrightonStudentOn DoctorateBiologyF21385BrightonStudentOn PHDBiomedical EngineerF7138BrooklineMDMDF1310BrooklineBiologistBachel orsF21011BrooklineMDMDM61181BrooklineOphthalmic Technician / HealthcareBachelorsF71500BrooklineNurseBachelorsM81510.2 5BrooklineNon-profit / History / MuseumBachelorsF81521.5BrooklineLegal ScienceBachelorsM84610Brussels, intMedia Producer / Education DesignerMastersF3815CambridgeMechanical EngineerMastersF1118CambridgeFinancial ConsultantBachelorsM1144CambridgeSoftware DeveloperBachelorsM1175CambridgeHuman Resources / FinanceBachelorsF12212CambridgeStudentOn PHDEconomicsM2373CambridgeSoftware DeveloperMastersM2381CambridgeBiologistPHDF2423Cambrid geProcess Engineer / Chemical EngineerBachelorsM3441.5CambridgeCommunicationsMastersF 35410CambridgeComputer EngineerPHDM3608CambridgeComputer SciencePHDM4690CambridgeStudentIn HSWants to study philosophyM4772CambridgeSoftware EngineerMastersM4823CambridgeComputer SciencePHDM58515CambridgeMD / Medecine / ResearchPHDF5991CambridgeUnemployedBachelorsFine ArtF61000CambridgeData AnalystBachelorsF61040CambridgeStudentOn PHDPhysicsM61140CambridgeStudentOn BachelorsElectrical Engineer / Comp SciM611710CambridgeScientistPHDM61211CambridgeOwner
- 18. Bed and BreakfastBachelorsF712725CambridgePsychologistPHDM71295 CambridgeRetiredMastersF715610CambridgeEngineer / Environmental ConsultantMastersM815714CambridgeGovernmentBachelorsF81 610.5CambridgeCommunications / Non- profitBachelorsF91624CambridgeSoftware Engineer / Tech Project ManagerMastersM91741CambridgeChemistBachelorsM917611C ambridgePsychotherapistPHDF91980CambridgeStudentOn MastersPublic PolicyF101990CambridgeStudentOn MastersPublic PolicyM102045CambridgeHR coordinatorBachelorsF1120913CambridgeProduct ManagerPHDF112154CambridgeResearch AssistantBachelorspsych econM112214CambridgeProgrammerBachelorsM122222Cambri dgePublic Relations / Account ExecutiveBachelorsF122260.0833333333CambridgeProperty ManagementMastersF122324CambridgeStudentOn MastersNursingF121152ChelmsfordStudentOn BachelorsElectrical EngineerM65713ChelseaTeacher / Set DesignerMastersM32111ConcordSoftware ArchitecturePHDM11640DedhamStudentHSUndecidedM4483Do rchesterMissionaryBachelorsF3617DorchesterAdmin AssntOn BachelorsF42032DorchesterMIT / Grant WriterBachelorsF111020DracutStudentOn BachelorsEconomicsM650.5Durham, NHProgrammerBachelorsM11832East BostonLogistics / Air Imports / Tour GuideBachelorsF102202East Lansing, MichiganStudentOn PHDHuman development & fanily studiesF125911East TempletonAccountantHSF41790EverettBank / OperationsHSF91941FoxboroEntertainment / 5-witsSome CollegeF101659FraminghamMechanical EngineerBachelorsM91737FraminghamStudentOn MastersMasters in IS / MBAM91950FranklinEntertainment / 5-
- 19. witsAssociatesM101960FranklinEntertainment / 5-witsSome CollegeF101071GermanyWeb StartupMastersM615410Glastonbury, CTMDMDM8287Greenville, SCABA Therapist / SPEDBachelorsF21915HoldenPublic Access TV ManagerBachelorsM22237HollistonSoftware EngineerPHDM121664HudsonParamedicBachelorsM91032Hyde ParkMDMDM61342.5IpswichBiotechBachelorsF7244Jamaica PlainsTeacherMastersF2562Jamaica PlainsDJBachelorsM31330Jamaica PlainsResearcherMastersF71851.5Jamaica PlainsAdminAssociatesF102142Jamaica PlainsLawyerJuris DoctorateM112190.5Jamaica PlainsStatisticianPHDF122101LexingtonMassage TherapistBachelorsM112242Little Rock, AKStage Manager / TheaterBachelorsF121210LowellMechanical Engineer / DesignHSM1237LynneSales / Fundraising ConsultantBachelorsF2473Lyol, intStudentOn MastersComputer ScienceM3490.1666666667MaldenStudentIn HSWants to be Linguistics / pre-lawGender Flux31229MaldenProcess EngineerBachelorsF712319MaldenSofware EngineerMastersM718916MaldenElectrical EngineerMastersM10150Manchester, NHMarketingBachelorsF11390.0833333333MansfieldStudent / Day campOn BachelorsElectronic EngineerF81400.0833333333MansfieldIndoor PlaygroundOn MastersPsychologyF82010MansfieldPetsmartHSF11701Marbleh eadStudentHSUndecidedF41970.25MarbleheadTeacherMastersF 10680.5MarshfieldStudentOn BachelorsMath / Computer ScienceF4841.5MedfordAerospace EngineerPHDM59513MedfordStudentOn MastersPTF5964MedfordUnemployedSome CollegeF51705MedfordIBM / Software DeveloperBachelorsM91801MedfordSPEDMastersF91900Medfo rdArchitectMastersM101910MedfordStay at home MomBachelorsF102000MedfordPastorMastersM101874Melrose
- 20. ProgrammingBachelorsM102053MelroseStudentOn BachelorsSLPM112314MelroseSoftware EngineerBachelorsM121843MiddleboroughPsychotherapistMast ersF101680.3333333333MiddletonArtistSome GraduateF91690.3333333333MiddletonCollectible Cards / CollectiblesSome CollegeM92255.5Minneapolis, MNProduct Design / ArtBachelorsF1272NashuaNurseAssociatesF19716NashuaNetwo rk Engineer / Info SecurityBachelorsM5405NeedhamStudentOn BachelorsPhilosophy / Politics / EconomicsM3410.25NeedhamStudentOn BachelorsEngineering / Computer ScienceF31726New Morken, NHTutorBachelorsM9981NewburyportPiano TechnicianMastersM61117Newcaslte, MEStudentOn BachelorsMechanical EngineerM61815NewtonRadio AnnouncerBachelorsM2307NewtonScientist / BiologyPHDF2451NewtonStudentOn BachelorsNeuroscienceF3930NewtonStudentHSUndecidedF5940 NewtonStudentHSWants to study PsychM51410NewtonStudentOn BachelorsNeurological BioligyF81420NewtonPizza DeliveryOn BachelorsSpanishF81640NewtonStudentOn BachelorsInternational RelationsF917516NewtonWriterMastersF92020NewtonStudentH SUnknownF112062NewtonStudentHSUndecidedM11292North Kingstown, RIStudentOn MastersAutomotive EngineeringM2431North ReadingSoftware EngineerBachelorsM317714NorthboroLibrarianMastersF917820 NorthboroElectrical EngineerBachelorsM91931NortonEntertainment / 5-witsSome CollegeF1061.66666Pawtucket, RIMechanical EngineerMastersM11880.6666666667PeabodyHS aide / EducationBachelorsF101164PhiladelphiaStudentOn BachelorsEngineeringM613510Portsmouth, NHMechanical EngineeringBachelorsM76312ProvidenceTeacherOn MastersM4866Providence, RIStudentOn
- 21. BachelorsUndecidedF522918QuincySoftware EngineerBachelorsM12555RevereHospitalitySome CollegeM31490San Antonio. TXDog SittingBachelorsEnvironmental ScienceF8660ScituateStudentOn BachelorsEducationF4670ScituateStudentOn BachelorsEducationF4114SomervilleTherapistPHDF134Somervi lleSoftware EngineerBachelorsM142SomervilleNetwork EngineerBachelorsM1273SomervilleTeacherMastersF2357Some rvilleStub Hub ??? (page 2)BachelorsF2392SomervilleStudentIn HSConsidering Cognitive ScienceF3514SomervilleStarbucksBachelorsM3651SomervilleSt udentHSWants to study Comp SciM47310SomervilleStudentOn MastersTheologyF4742.5SomervilleAdmin at UniversityMastersF4756SomervilleITBachelorsM4781Somervill eData AnalystBachelorsF4792.5SomervilleNetwork Performance Analyst / EducationBachelorsF5806SomervilleWeb DeveloperOn MastersF5876SomervilleRestaurantBachelorsF58914Somerville Analyst / Marketing ResearchMastersM5922.5SomervilleIOS / Software EngineerBachelorsM51090.0833333333SomervilleSocial Media / Suicide PreventionBachelorsF61100.0833333333SomervilleStudentOn PHDPolitical ScienceM61190SomervilleNurseMastersF71200SomervilleMusi cianBachelorsM714315SomervilleGroup Coordinator / SalesBachelorsM815315SomervilleEditorBachelorsF81718Some rvilleFilm DistributionBachelorsF91810SomervilleBio PhysicistPHDM1020718SomervilleSoftware EngineerMastersM112139SomervilleEngineer / Self EmployedBachelorsM112285SomervilleContract Software DeveloperBachelorsM122307SomervilleTeacherMastersF12722 Stanford, CAStudentOn BachelorsApplied MathF416320StonehamAttorneyJuris DoctorateF910610TewksburySpeech Language PathologistMastersF612410TewksburyMechanical
- 22. EngineerSome Graduatef7760UKStudentOn BachelorsComputer Science / PhilosophyM4903WakefieldEngineerMastersM51015WalthamSo ftware Design / ConsultantBachelorsF113215WalthamRegional Non-profit / Organ BankBachelorsF71470WalthamPresident Marketing / CommunicationsBachelorsM822717WalthamDesign Verification EngineerSome GraduateM12629WatertownManufacturing / Life Sciences testing / Customer ServiceSome CollegeF41450.5WatertownHealthcare / Project ManagerBachelorsF81480WellesleyRetailerBachelorsM818212 WellesleyAcademics / Japanese lit & language / humanitiesPHDF101460WestonWholesaleBachelorsF814410Wi nthropPurchasing Agent / BusinessBachelorsM8888WoburnElectrical EngineerBachelorsM593WorcesterStudentOn Masters??? (page 1)F1202WorcesterBartender / StudentOn BachelorsCommunicationF22610WorcesterRetiredPHD / 2 Post DocsPhysioligyM2 EducationData #What was your highest level of education?195Associates1185Associates27Associates336Bachel ors1126Bachelors2128Bachelors3186Bachelors434Bachelors516 0Bachelors62Bachelors716Bachelors858Bachelors9130Bachelor s10131Bachelors11137Bachelors12105Bachelors1331Bachelors 14118Bachelors15150Bachelors16151Bachelors17152Bachelors 1811Bachelors1914Bachelors2017Bachelors2142Bachelors2299 Bachelors23100Bachelors24121Bachelors25157Bachelors26161 Bachelors27174Bachelors28204Bachelors29215Bachelors3048B achelors31203Bachelors325Bachelors33183Bachelors34165Bac helors3528Bachelors3619Bachelors37166Bachelors38134Bachel ors3956Bachelors40210Bachelors4123Bachelors42122Bachelors 4315Bachelors44170Bachelors45191Bachelors46187Bachelors4 797Bachelors48172Bachelors4918Bachelors5043Bachelors5117 8Bachelors52188Bachelors53135Bachelors54149Bachelors553B achelors564Bachelors5735Bachelors5851Bachelors5975Bachelo rs6078Bachelors6179Bachelors6287Bachelors6392Bachelors641
- 23. 09Bachelors65120Bachelors66143Bachelors67153Bachelors681 71Bachelors69213Bachelors7010Bachelors71132Bachelors7214 7Bachelors73145Bachelors74148Bachelors75146Bachelors7614 4Bachelors7788Bachelors7850HS164HS259HS3179HS412HS52 01HS670HS793HS894HS9202HS10206HS1165HS1269In HS149In HS239In HS3214Juris Doctorate1163Juris Doctorate2208Masters1108Masters291Masters3125Masters4212 Masters5136Masters6155Masters746Masters88Masters937Maste rs1044Masters1177Masters12129Masters13156Masters14162Ma sters1557Masters16107Masters1724Masters18133Masters19123 Masters20189Masters21197Masters22180Masters23190Masters2 4200Masters25184Masters2698Masters27175Masters28177Mast ers296Masters3027Masters3174Masters3289Masters33119Maste rs34207Masters35106Masters3690Masters3713MD1101MD2154 MD3103MD421On Bachelors1112On Bachelors2113On Bachelors3114On Bachelors4115On Bachelors561On Bachelors6102On Bachelors7139On Bachelors868On Bachelors9205On Bachelors1040On Bachelors1141On Bachelors12111On Bachelors1345On Bachelors14141On Bachelors15142On Bachelors16164On Bachelors17116On Bachelors1886On Bachelors1966On Bachelors2067On Bachelors2172On Bachelors2276On Bachelors2320On Bachelors2453On Doctorate132On Doctorate233On Doctorate3198On Masters1199On Masters2173On Masters347On Masters4140On Masters595On Masters629On Masters763On Masters873On Masters980On Masters109On Masters1171On PHD1158On PHD2159On PHD3138On PHD422On PHD5104On PHD6110On PHD7192PHD152PHD281PHD383PHD438PHD554PHD660PHD 782PHD885PHD9117PHD10127PHD11176PHD12209PHD1321 1PHD1484PHD1530PHD161PHD17181PHD18182PHD1926PH D / 2 Post Docs2025Some College1194Some College2196Some College396Some College4169Some College5193Some College655Some College762Some College8167Some Graduate1168Some Graduate2124Some Graduate3 Concise data26BostonAccountantBachelorsM11851.5Jamaica
- 24. PlainsAdminAssociatesF10617DorchesterAdmin AssntOn BachelorsF4742.5SomervilleAdmin at UniversityMastersF4841.5MedfordAerospace EngineerPHDM518914SomervilleAnalyst / Marketing ResearchMastersM51900MedfordArchitectMastersM101615Bost onBallroom DancerBachelorsM11810SomervilleBio PhysicistPHDM10310BrooklineBiologistBachelorsF2381Cambri dgeBiologistPHDF21551BostonBusiness AnalystMastersF81741CambridgeChemistBachelorsM9441.5Ca mbridgeCommunicationsMastersF31610.5CambridgeCommunica tions / Non-profitBachelorsF95410CambridgeComputer EngineerPHDM31608CambridgeComputer SciencePHDM4823CambridgeComputer SciencePHDM5813BostonComputer Science / ResearcherPHDF52285SomervilleContract Software DeveloperBachelorsM121000CambridgeData AnalystBachelorsF6781SomervilleData AnalystBachelorsF4364ArlingtonDefense Contractor / AerospaceBachelorsScienceM2562Jamaica PlainsDJBachelorsM31370BostonEconomistBachelorsF715315S omervilleEditorBachelorsF821713BostonEducation / Instructional designerMastersF12539BostonEducator / GuidanceOn DoctorateM315610CambridgeEngineer / Environmental ConsultantMastersM812139SomervilleEngineer / Self EmployedBachelorsM1111718SomervilleFilm DistributionBachelorsF9118CambridgeFinancial ConsultantBachelorsM115714CambridgeGovernmentBachelorsF 814315SomervilleGroup Coordinator / SalesBachelorsM82045CambridgeHR coordinatorBachelorsF11175CambridgeHuman Resources / FinanceBachelorsF11705MedfordIBM / Software DeveloperBachelorsM91360BostonIndustrial Engineer / Systems EngineerMastersM71922.5SomervilleIOS / Software EngineerBachelorsM51756SomervilleITBachelorsM42142Jamai ca PlainsLawyerJuris DoctorateM111521.5BrooklineLegal ScienceBachelorsM81832East BostonLogistics / Air Imports /
- 25. Tour GuideBachelorsF1021816ArlingtonManagement / Education Content / BusinessMastersF12138BrooklineMDMDF11011BrooklineMDM DM68515CambridgeMD / Medecine / ResearchPHDF5832BostonMechanical EngineerPHDM51815CambridgeMechanical EngineerMastersF11483DorchesterMissionaryBachelorsF32032 DorchesterMIT / Grant WriterBachelorsF111200SomervilleMusicianBachelorsM742So mervilleNetwork EngineerBachelorsM11792.5SomervilleNetwork Performance Analyst / EducationBachelorsF51510.25BrooklineNon-profit / History / MuseumBachelorsF81500BrooklineNurseBachelorsM81190Som ervilleNurseMastersF71311.5BostonOffice ManagerBachelorsF71181BrooklineOphthalmic Technician / HealthcareBachelorsF71211CambridgeOwner Bed and BreakfastBachelorsF72000MedfordPastorMastersM101420Newt onPizza DeliveryOn BachelorsSpanishF8423CambridgeProcess Engineer / Chemical EngineerBachelorsM3120913CambridgeProduct ManagerPHDF1121615ArlingtonProfessor / TeacherPHDM121262.5ArlingtonProgram Coordinator / Non- profitBachelorsF72214CambridgeProgrammerBachelorsM12226 0.0833333333CambridgeProperty ManagementMastersF1212725CambridgePsychologistPHDM717 611CambridgePsychotherapistPHDF92222CambridgePublic Relations / Account ExecutiveBachelorsF121815NewtonRadio AnnouncerBachelorsM25811BostonResearch AnalystBachelorsM32154CambridgeResearch AssistantBachelorspsych econM111330Jamaica PlainsResearcherMastersF7876SomervilleRestaurantBachelorsF 51295CambridgeRetiredMastersF711710CambridgeScientistPH DM6307NewtonScientist / BiologyPHDF21090.0833333333SomervilleSocial Media / Suicide PreventionBachelorsF6144CambridgeSoftware
- 26. DeveloperBachelorsM1373CambridgeSoftware DeveloperMastersM22081AllstonSoftware EngineerMastersM11112515ArlingtonSoftware EngineerMastersM7112812ArlingtonSoftware EngineerBachelorsM7121216ArlingtonSoftware EngineerMastersM1111301BostonSoftware EngineerBachelorsM71772CambridgeSoftware EngineerMastersM4134SomervilleSoftware EngineerBachelorsM1120718SomervilleSoftware EngineerMastersM1111624CambridgeSoftware Engineer / Tech Project ManagerMastersM911801MedfordSPEDMastersF9917Arlington Speech Language PathologistMastersF5514SomervilleStarbucksBachelorsM32190. 5Jamaica PlainsStatisticianPHDF121910MedfordStay at home MomBachelorsF10357SomervilleStub Hub ??? (page 2)BachelorsF2502ArlingtonStudentHSUndecidedF3714BostonSt udentOn PHDChemistryM41121BostonStudentOn BachelorsBusinessF61138BostonStudentOn BachelorsMaterial ScienceM61581BostonStudentOn PHDMechanical EngineerM811590BostonStudentOn PHDComp SciF812212CambridgeStudentOn PHDEconomicsM2690CambridgeStudentIn HSWants to study philosophyM41040CambridgeStudentOn PHDPhysicsM61140CambridgeStudentOn BachelorsElectrical Engineer / Comp SciM611980CambridgeStudentOn MastersPublic PolicyF101990CambridgeStudentOn MastersPublic PolicyM102324CambridgeStudentOn MastersNursingF129513MedfordStudentOn MastersPTF5451NewtonStudentOn BachelorsNeuroscienceF3930NewtonStudentHSUndecidedF5940 NewtonStudentHSWants to study PsychM51410NewtonStudentOn BachelorsNeurological BioligyF81640NewtonStudentOn BachelorsInternational RelationsF92020NewtonStudentHSUnknownF112062NewtonStu dentHSUndecidedM11392SomervilleStudentIn HSConsidering
- 27. Cognitive ScienceF3651SomervilleStudentHSWants to study Comp SciM47310SomervilleStudentOn MastersTheologyF41100.0833333333SomervilleStudentOn PHDPolitical ScienceM6320BrightonStudentOn DoctorateBiologyF2330BrightonStudentOn DoctorateBiologyF21385BrightonStudentOn PHDBiomedical EngineerF71244Jamaica PlainsTeacherMastersF2273SomervilleTeacherMastersF22307So mervilleTeacherMastersF12212BostonTeacher / StudentOn BachelorsPrintmakingF2114SomervilleTherapistPHDF11866Arl ingtonUnemployedBachelorsSoftware EngineerM10991CambridgeUnemployedBachelorsFine ArtF6964MedfordUnemployedSome CollegeF5806SomervilleWeb DeveloperOn MastersF517516NewtonWriterMastersF9230.1703703704 Engineers in popArlingtonComputer, engineering, and science occupations:4,068+/-44469.10%+/-4.830.90%+/-4.892,672+/- 4,19697,170+/-5,45177,668+/-10,672Computer and mathematical occupations1,985+/-30774.50%+/-5.925.50%+/- 5.997,837+/-6,361103,939+/-9,28591,344+/-12,974Architecture and engineering occupations904+/-21074.40%+/-11.025.60%+/- 11.087,160+/-12,41395,890+/-4,66783,464+/-24,485Life, physical, and social science occupations1,179+/-24255.80%+/- 10.844.20%+/-10.874,519+/-14,51089,487+/-19,46659,293+/- 15,762BostonComputer, engineering, and science occupations:24,202+/-1,19865.40%+/-2.034.60%+/- 2.057,767+/-3,00863,455+/-2,40850,520+/-2,201Computer and mathematical occupations10,856+/-85572.10%+/-2.927.90%+/- 2.968,416+/-3,27473,614+/-3,44659,130+/-5,784Architecture and engineering occupations4,598+/-45179.00%+/-4.221.00%+/- 4.264,892+/-4,14368,043+/-5,75849,878+/-15,232Life, physical, and social science occupations8,748+/-77850.00%+/- 3.550.00%+/-3.545,369+/-1,89944,211+/-3,24445,987+/- 1,810BrooklineComputer, engineering, and science occupations:5,136+/-45455.50%+/-5.144.50%+/-5.163,548+/- 9,58672,388+/-9,45958,701+/-3,396Computer and mathematical
- 28. occupations1,789+/-35861.30%+/-9.538.70%+/-9.569,819+/- 8,88773,914+/-21,44362,870+/-13,353Architecture and engineering occupations671+/-19679.70%+/-9.820.30%+/- 9.886,635+/-19,24481,164+/-26,18091,964+/-10,040Life, physical, and social science occupations2,676+/-30245.50%+/- 6.454.50%+/-6.454,934+/-9,07761,719+/-21,00851,119+/- 6,488CambridgeComputer, engineering, and science occupations:11,380+/-69464.00%+/-2.836.00%+/-2.859,710+/- 2,44064,819+/-3,82150,581+/-3,463Computer and mathematical occupations3,769+/-41580.20%+/-4.619.80%+/-4.677,422+/- 7,69278,333+/-7,82175,650+/-20,056Architecture and engineering occupations1,892+/-30567.30%+/-7.632.70%+/- 7.667,702+/-7,75774,468+/-7,97254,297+/-11,735Life, physical, and social science occupations5,719+/-52452.30%+/- 3.647.70%+/-3.648,582+/-3,07050,407+/-3,90046,358+/- 5,677MedfordComputer, engineering, and science occupations:3,557+/-41873.60%+/-4.926.40%+/-4.969,662+/- 5,54074,773+/-6,20357,409+/-5,353Computer and mathematical occupations1,614+/-34483.20%+/-5.916.80%+/-5.983,284+/- 9,18684,779+/-9,82256,067+/-33,617Architecture and engineering occupations1,021+/-20584.20%+/-7.415.80%+/- 7.464,107+/-7,52365,636+/-7,64254,750+/-15,593Life, physical, and social science occupations922+/-22845.00%+/- 10.655.00%+/-10.664,337+/-8,34573,893+/-19,25158,750+/- 10,246NewtonComputer, engineering, and science occupations:6,072+/-50465.50%+/-4.134.50%+/-4.190,558+/- 3,876102,566+/-10,16478,108+/-7,793Computer and mathematical occupations2,723+/-35471.50%+/-5.228.50%+/- 5.295,060+/-6,019104,967+/-5,91884,471+/-9,226Architecture and engineering occupations1,180+/-20975.30%+/-8.324.70%+/- 8.380,588+/-14,17993,875+/-18,36151,211+/-14,743Life, physical, and social science occupations2,169+/-30252.50%+/- 6.647.50%+/-6.684,886+/-12,00892,340+/-17,75071,125+/- 19,019SomervilleComputer, engineering, and science occupations:6,371+/-63762.60%+/-4.137.40%+/-4.161,598+/- 3,91364,167+/-7,29554,611+/-5,075Computer and mathematical
- 29. occupations2,648+/-42773.80%+/-6.026.20%+/-6.073,341+/- 4,54573,635+/-6,29372,545+/-10,130Architecture and engineering occupations1,323+/-25367.30%+/-9.732.70%+/- 9.766,099+/-7,04267,976+/-9,87064,915+/-7,115Life, physical, and social science occupations2,400+/-36347.60%+/- 6.152.40%+/-6.148,438+/-4,53252,038+/-6,80446,426+/- 3,785Total Engineering jobs:11,589 calculationsIs a swing dancerObserved survey outcomesProbability of Expected outcome (based off of census statistics)Expected responses(obs-exp)2 / expTotal Population 16+:890080878491Chi-TestYesNoAre you a swing dancer?Yes200.0131.755189.6752279202Total Engineering jobs:11589Is an EngineerYes 1.3%20 (1.391)11569 (11571)No1150.987133.2452.4982552816Sample 3 size:135No 98.7%87 (105.609)878403 (878509)Sum1351135192.1734832019Engineers in Sample 3:20889945p Value:7.382 x 10^-4% engineers in populace0.013020178% engineers in swing dancing0.148148148111569.285105.609878375.71518.6090.351 -18.609- 0.351248.95390438530.00001064863.27902812260.0000001403 252.23294329682.159 x10^-50 Concise - no studentsdata #yrslocjobedgenderJob ID364ArlingtonDefense Contractor / AerospaceBachelorsScienceM0000Unknown0000815714Cambri dgeGovernmentBachelorsF0000Management, Business, Science, and Arts Occupations:0010-3540Management, Business, and Financial Occupations:0010-0950Management Occupations:0010-043081211CambridgeOwner Bed and BreakfastBachelorsF0000Business and Financial Operations Occupations:0500-095051910MedfordStay at home MomBachelorsF0000Computer, Engineering, and Science Occupations:1000-1965Computer and mathematical occupations:1000-1240357SomervilleStub Hub ??? (page 2)BachelorsF0000Architecture and Engineering Occupations:1300-
- 30. 1560151866ArlingtonUnemployedBachelorsSoftware EngineerM0000Life, Physical, and Social Science Occupations:1600- 196520991CambridgeUnemployedBachelorsFine ArtF0000Education, Legal, Community Service, Arts, and Media Occupations:2000-2960Community and Social Service Occupations:2000-20609964MedfordUnemployedSome CollegeF0000Legal Occupations:2100- 2160221816ArlingtonManagement / Education Content / BusinessMastersF0020Education, Training, and Library Occupations:2200-255031311.5BostonOffice ManagerBachelorsF0020Arts, Design, Entertainment, Sports, and Media Occupations:2600-296022222CambridgePublic Relations / Account ExecutiveBachelorsF0060Healthcare Practitioners and Technical Occupations:3000- 35409756SomervilleITBachelorsM0110Service Occupations:3600-4650Healthcare Support Occupations:3600- 365592045CambridgeHR coordinatorBachelorsF0136Protective Service Occupations:3700-3955020913CambridgeProduct ManagerPHDF0140Food Preparation and Serving Related Occupations:4000-416002260.0833333333CambridgeProperty ManagementMastersF0410Building and Grounds Cleaning and Maintenance Occupations:4200-425001262.5ArlingtonProgram Coordinator / Non-profitBachelorsF0430Personal Care and Service Occupations:4300-46503175CambridgeHuman Resources / FinanceBachelorsF0630Sales and Office Occupations:4700-5940Sales and Related Occupations:4700- 496521551BostonBusiness AnalystMastersF0710Office and Administrative Support Occupations:5000- 594018914SomervilleAnalyst / Marketing ResearchMastersM0735Natural Resources, Construction, and Maintenance Occupations:6005-7630Farming, Fishing, and Forestry Occupations:6005- 6130326BostonAccountantBachelorsM0800Construction and Extraction Occupations:6200-69400118CambridgeFinancial ConsultantBachelorsM0850Installation, Maintenance, and
- 31. Repair Occupations:7000-76300608CambridgeComputer SciencePHDM10050823CambridgeComputer SciencePHDM1005Production, Transportation, and Material Moving Occupations:7700-9750Production Occupations:7700- 89650813BostonComputer Science / ResearcherPHDF1005Transportation and Material Moving Occupations:9000-9750Transportation Occupations:9000- 942001330Jamaica PlainsResearcherMastersF1005Material Moving Occupations:9500-975001000CambridgeData AnalystBachelorsF1006Military Specific Occupations:9800- 98300781SomervilleData AnalystBachelorsF10060792.5SomervilleNetwork Performance Analyst / EducationBachelorsF1006Unemployed, with no work experience in the last 5 years or earlier or never worked992012214CambridgeProgrammerBachelorsM10102285S omervilleContract Software DeveloperBachelorsM10201705MedfordIBM / Software DeveloperBachelorsM1020144CambridgeSoftware DeveloperBachelorsM1020373CambridgeSoftware DeveloperMastersM1020806SomervilleWeb DeveloperOn MastersF10305811BostonResearch AnalystBachelorsM12202190.5Jamaica PlainsStatisticianPHDF12301900MedfordArchitectMastersM130 0841.5MedfordAerospace EngineerPHDM13201423CambridgeProcess Engineer / Chemical EngineerBachelorsM135015410CambridgeComputer EngineerPHDM1400142SomervilleNetwork EngineerBachelorsM1400115610CambridgeEngineer / Environmental ConsultantMastersM142011360BostonIndustrial Engineer / Systems EngineerMastersM14301832BostonMechanical EngineerPHDM14601815CambridgeMechanical EngineerMastersF146012139SomervilleEngineer / Self EmployedBachelorsM15301922.5SomervilleIOS / Software EngineerBachelorsM153012081AllstonSoftware EngineerMastersM1530112515ArlingtonSoftware
- 32. EngineerMastersM1530112812ArlingtonSoftware EngineerBachelorsM1530121216ArlingtonSoftware EngineerMastersM153011301BostonSoftware EngineerBachelorsM15301772CambridgeSoftware EngineerMastersM1530134SomervilleSoftware EngineerBachelorsM1530120718SomervilleSoftware EngineerMastersM153011624CambridgeSoftware Engineer / Tech Project ManagerMastersM15301310BrooklineBiologistBachelorsF16103 81CambridgeBiologistPHDF1610307NewtonScientist / BiologyPHDF16101810SomervilleBio PhysicistPHDM17001741CambridgeChemistBachelorsM172013 70BostonEconomistBachelorsF180012725CambridgePsychologi stPHDM18202154CambridgeResearch AssistantBachelorspsych econM195011710CambridgeScientistPHDM1965539BostonEduc ator / GuidanceOn DoctorateM2000483DorchesterMissionaryBachelorsF20602000 MedfordPastorMastersM20602142Jamaica PlainsLawyerJuris DoctorateM21001521.5BrooklineLegal ScienceBachelorsM216021615ArlingtonProfessor / TeacherPHDM2200244Jamaica PlainsTeacherMastersF2320273SomervilleTeacherMastersF2320 2307SomervilleTeacherMastersF2320212BostonTeacher / StudentOn BachelorsPrintmakingF23201801MedfordSPEDMastersF233015 10.25BrooklineNon-profit / History / MuseumBachelorsF240021713BostonEducation / Instructional designerMastersF25502032DorchesterMIT / Grant WriterBachelorsF25501615BostonBallroom DancerBachelorsM27401200SomervilleMusicianBachelorsM275 015315SomervilleEditorBachelorsF283017516NewtonWriterMa stersF2850441.5CambridgeCommunicationsMastersF28601610. 5CambridgeCommunications / Non- profitBachelorsF28601718SomervilleFilm DistributionBachelorsF28601090.0833333333SomervilleSocial Media / Suicide PreventionBachelorsF28601815NewtonRadio
- 33. AnnouncerBachelorsM2900138BrooklineMDMDF30601011Broo klineMDMDM30608515CambridgeMD / Medecine / ResearchPHDF3060917ArlingtonSpeech Language PathologistMastersF323017611CambridgePsychotherapistPHDF 3245114SomervilleTherapistPHDF32451500BrooklineNurseBac helorsM32551190SomervilleNurseMastersF32551181Brookline Ophthalmic Technician / HealthcareBachelorsF3540514SomervilleStarbucksBachelorsM4 0501420NewtonPizza DeliveryOn BachelorsSpanishF4060876SomervilleRestaurantBachelorsF411 0562Jamaica PlainsDJBachelorsM44301832East BostonLogistics / Air Imports / Tour GuideBachelorsF454014315SomervilleGroup Coordinator / SalesBachelorsM48401851.5Jamaica PlainsAdminAssociatesF5700617DorchesterAdmin AssntOn BachelorsF5700742.5SomervilleAdmin at UniversityMastersF57001295CambridgeRetiredMastersF992019 Pop totalsPop 16 upArlingtonTotal population42,952+/- 2820,626+/-44822,326+/-44916 years and over81.40%+/- 0.980.50%+/-1.682.30%+/-1.234962.928BostonTotal population619,662+/-63296,374+/-944323,288+/-94616 years and over85.20%+/-0.284.20%+/-0.286.00%+/- 0.2527952.024BrooklineTotal population58,634+/-4525,591+/- 74933,043+/-74716 years and over83.80%+/-1.282.20%+/- 1.785.10%+/-1.349135.292CambridgeTotal population105,026+/-4350,949+/-86354,077+/-86716 years and over89.00%+/-0.688.30%+/-0.889.60%+/- 1.093473.14MedfordTotal population56,255+/-4026,727+/- 65929,528+/-65516 years and over86.90%+/-0.885.40%+/- 1.388.20%+/-1.148885.595NewtonTotal population85,177+/- 5239,700+/-88745,477+/-89316 years and over80.70%+/- 0.679.90%+/-1.281.40%+/-1.168737.839SomervilleTotal population75,974+/-3536,957+/-87439,017+/-87216 years and over88.10%+/-1.187.70%+/-1.488.40%+/- 1.366933.094Total:890080 Chart2
- 34. Job Percent Comparisons Swing % 0000 0010-0430 0500-0950 1000-1240 1300-1560 1600-1965 2000-2060 2100-2160 2200-2550 2600-2960 3000-3540 3600-3655 3700-3955 4000-4160 4200-4250 4300-4650 4700-4965 5000-5940 6005-6130 6200-6940 7000-7630 7700-8965 9000-9420 9500-9750 9800-9830 0.27407407407407408 5.9259259259259262E-2 3.7037037037037035E-2 0.1111111111111111 0.14814814814814814 6.6666666666666666E-2 2.2222222222222223E-2 1.4814814814814815E-2 6.6666666666666666E-2 6.6666666666666666E-2 6.6666666666666666E-2 0 0 2.2222222222222223E-2 0 1.4814814814814815E-2 7.4074074074074077E-3 2.2222222222222223E-2 0 0 0 0 0 0 0 Population % 0000 0010-0430 0500-0950 1000-1240 1300-1560 1600-1965 2000-2060 2100-2160 2200-2550 2600-2960 3000-3540 3600-3655 3700-3955 4000-4160 4200-4250 4300-4650 4700-4965 5000-5940 6005-6130 6200-6940 7000-7630 7700-8965 9000-9420 9500-9750 9800-9830 0.36800169016734308 7.1337414926402692E-2 4.9102332735265687E-2 2.8518787647911777E-2 1.3020179248804348E-2 2.6753777586657861E-2 1.4939108074152335E-2 1.6255843778665121E-2 5.8153205461848462E-2 2.2253058105191795E-2 4.0604219365867451E-2 1.4286357695038061E-2 1.2965128012011577E-2 3.6495599509721324E-2 2.1838488587303383E-2 2.2198006868399026E-2 5.3808651733733316E-2 7.4761826553838687E-2 4.6400328153906251E-4 1.4932367106381792E-2 7.9925407866074834E-3 1.3220161292663799E-2 1.1577612145908085E-2 6.5196393287437768E-3 0 Jobs By Occupation Type Percentage of Population
- 35. Sheet18Students / Unemployed / Unable to categorize:0000Management Occupations:0010-0430Business and Financial Operations Occupations:0500-0950Computer and mathematical occupations:1000-1240Architecture and Engineering Occupations:1300-1560Life, Physical, and Social Science Occupations:1600-1965Community and Social Service Occupations:2000-2060Legal Occupations:2100-2160Education, Training, and Library Occupations:2200-2550Arts, Design, Entertainment, Sports, and Media Occupations:2600- 2960Healthcare Practitioners and Technical Occupations:3000- 3540Healthcare Support Occupations:3600-3655Protective Service Occupations:3700-3955Food Preparation and Serving Related Occupations:4000-4160Building and Grounds Cleaning and Maintenance Occupations:4200-4250Personal Care and Service Occupations:4300-4650Sales and Related Occupations:4700-4965Office and Administrative Support Occupations:5000-5940Farming, Fishing, and Forestry Occupations:6005-6130Construction and Extraction Occupations:6200-6940Installation, Maintenance, and Repair Occupations:7000-7630Production Occupations:7700- 8965Transportation Occupations:9000-9420Material Moving Occupations:9500-9750 Job ChartsSample GroupPopulationSwing %Population %ArlingtonBostonBrooklineCambridgeMedfordNewtonSomervil leStudents / Unemployed / Unable to categorize00003732755127.41%36.80%Management, Business, Science, and Arts Occupations:0010-3540Management, Business, and Financial Occupations:0010-0950Management Occupations:0010- 0430863,4965.93%7.13%39183345544027080357364524616Bus iness and Financial Operations Occupations:0500- 0950543,7053.70%4.91%15812581732854311208137972833Co mputer, Engineering, and Science Occupations:1000- 1965Computer and mathematical occupations:1000- 12401525,38411.11%2.85%19851085617893769161427232648 Architecture and Engineering Occupations:1300-
- 36. 15602011,58914.81%1.30%90445986711892102111801323Life, Physical, and Social Science Occupations:1600- 1965923,8136.67%2.68%117987482676571992221692400Educa tion, Legal, Community Service, Arts, and Media Occupations:2000-2960Community and Social Service Occupations:2000- 2060313,2972.22%1.49%66979848021307771856908Legal Occupations:2100- 2160214,4691.48%1.63%4867628130014405082134973Educatio n, Training, and Library Occupations:2200- 2550951,7616.67%5.82%25642316041059234274350814874Art s, Design, Entertainment, Sports, and Media Occupations:2600- 2960919,8076.67%2.23%110994431290300881318472297Healt hcare Practitioners and Technical Occupations:3000- 3540936,1416.67%4.06%14371913540633563178341132047Ser vice Occupations:3600-4650Healthcare Support Occupations:3600- 3655012,7160.00%1.43%2679683183866626387704Protective Service Occupations:3700- 3955011,5400.00%1.30%2778415196731702469750Food Preparation and Serving Related Occupations:4000- 4160332,4842.22%3.65%627232737162055168512852843Buildi ng and Grounds Cleaning and Maintenance Occupations:4200- 4250019,4380.00%2.18%229146683216659354602160Personal Care and Service Occupations:4300- 4650219,7581.48%2.22%53713140700175391310521663Sales and Office Occupations:4700-5940Sales and Related Occupations:4700- 4965147,8940.74%5.38%20872984120873881344031613397Off ice and Administrative Support Occupations:5000- 5940366,5442.22%7.48%26264205023215524463436835706Nat ural Resources, Construction, and Maintenance Occupations:6005-7630Farming, Fishing, and Forestry Occupations:6005- 613004130.00%0.05%023229663083Construction and Extraction Occupations:6200-
- 37. 6940013,2910.00%1.49%48786491704719867281800Installatio n, Maintenance, and Repair Occupations:7000- 763007,1140.00%0.80%5154389141471631380587Production, Transportation, and Material Moving Occupations:7700- 9750Production Occupations:7700- 8965011,7670.00%1.32%19179971848337417051116Transporta tion and Material Moving Occupations:9000-9750Transportation Occupations:9000- 9420010,3050.00%1.16%301770991736578365525Material Moving Occupations:9500- 975005,8030.00%0.65%91440175237271208520Military Specific Occupations:9800-983000.00%0.00%135562529890080 ArlingtonSubjectArlington town, Middlesex County, MassachusettsTotalMaleFemaleMedian earnings (dollars)Median earnings (dollars) for maleMedian earnings (dollars) for femaleEstimateMargin of ErrorEstimateMargin of ErrorEstimateMargin of ErrorEstimateMargin of ErrorEstimateMargin of ErrorEstimateMargin of ErrorCivilian employed population 16 years and over24,067+/-67649.80%+/- 1.350.20%+/-1.358,956+/-3,14971,530+/-3,65150,444+/- 3,902Management, business, science, and arts occupations:15,832+/-67349.60%+/-1.950.40%+/-1.973,875+/- 2,15590,696+/-6,52862,382+/-3,265Management, business, and financial occupations:5,499+/-48549.10%+/-4.550.90%+/- 4.583,207+/-6,821102,542+/-9,75068,669+/-10,368Management occupations3,918+/-46146.70%+/-5.453.30%+/-5.487,321+/- 5,421108,004+/-5,44172,216+/-12,065Business and financial operations occupations1,581+/-27254.80%+/-7.445.20%+/- 7.472,761+/-8,68780,063+/-12,60362,976+/-14,590Computer, engineering, and science occupations:4,068+/-44469.10%+/- 4.830.90%+/-4.892,672+/-4,19697,170+/-5,45177,668+/- 10,672Computer and mathematical occupations1,985+/- 30774.50%+/-5.925.50%+/-5.997,837+/-6,361103,939+/- 9,28591,344+/-12,974Architecture and engineering occupations904+/-21074.40%+/-11.025.60%+/-11.087,160+/- 12,41395,890+/-4,66783,464+/-24,485Life, physical, and social
- 38. science occupations1,179+/-24255.80%+/-10.844.20%+/- 10.874,519+/-14,51089,487+/-19,46659,293+/-15,762Education, legal, community service, arts, and media occupations:4,828+/- 48442.00%+/-4.558.00%+/-4.555,145+/-6,54667,606+/- 6,88350,756+/-5,405Community and social services occupations669+/-14812.10%+/-7.187.90%+/-7.151,434+/- 19,67965,592+/-8,54342,000+/-23,603Legal occupations486+/- 13059.10%+/-12.440.90%+/-12.492,167+/-22,761101,625+/- 25,39373,917+/-36,743Education, training, and library occupations2,564+/-33041.20%+/-6.058.80%+/-6.055,833+/- 9,37775,299+/-8,58450,158+/-7,037Arts, design, entertainment, sports, and media occupations1,109+/-28654.50%+/- 9.845.50%+/-9.850,202+/-7,14153,125+/-4,41941,920+/- 11,795Healthcare practitioner and technical occupations:1,437+/-24721.60%+/-8.978.40%+/-8.969,133+/- 8,76487,222+/-57,46467,578+/-11,166Health diagnosing and treating practitioners and other technical occupations1,153+/- 20923.90%+/-10.376.10%+/-10.374,926+/-7,939105,625+/- 110,53272,843+/-6,617Health technologists and technicians284+/-11112.30%+/-14.087.70%+/-14.034,038+/- 4,97616,620+/-8,82935,750+/-5,963Service occupations:1,937+/-28646.20%+/-7.853.80%+/-7.825,284+/- 4,66830,473+/-6,01017,813+/-13,690Healthcare support occupations267+/-11610.50%+/-13.189.50%+/-13.127,266+/- 15,813-**25,078+/-19,989Protective service occupations:277+/- 11373.60%+/-17.326.40%+/-17.353,780+/-24,18870,816+/- 18,1207,266+/-41,273Fire fighting and prevention, and other protective service workers including supervisors203+/- 10264.00%+/-20.336.00%+/-20.328,173+/-28,51653,750+/- 9,4507,266+/-41,273Law enforcement workers including supervisors74+/-57100.00%+/-35.50.00%+/-35.575,625+/- 7,99075,625+/-7,990-**Food preparation and serving related occupations627+/-17354.90%+/-14.545.10%+/-14.515,640+/- 11,97824,167+/-15,3669,954+/-11,169Building and grounds cleaning and maintenance occupations229+/-10177.30%+/- 18.422.70%+/-18.422,472+/-13,26432,847+/-27,65222,059+/-
- 39. 11,366Personal care and service occupations537+/- 16926.30%+/-16.573.70%+/-16.520,809+/-17,19634,904+/- 61,61418,482+/-17,259Sales and office occupations:4,713+/- 46839.20%+/-4.760.80%+/-4.736,428+/-3,74445,219+/- 7,52833,209+/-3,588Sales and related occupations2,087+/- 36653.50%+/-6.846.50%+/-6.841,681+/-16,10957,446+/- 5,42430,000+/-10,178Office and administrative support occupations2,626+/-32727.80%+/-5.672.20%+/-5.635,308+/- 3,05840,288+/-9,84934,597+/-3,284Natural resources, construction, and maintenance occupations:1,002+/- 20189.90%+/-7.310.10%+/-7.338,529+/-10,00635,417+/- 11,62660,481+/-47,033Farming, fishing, and forestry occupations0+/-26-**-**-**-**-**Construction and extraction occupations487+/-14696.50%+/-5.63.50%+/-5.641,761+/- 8,00942,581+/-10,441-**Installation, maintenance, and repair occupations515+/-16583.70%+/-13.716.30%+/-13.733,841+/- 17,33133,341+/-14,11662,115+/-46,726Production, transportation, and material moving occupations:583+/- 16687.30%+/-8.412.70%+/-8.430,515+/-19,01531,838+/- 21,27927,955+/-74,592Production occupations191+/- 10271.20%+/-19.228.80%+/-19.261,098+/-21,02661,061+/- 19,45195,078+/-144,059Transportation occupations301+/- 13896.70%+/-5.33.30%+/-5.322,386+/-19,68325,938+/- 19,2502,500-***Material moving occupations91+/-6190.10%+/- 22.79.90%+/-22.714,583+/-18,83417,500+/-24,809- **PERCENT IMPUTEDOccupation6.70%(X)(X)(X)(X)(X)(X)(X)(X)(X)(X)( X) BostonSubjectBoston city, MassachusettsTotalMaleFemaleMedian earnings (dollars)Median earnings (dollars) for maleMedian earnings (dollars) for femaleEstimateMargin of ErrorEstimateMargin of ErrorEstimateMargin of ErrorEstimateMargin of ErrorEstimateMargin of ErrorEstimateMargin of ErrorCivilian employed population 16 years and over325,271+/- 2,96949.20%+/-0.450.80%+/-0.438,296+/-66741,400+/-
- 40. 67135,708+/-692Management, business, science, and arts occupations:150,824+/-2,58145.90%+/-0.754.10%+/- 0.754,945+/-66262,060+/-1,27952,117+/-838Management, business, and financial occupations:59,272+/-1,56949.10%+/- 1.150.90%+/-1.164,456+/-1,04374,842+/-3,52659,012+/- 1,697Management occupations33,455+/-1,25550.00%+/- 1.550.00%+/-1.568,559+/-2,79378,989+/-2,21361,023+/- 2,120Business and financial operations occupations25,817+/- 1,14147.90%+/-2.052.10%+/-2.061,185+/-2,18767,680+/- 5,28456,663+/-2,266Computer, engineering, and science occupations:24,202+/-1,19865.40%+/-2.034.60%+/- 2.057,767+/-3,00863,455+/-2,40850,520+/-2,201Computer and mathematical occupations10,856+/-85572.10%+/-2.927.90%+/- 2.968,416+/-3,27473,614+/-3,44659,130+/-5,784Architecture and engineering occupations4,598+/-45179.00%+/-4.221.00%+/- 4.264,892+/-4,14368,043+/-5,75849,878+/-15,232Life, physical, and social science occupations8,748+/-77850.00%+/- 3.550.00%+/-3.545,369+/-1,89944,211+/-3,24445,987+/- 1,810Education, legal, community service, arts, and media occupations:48,215+/-1,63238.50%+/-1.661.50%+/- 1.642,109+/-1,04643,682+/-1,79041,041+/-1,179Community and social services occupations7,984+/-72232.40%+/- 3.867.60%+/-3.837,341+/-2,10936,538+/-3,93837,691+/- 2,115Legal occupations7,628+/-65248.00%+/-4.152.00%+/- 4.175,586+/-8,34891,657+/-12,29163,892+/-4,275Education, training, and library occupations23,160+/-1,31634.60%+/- 2.365.40%+/-2.338,224+/-3,40437,843+/-7,59438,447+/- 3,921Arts, design, entertainment, sports, and media occupations9,443+/-84545.40%+/-4.054.60%+/-4.040,452+/- 2,22442,348+/-3,86238,686+/-3,206Healthcare practitioner and technical occupations:19,135+/-1,05230.30%+/-2.369.70%+/- 2.358,087+/-1,85958,981+/-2,82357,558+/-2,293Health diagnosing and treating practitioners and other technical occupations13,803+/-87728.80%+/-2.671.20%+/-2.663,875+/- 1,92271,620+/-9,90462,861+/-2,367Health technologists and technicians5,332+/-58434.10%+/-5.065.90%+/-5.040,349+/-
- 41. 2,75343,347+/-5,25539,543+/-2,482Service occupations:69,179+/-2,05148.00%+/-1.452.00%+/- 1.421,457+/-57025,242+/-1,34718,678+/-1,228Healthcare support occupations9,683+/-74416.90%+/-2.983.10%+/- 2.928,398+/-2,16730,535+/-2,68827,486+/-2,101Protective service occupations:8,415+/-71177.40%+/-3.722.60%+/- 3.740,521+/-7,45847,500+/-6,61923,363+/-9,591Fire fighting and prevention, and other protective service workers including supervisors5,882+/-60075.10%+/-4.524.90%+/-4.526,290+/- 4,06029,915+/-3,31112,491+/-7,006Law enforcement workers including supervisors2,533+/-41482.80%+/-5.617.20%+/- 5.679,096+/-7,00582,556+/-5,50556,689+/-8,287Food preparation and serving related occupations23,273+/- 1,51657.90%+/-2.542.10%+/-2.518,521+/-1,66321,179+/- 1,09013,730+/-1,280Building and grounds cleaning and maintenance occupations14,668+/-94953.60%+/-3.346.40%+/- 3.321,357+/-97726,025+/-2,05817,793+/-1,920Personal care and service occupations13,140+/-97428.20%+/-2.871.80%+/- 2.816,593+/-1,08619,826+/-2,63615,540+/-1,075Sales and office occupations:71,891+/-1,93141.20%+/-1.158.80%+/- 1.131,602+/-81034,168+/-1,68830,360+/-984Sales and related occupations29,841+/-1,38050.20%+/-1.749.80%+/-1.731,827+/- 1,74740,820+/-2,79720,321+/-2,402Office and administrative support occupations42,050+/-1,48534.70%+/-1.865.30%+/- 1.831,498+/-80329,405+/-3,15332,246+/-970Natural resources, construction, and maintenance occupations:13,270+/- 91595.50%+/-1.54.50%+/-1.536,315+/-2,19836,673+/- 2,27032,798+/-7,398Farming, fishing, and forestry occupations232+/-14340.50%+/-30.559.50%+/-30.531,932+/- 12,13940,000+/-27,07324,569+/-17,104Construction and extraction occupations8,649+/-78396.50%+/-1.53.50%+/- 1.535,067+/-3,37435,316+/-3,06526,288+/-9,994Installation, maintenance, and repair occupations4,389+/-47296.40%+/- 1.83.60%+/-1.839,824+/-2,46039,438+/-2,41966,250+/- 29,366Production, transportation, and material moving occupations:20,107+/-1,00975.70%+/-2.024.30%+/-
- 42. 2.028,033+/-1,60230,274+/-1,72821,577+/-2,074Production occupations7,997+/-63464.40%+/-3.835.60%+/-3.830,112+/- 2,14934,019+/-2,27622,912+/-4,489Transportation occupations7,709+/-79584.40%+/-3.015.60%+/-3.030,561+/- 1,76530,938+/-1,79328,194+/-5,247Material moving occupations4,401+/-56080.90%+/-4.519.10%+/-4.518,898+/- 2,70420,204+/-3,25516,280+/-3,147PERCENT IMPUTEDOccupation10.80%(X)(X)(X)(X)(X)(X)(X)(X)(X)(X)( X) BrooklineSubjectBrookline CDP, MassachusettsTotalMaleFemaleMedian earnings (dollars)Median earnings (dollars) for maleMedian earnings (dollars) for femaleEstimateMargin of ErrorEstimateMargin of ErrorEstimateMargin of ErrorEstimateMargin of ErrorEstimateMargin of ErrorEstimateMargin of ErrorCivilian employed population 16 years and over31,597+/-94748.40%+/- 1.451.60%+/-1.458,498+/-2,11170,205+/-5,62051,450+/- 2,341Management, business, science, and arts occupations:24,383+/-90348.40%+/-1.651.60%+/-1.667,848+/- 3,78885,817+/-5,22058,581+/-2,882Management, business, and financial occupations:7,687+/-64957.00%+/-3.843.00%+/- 3.879,574+/-9,45792,820+/-15,25762,696+/-6,168Management occupations4,402+/-46258.90%+/-4.841.10%+/-4.889,792+/- 14,759111,125+/-14,88470,667+/-12,029Business and financial operations occupations3,285+/-45154.50%+/-6.845.50%+/- 6.865,701+/-8,27177,315+/-10,70256,548+/-8,395Computer, engineering, and science occupations:5,136+/-45455.50%+/- 5.144.50%+/-5.163,548+/-9,58672,388+/-9,45958,701+/- 3,396Computer and mathematical occupations1,789+/- 35861.30%+/-9.538.70%+/-9.569,819+/-8,88773,914+/- 21,44362,870+/-13,353Architecture and engineering occupations671+/-19679.70%+/-9.820.30%+/-9.886,635+/- 19,24481,164+/-26,18091,964+/-10,040Life, physical, and social science occupations2,676+/-30245.50%+/-6.454.50%+/- 6.454,934+/-9,07761,719+/-21,00851,119+/-6,488Education, legal, community service, arts, and media occupations:7,497+/-
- 43. 56539.50%+/-3.460.50%+/-3.456,498+/-6,21681,920+/- 16,88248,154+/-5,218Community and social services occupations802+/-21128.80%+/-9.571.20%+/-9.547,026+/- 7,67036,741+/-21,67147,392+/-9,571Legal occupations1,300+/- 30151.20%+/-8.548.80%+/-8.5122,586+/-29,719130,000+/- 59,175109,397+/-31,054Education, training, and library occupations4,105+/-41137.00%+/-4.563.00%+/-4.550,484+/- 7,13286,303+/-13,35439,905+/-7,653Arts, design, entertainment, sports, and media occupations1,290+/- 26342.50%+/-9.957.50%+/-9.950,903+/-16,06151,429+/- 33,69650,568+/-14,400Healthcare practitioner and technical occupations:4,063+/-44539.50%+/-4.960.50%+/-4.975,625+/- 12,181117,174+/-40,10566,474+/-3,770Health diagnosing and treating practitioners and other technical occupations3,613+/- 38540.90%+/-5.259.10%+/-5.284,764+/-15,926142,206+/- 48,41767,520+/-6,984Health technologists and technicians450+/-13728.90%+/-15.471.10%+/-15.438,700+/- 22,43932,083+/-38,51050,313+/-27,464Service occupations:2,116+/-36347.20%+/-7.052.80%+/-7.020,906+/- 2,71223,125+/-6,41118,296+/-2,531Healthcare support occupations183+/-6718.60%+/-16.181.40%+/-16.140,865+/- 20,73067,222+/-429,30629,375+/-13,552Protective service occupations:196+/-9075.00%+/-19.325.00%+/-19.337,143+/- 23,44053,229+/-25,61327,981+/-45,606Fire fighting and prevention, and other protective service workers including supervisors147+/-7076.20%+/-21.123.80%+/-21.127,596+/- 29,98753,542+/-51,4643,750+/-35,463Law enforcement workers including supervisors49+/-4871.40%+/-43.528.60%+/- 43.546,382+/-63,02947,303+/-111,658-**Food preparation and serving related occupations716+/-22252.20%+/-12.747.80%+/- 12.718,793+/-8,76920,484+/-13,45617,759+/-12,162Building and grounds cleaning and maintenance occupations321+/- 13041.70%+/-20.258.30%+/-20.218,094+/-9,28638,750+/- 22,63215,880+/-7,719Personal care and service occupations700+/-21244.10%+/-14.455.90%+/-14.419,739+/- 4,14721,425+/-9,51217,983+/-5,669Sales and office
- 44. occupations:4,408+/-55546.00%+/-5.554.00%+/-5.538,214+/- 7,30841,069+/-9,04736,479+/-6,890Sales and related occupations2,087+/-36856.20%+/-7.543.80%+/-7.550,486+/- 10,73450,772+/-12,01950,000+/-21,717Office and administrative support occupations2,321+/-41136.80%+/- 8.163.20%+/-8.132,282+/-3,93231,389+/-5,32133,486+/- 6,473Natural resources, construction, and maintenance occupations:340+/-12789.40%+/-10.210.60%+/-10.227,121+/- 14,30526,742+/-19,13730,781+/-35,271Farming, fishing, and forestry occupations29+/-3344.80%+/-55.255.20%+/- 55.232,266+/-119,395-**-**Construction and extraction occupations170+/-7792.40%+/-11.67.60%+/-11.631,591+/- 30,07935,347+/-25,3545,694+/-5,057Installation, maintenance, and repair occupations141+/-10195.00%+/-10.85.00%+/- 10.825,492+/-17,89325,227+/-11,960-**Production, transportation, and material moving occupations:350+/- 13046.90%+/-15.853.10%+/-15.832,061+/-2,40434,063+/- 24,97630,417+/-22,072Production occupations184+/- 9925.50%+/-21.474.50%+/-21.432,738+/-2,642150,875+/- 194,15132,530+/-18,092Transportation occupations91+/- 5171.40%+/-29.628.60%+/-29.630,592+/-5,86231,118+/- 3,25621,912+/-47,589Material moving occupations75+/- 5669.30%+/-40.630.70%+/-40.652,656+/-110,28065,588+/- 49,416-**PERCENT IMPUTEDOccupation6.80%(X)(X)(X)(X)(X)(X)(X)(X)(X)(X)( X)SubjectBrookline CDP, MassachusettsTotalMaleFemaleMedian earnings (dollars)Median earnings (dollars) for maleMedian earnings (dollars) for femaleEstimateMargin of ErrorEstimateMargin of ErrorEstimateMargin of ErrorEstimateMargin of ErrorEstimateMargin of ErrorEstimateMargin of Error CambridgeSubjectCambridge city, MassachusettsTotalMaleFemaleMedian earnings (dollars)Median earnings (dollars) for maleMedian earnings (dollars) for femaleEstimateMargin of ErrorEstimateMargin of ErrorEstimateMargin of ErrorEstimateMargin of
- 45. ErrorEstimateMargin of ErrorEstimateMargin of ErrorCivilian employed population 16 years and over59,552+/- 1,14550.70%+/-1.449.30%+/-1.443,797+/-1,20248,959+/- 2,58440,432+/-1,516Management, business, science, and arts occupations:41,323+/-1,04552.00%+/-1.348.00%+/- 1.355,305+/-1,46562,061+/-2,54651,211+/-1,668Management, business, and financial occupations:11,391+/-62249.20%+/- 2.750.80%+/-2.767,538+/-6,17377,466+/-6,01361,004+/- 6,757Management occupations7,080+/-52249.70%+/- 3.350.30%+/-3.374,472+/-3,90980,474+/-7,47665,240+/- 8,114Business and financial operations occupations4,311+/- 43848.50%+/-5.151.50%+/-5.162,988+/-6,77475,119+/- 17,12252,542+/-5,472Computer, engineering, and science occupations:11,380+/-69464.00%+/-2.836.00%+/-2.859,710+/- 2,44064,819+/-3,82150,581+/-3,463Computer and mathematical occupations3,769+/-41580.20%+/-4.619.80%+/-4.677,422+/- 7,69278,333+/-7,82175,650+/-20,056Architecture and engineering occupations1,892+/-30567.30%+/-7.632.70%+/- 7.667,702+/-7,75774,468+/-7,97254,297+/-11,735Life, physical, and social science occupations5,719+/-52452.30%+/- 3.647.70%+/-3.648,582+/-3,07050,407+/-3,90046,358+/- 5,677Education, legal, community service, arts, and media occupations:14,989+/-72449.00%+/-2.651.00%+/-2.642,690+/- 2,51445,300+/-5,99541,507+/-2,601Community and social services occupations1,307+/-21430.80%+/-8.569.20%+/- 8.541,031+/-8,72340,735+/-13,99841,467+/-14,823Legal occupations1,440+/-23951.40%+/-8.848.60%+/-8.8102,000+/- 45,855100,750+/-55,380103,281+/-65,814Education, training, and library occupations9,234+/-70451.30%+/-3.448.70%+/- 3.434,983+/-4,62034,926+/-6,73235,028+/-5,011Arts, design, entertainment, sports, and media occupations3,008+/- 33049.00%+/-5.551.00%+/-5.549,813+/-2,60752,025+/- 6,56347,259+/-5,903Healthcare practitioner and technical occupations:3,563+/-37234.50%+/-5.065.50%+/-5.064,296+/- 5,27775,130+/-10,48260,741+/-6,085Health diagnosing and treating practitioners and other technical occupations3,019+/-
- 46. 34231.30%+/-5.068.70%+/-5.066,870+/-6,411100,990+/- 42,06963,446+/-5,085Health technologists and technicians544+/-16552.60%+/-13.947.40%+/-13.937,841+/- 6,52049,000+/-21,07931,824+/-6,937Service occupations:6,070+/-56143.70%+/-5.156.30%+/-5.118,405+/- 2,23418,216+/-3,33318,523+/-2,799Healthcare support occupations866+/-18716.50%+/-8.083.50%+/-8.026,024+/- 3,01724,583+/-31,06526,107+/-3,288Protective service occupations:731+/-16263.70%+/-11.536.30%+/-11.526,094+/- 15,73726,438+/-12,47111,125+/-38,916Fire fighting and prevention, and other protective service workers including supervisors568+/-15269.70%+/-13.330.30%+/-13.311,512+/- 7,11217,134+/-14,7196,062+/-1,047Law enforcement workers including supervisors163+/-8042.90%+/-21.057.10%+/- 21.058,950+/-22,41345,000+/-13,84171,705+/-27,142Food preparation and serving related occupations2,055+/- 34452.80%+/-8.647.20%+/-8.616,296+/-4,72017,970+/- 4,09113,348+/-7,059Building and grounds cleaning and maintenance occupations665+/-14661.50%+/-10.238.50%+/- 10.219,980+/-4,47120,284+/-9,77519,883+/-4,314Personal care and service occupations1,753+/-34031.20%+/-7.568.80%+/- 7.514,501+/-2,55514,012+/-3,65915,152+/-3,912Sales and office occupations:9,405+/-63840.30%+/-3.659.70%+/- 3.626,719+/-4,36031,806+/-5,37622,070+/-2,070Sales and related occupations3,881+/-37551.60%+/-5.048.40%+/- 5.026,816+/-7,71535,282+/-9,10217,903+/-6,167Office and administrative support occupations5,524+/-49532.40%+/- 4.267.60%+/-4.226,667+/-5,47330,536+/-5,37924,258+/- 5,166Natural resources, construction, and maintenance occupations:948+/-24382.90%+/-13.017.10%+/-13.037,202+/- 7,84135,893+/-6,03653,402+/-59,776Farming, fishing, and forestry occupations6+/-13100.00%+/-100.00.00%+/- 100.02,500-***2,500-***-**Construction and extraction occupations471+/-14587.50%+/-13.612.50%+/-13.632,841+/- 12,97431,736+/-13,81178,244+/-101,337Installation, maintenance, and repair occupations471+/-18778.10%+/-
- 47. 21.521.90%+/-21.542,380+/-10,57141,923+/-6,88052,889+/- 80,444Production, transportation, and material moving occupations:1,806+/-29883.30%+/-5.416.70%+/-5.423,908+/- 4,48024,918+/-7,81117,143+/-9,922Production occupations833+/-22778.90%+/-8.221.10%+/-8.225,063+/- 8,67029,271+/-8,72513,000+/-5,528Transportation occupations736+/-18984.80%+/-7.715.20%+/-7.723,253+/- 5,96323,347+/-6,60122,727+/-16,403Material moving occupations237+/-10994.10%+/-6.15.90%+/-6.126,146+/- 7,62326,146+/-7,44727,500+/-68,327PERCENT IMPUTEDOccupation8.40%(X)(X)(X)(X)(X)(X)(X)(X)(X)(X)( X)SubjectCambridge city, MassachusettsTotalMaleFemaleMedian earnings (dollars)Median earnings (dollars) for maleMedian earnings (dollars) for femaleEstimateMargin of ErrorEstimateMargin of ErrorEstimateMargin of ErrorEstimateMargin of ErrorEstimateMargin of ErrorEstimateMargin of Error MedfordSubjectMedford city, MassachusettsTotalMaleFemaleMedian earnings (dollars)Median earnings (dollars) for maleMedian earnings (dollars) for femaleEstimateMargin of ErrorEstimateMargin of ErrorEstimateMargin of ErrorEstimateMargin of ErrorEstimateMargin of ErrorEstimateMargin of ErrorCivilian employed population 16 years and over32,034+/-81149.70%+/- 1.650.30%+/-1.643,207+/-1,53749,635+/-2,77237,547+/- 2,474Management, business, science, and arts occupations:15,829+/-93648.80%+/-2.751.20%+/-2.759,502+/- 2,50966,635+/-3,55352,251+/-2,190Management, business, and financial occupations:5,654+/-61150.20%+/-4.949.80%+/- 4.964,233+/-6,57669,896+/-8,27558,478+/-9,243Management occupations3,573+/-47952.90%+/-6.547.10%+/-6.568,594+/- 5,69176,802+/-15,40559,766+/-17,451Business and financial operations occupations2,081+/-32445.70%+/-7.154.30%+/- 7.158,618+/-7,16259,167+/-10,68658,090+/-8,969Computer, engineering, and science occupations:3,557+/-41873.60%+/- 4.926.40%+/-4.969,662+/-5,54074,773+/-6,20357,409+/-
- 48. 5,353Computer and mathematical occupations1,614+/- 34483.20%+/-5.916.80%+/-5.983,284+/-9,18684,779+/- 9,82256,067+/-33,617Architecture and engineering occupations1,021+/-20584.20%+/-7.415.80%+/-7.464,107+/- 7,52365,636+/-7,64254,750+/-15,593Life, physical, and social science occupations922+/-22845.00%+/-10.655.00%+/- 10.664,337+/-8,34573,893+/-19,25158,750+/-10,246Education, legal, community service, arts, and media occupations:4,835+/- 46538.50%+/-4.761.50%+/-4.745,646+/-2,95346,542+/- 5,63944,956+/-5,772Community and social services occupations771+/-18138.40%+/-14.261.60%+/-14.244,964+/- 6,67544,315+/-20,48146,536+/-7,373Legal occupations508+/- 14831.30%+/-13.668.70%+/-13.663,735+/-13,68591,597+/- 72,10863,117+/-9,641Education, training, and library occupations2,743+/-36332.00%+/-5.068.00%+/-5.041,294+/- 5,77143,682+/-5,02239,545+/-8,668Arts, design, entertainment, sports, and media occupations813+/-22665.10%+/- 12.834.90%+/-12.844,347+/-11,17156,953+/-17,97335,526+/- 17,318Healthcare practitioner and technical occupations:1,783+/-32522.40%+/-7.777.60%+/-7.754,790+/- 9,58564,500+/-18,40754,278+/-5,670Health diagnosing and treating practitioners and other technical occupations1,132+/- 24419.70%+/-7.880.30%+/-7.867,917+/-12,96782,279+/- 18,88864,441+/-14,968Health technologists and technicians651+/-21227.20%+/-16.172.80%+/-16.137,983+/- 11,11447,896+/-21,13637,464+/-9,864Service occupations:4,861+/-55846.60%+/-5.153.40%+/-5.122,093+/- 4,04030,703+/-4,12117,151+/-7,645Healthcare support occupations626+/-24432.90%+/-11.767.10%+/-11.736,154+/- 9,54154,306+/-20,36930,227+/-11,007Protective service occupations:702+/-17080.50%+/-11.819.50%+/-11.843,017+/- 16,85050,038+/-11,82620,509+/-15,044Fire fighting and prevention, and other protective service workers including supervisors524+/-15276.10%+/-14.623.90%+/-14.629,214+/- 15,07140,583+/-26,70514,948+/-16,857Law enforcement workers including supervisors178+/-7893.30%+/-10.76.70%+/-
- 49. 10.756,833+/-51,56055,833+/-45,345-**Food preparation and serving related occupations1,685+/-36645.90%+/-8.954.10%+/- 8.917,250+/-6,65919,421+/-10,57811,865+/-8,773Building and grounds cleaning and maintenance occupations935+/- 24254.40%+/-13.845.60%+/-13.820,719+/-5,75131,440+/- 10,09113,050+/-2,513Personal care and service occupations913+/-22723.40%+/-10.676.60%+/-10.620,563+/- 5,46430,625+/-13,34916,065+/-9,321Sales and office occupations:8,074+/-65736.90%+/-3.663.10%+/-3.635,000+/- 3,68840,028+/-4,02433,120+/-3,041Sales and related occupations3,440+/-47145.40%+/-6.654.60%+/-6.631,570+/- 8,12940,252+/-6,02826,942+/-5,649Office and administrative support occupations4,634+/-43530.60%+/-3.969.40%+/- 3.936,437+/-3,28739,674+/-8,06635,152+/-2,798Natural resources, construction, and maintenance occupations:1,680+/- 27199.50%+/-0.80.50%+/-0.842,984+/-4,97442,823+/-4,939- **Farming, fishing, and forestry occupations63+/-63100.00%+/- 38.80.00%+/-38.815,313+/-14,11815,313+/-14,118- **Construction and extraction occupations986+/-22599.20%+/- 1.30.80%+/-1.339,700+/-11,66939,300+/-11,899-**Installation, maintenance, and repair occupations631+/-173100.00%+/- 5.40.00%+/-5.446,830+/-7,26446,830+/-7,264-**Production, transportation, and material moving occupations:1,590+/- 33280.40%+/-6.419.60%+/-6.427,042+/-4,21626,821+/- 3,97630,181+/-7,534Production occupations741+/- 20167.70%+/-9.432.30%+/-9.432,520+/-2,77835,549+/- 7,29530,302+/-6,807Transportation occupations578+/- 19097.60%+/-4.62.40%+/-4.625,904+/-3,25626,090+/-2,455- **Material moving occupations271+/-13478.60%+/- 18.921.40%+/-18.920,536+/-8,72917,138+/-8,89535,303+/- 19,182PERCENT IMPUTEDOccupation7.80%(X)(X)(X)(X)(X)(X)(X)(X)(X)(X)( X)SubjectMedford city, MassachusettsTotalMaleFemaleMedian earnings (dollars)Median earnings (dollars) for maleMedian earnings (dollars) for femaleEstimateMargin of ErrorEstimateMargin of ErrorEstimateMargin of
- 50. ErrorEstimateMargin of ErrorEstimateMargin of ErrorEstimateMargin of Error NewtonSubjectNewton city, MassachusettsTotalMaleFemaleMedian earnings (dollars)Median earnings (dollars) for maleMedian earnings (dollars) for femaleEstimateMargin of ErrorEstimateMargin of ErrorEstimateMargin of ErrorEstimateMargin of ErrorEstimateMargin of ErrorEstimateMargin of ErrorCivilian employed population 16 years and over43,235+/-89051.30%+/- 0.948.70%+/-0.961,570+/-1,91681,250+/-4,01948,149+/- 3,307Management, business, science, and arts occupations:30,352+/-87252.00%+/-1.448.00%+/-1.482,164+/- 2,995106,874+/-2,30162,811+/-2,989Management, business, and financial occupations:10,249+/-60557.20%+/-2.642.80%+/- 2.6102,328+/-5,790125,162+/-7,52177,411+/-4,696Management occupations6,452+/-47660.50%+/-3.739.50%+/-3.7107,017+/- 4,569125,443+/-7,85787,805+/-10,686Business and financial operations occupations3,797+/-40651.60%+/-4.648.40%+/- 4.687,454+/-7,515124,239+/-20,37564,680+/-7,991Computer, engineering, and science occupations:6,072+/-50465.50%+/- 4.134.50%+/-4.190,558+/-3,876102,566+/-10,16478,108+/- 7,793Computer and mathematical occupations2,723+/- 35471.50%+/-5.228.50%+/-5.295,060+/-6,019104,967+/- 5,91884,471+/-9,226Architecture and engineering occupations1,180+/-20975.30%+/-8.324.70%+/-8.380,588+/- 14,17993,875+/-18,36151,211+/-14,743Life, physical, and social science occupations2,169+/-30252.50%+/-6.647.50%+/- 6.684,886+/-12,00892,340+/-17,75071,125+/-19,019Education, legal, community service, arts, and media occupations:9,918+/- 69441.60%+/-2.958.40%+/-2.955,124+/-3,77471,310+/- 11,08143,821+/-8,593Community and social services occupations856+/-18530.10%+/-12.269.90%+/-12.242,872+/- 8,24637,361+/-10,33746,786+/-11,238Legal occupations2,134+/-27656.50%+/-5.743.50%+/-5.7119,397+/- 26,596163,173+/-42,48891,339+/-27,209Education, training, and library occupations5,081+/-50134.20%+/-4.565.80%+/-
- 51. 4.541,234+/-8,92462,880+/-11,11735,276+/-6,199Arts, design, entertainment, sports, and media occupations1,847+/- 25949.90%+/-6.550.10%+/-6.548,867+/-13,64256,473+/- 14,78631,917+/-14,485Healthcare practitioner and technical occupations:4,113+/-40844.40%+/-4.155.60%+/-4.1107,538+/- 16,194187,837+/-28,79678,036+/-12,376Health diagnosing and treating practitioners and other technical occupations3,581+/- 36547.30%+/-4.852.70%+/-4.8127,780+/-11,877201,845+/- 15,91195,694+/-13,550Health technologists and technicians532+/-16325.00%+/-11.675.00%+/-11.636,897+/- 8,57138,625+/-7,39436,063+/-15,558Service occupations:3,653+/-49139.70%+/-5.160.30%+/-5.121,268+/- 3,16532,922+/-6,74915,522+/-5,551Healthcare support occupations387+/-1706.50%+/-6.493.50%+/-6.431,594+/- 5,48631,964+/-373,09231,515+/-7,195Protective service occupations:469+/-14765.50%+/-15.234.50%+/-15.229,375+/- 20,09647,679+/-12,8895,484+/-13,593Fire fighting and prevention, and other protective service workers including supervisors373+/-13660.10%+/-17.639.90%+/-17.624,911+/- 23,99333,750+/-27,4024,960+/-8,122Law enforcement workers including supervisors96+/-5886.50%+/-18.013.50%+/- 18.062,083+/-27,46662,031+/-26,51787,679+/-102,554Food preparation and serving related occupations1,285+/- 23637.50%+/-9.662.50%+/-9.616,205+/-5,35825,946+/- 7,9439,950+/-7,246Building and grounds cleaning and maintenance occupations460+/-17581.30%+/-11.918.70%+/- 11.934,543+/-8,07938,421+/-13,60314,318+/-40,172Personal care and service occupations1,052+/-23824.90%+/- 9.275.10%+/-9.215,521+/-9,85321,164+/-5,66911,458+/- 8,890Sales and office occupations:6,844+/-50343.30%+/- 3.656.70%+/-3.630,773+/-3,18935,181+/-7,83428,549+/- 5,854Sales and related occupations3,161+/-37158.50%+/- 5.541.50%+/-5.540,959+/-14,52350,799+/-10,00924,549+/- 13,319Office and administrative support occupations3,683+/- 40030.40%+/-4.869.60%+/-4.827,835+/-5,72022,448+/- 8,68829,017+/-5,367Natural resources, construction, and
- 52. maintenance occupations:1,108+/-20893.60%+/-5.36.40%+/- 5.352,931+/-15,23055,224+/-11,10319,669+/-32,172Farming, fishing, and forestry occupations0+/-29-**-**-**-**- **Construction and extraction occupations728+/-16499.20%+/- 1.70.80%+/-1.760,070+/-10,51460,176+/-9,6382,500- ***Installation, maintenance, and repair occupations380+/- 12482.90%+/-13.617.10%+/-13.638,488+/-10,55539,448+/- 15,32019,890+/-37,784Production, transportation, and material moving occupations:1,278+/-32573.40%+/-8.026.60%+/- 8.022,420+/-5,71126,500+/-12,08621,408+/-3,010Production occupations705+/-22165.40%+/-13.334.60%+/-13.322,440+/- 3,99723,657+/-10,87822,040+/-2,702Transportation occupations365+/-12894.80%+/-5.95.20%+/-5.931,114+/- 7,65831,091+/-8,39950,125+/-46,162Material moving occupations208+/-8963.00%+/-25.537.00%+/-25.512,697+/- 7,13812,014+/-45,79312,928+/-13,290PERCENT IMPUTEDOccupation6.20%(X)(X)(X)(X)(X)(X)(X)(X)(X)(X)( X)SubjectNewton city, MassachusettsTotalMaleFemaleMedian earnings (dollars)Median earnings (dollars) for maleMedian earnings (dollars) for femaleEstimateMargin of ErrorEstimateMargin of ErrorEstimateMargin of ErrorEstimateMargin of ErrorEstimateMargin of ErrorEstimateMargin of Error SomervilleSubjectSomerville city, MassachusettsTotalMaleFemaleMedian earnings (dollars)Median earnings (dollars) for maleMedian earnings (dollars) for femaleEstimateMargin of ErrorEstimateMargin of ErrorEstimateMargin of ErrorEstimateMargin of ErrorEstimateMargin of ErrorEstimateMargin of ErrorCivilian employed population 16 years and over46,773+/- 1,22649.30%+/-1.650.70%+/-1.638,941+/-1,45440,890+/- 1,33536,813+/-2,078Management, business, science, and arts occupations:24,919+/-1,19147.30%+/-2.352.70%+/- 2.350,619+/-1,64654,177+/-2,39648,237+/-1,554Management, business, and financial occupations:7,449+/-61447.20%+/- 3.452.80%+/-3.453,907+/-1,89461,378+/-4,30051,037+/-
- 53. 1,611Management occupations4,616+/-49050.30%+/- 4.749.70%+/-4.754,604+/-2,42359,542+/-8,89752,726+/- 2,586Business and financial operations occupations2,833+/- 41942.20%+/-7.257.80%+/-7.252,395+/-3,66661,747+/- 4,84149,537+/-2,523Computer, engineering, and science occupations:6,371+/-63762.60%+/-4.137.40%+/-4.161,598+/- 3,91364,167+/-7,29554,611+/-5,075Computer and mathematical occupations2,648+/-42773.80%+/-6.026.20%+/-6.073,341+/- 4,54573,635+/-6,29372,545+/-10,130Architecture and engineering occupations1,323+/-25367.30%+/-9.732.70%+/- 9.766,099+/-7,04267,976+/-9,87064,915+/-7,115Life, physical, and social science occupations2,400+/-36347.60%+/- 6.152.40%+/-6.148,438+/-4,53252,038+/-6,80446,426+/- 3,785Education, legal, community service, arts, and media occupations:9,052+/-65639.70%+/-4.260.30%+/-4.240,288+/- 2,52142,038+/-3,98039,352+/-2,447Community and social services occupations908+/-20228.70%+/-9.071.30%+/- 9.037,965+/-5,44436,901+/-8,42539,073+/-7,581Legal occupations973+/-22554.00%+/-10.846.00%+/-10.856,161+/- 10,40660,923+/-25,34055,238+/-11,638Education, training, and library occupations4,874+/-46138.20%+/-5.961.80%+/- 5.939,892+/-4,97242,628+/-5,81037,847+/-4,935Arts, design, entertainment, sports, and media occupations2,297+/- 34741.10%+/-6.858.90%+/-6.839,264+/-2,64540,290+/- 10,70139,133+/-4,102Healthcare practitioner and technical occupations:2,047+/-37133.40%+/-7.266.60%+/-7.255,185+/- 4,59053,036+/-6,75156,733+/-11,626Health diagnosing and treating practitioners and other technical occupations1,372+/- 25630.70%+/-8.169.30%+/-8.162,630+/-7,37062,250+/- 9,37262,776+/-9,871Health technologists and technicians675+/- 21639.00%+/-14.261.00%+/-14.240,231+/-5,61337,043+/- 5,31641,591+/-13,568Service occupations:8,120+/- 76442.30%+/-4.757.70%+/-4.721,588+/-1,08127,591+/- 5,32419,555+/-1,676Healthcare support occupations704+/- 19912.90%+/-9.787.10%+/-9.721,694+/-5,57434,659+/- 52,20420,927+/-5,239Protective service occupations:750+/-
- 54. 21167.30%+/-11.932.70%+/-11.943,527+/-11,08143,210+/- 8,53744,688+/-31,312Fire fighting and prevention, and other protective service workers including supervisors504+/- 14971.00%+/-13.729.00%+/-13.730,147+/-11,62730,250+/- 21,25030,122+/-19,530Law enforcement workers including supervisors246+/-15259.80%+/-21.240.20%+/-21.260,256+/- 8,69460,224+/-12,04265,038+/-18,425Food preparation and serving related occupations2,843+/-48949.90%+/-7.950.10%+/- 7.920,116+/-1,78123,276+/-6,09417,531+/-2,292Building and grounds cleaning and maintenance occupations2,160+/- 34342.80%+/-9.257.20%+/-9.223,595+/-4,31930,809+/- 4,53320,600+/-3,127Personal care and service occupations1,663+/-26629.80%+/-9.270.20%+/-9.220,217+/- 2,74021,355+/-4,61718,295+/-5,741Sales and office occupations:9,103+/-81942.60%+/-3.757.40%+/-3.730,990+/- 2,00731,528+/-2,49030,229+/-3,316Sales and related occupations3,397+/-47456.70%+/-5.643.30%+/-5.626,979+/- 3,41731,084+/-8,18219,806+/-6,240Office and administrative support occupations5,706+/-62634.20%+/-4.565.80%+/- 4.532,968+/-2,89231,781+/-2,93534,116+/-3,419Natural resources, construction, and maintenance occupations:2,470+/- 37994.10%+/-3.85.90%+/-3.830,202+/-4,36030,444+/- 3,34917,143+/-13,231Farming, fishing, and forestry occupations83+/-13266.30%+/-5.133.70%+/-5.19,386+/-142-**- **Construction and extraction occupations1,800+/- 38693.80%+/-4.66.20%+/-4.627,338+/-6,27928,603+/- 5,67018,750+/-18,809Installation, maintenance, and repair occupations587+/-15898.80%+/-2.21.20%+/-2.238,520+/- 7,93438,289+/-8,064-**Production, transportation, and material moving occupations:2,161+/-35675.60%+/-7.124.40%+/- 7.125,686+/-2,66526,968+/-4,54818,824+/-4,542Production occupations1,116+/-23567.90%+/-8.332.10%+/-8.326,000+/- 4,29029,333+/-8,39119,902+/-6,401Transportation occupations525+/-16893.10%+/-8.96.90%+/-8.927,099+/- 25,37527,335+/-28,75916,957+/-79,007Material moving occupations520+/-19274.20%+/-18.125.80%+/-18.116,806+/-
- 55. 15,01521,944+/-13,8519,244+/-16,649PERCENT IMPUTEDOccupation10.20%(X)(X)(X)(X)(X)(X)(X)(X)(X)(X)( X)SubjectSomerville city, MassachusettsTotalMaleFemaleMedian earnings (dollars)Median earnings (dollars) for maleMedian earnings (dollars) for femaleEstimateMargin of ErrorEstimateMargin of ErrorEstimateMargin of ErrorEstimateMargin of ErrorEstimateMargin of ErrorEstimateMargin of Error SECTION 1 REPLIES TO PAM, MEGHAN, STACY : Engage in a meaningful discussion of the student’s understanding and the pedagogical approaches for each situation. You might also make connections to your own teaching. Would you expect a similar response from your own students? If not, why not? Have you experienced similar questions in your own classroom? If so, how have you handled them. pam Student 1-- Problem D2 showed two box plots, one for the boys’ heights and the other for the girls’ heights. In Problem D2, Monique stated that: "It looks like just 12.5% of the boys are taller than all of the girls, and maybe about 10% of the girls are shorter than the shortest boy." That was not a correct interpretation of the box plot. 12.5% is half of 25%, so Monique might have got that value from an understanding that box plots can be broken into four groups of 25% of the data. I think the 10% value was an estimate. The difference between the shortest and tallest student was 14 inches. The difference between the shortest boy and shortest girl was 2 inches. The ration of 2 to 14 is not the same as 1/10, but I wonder if the height values are what she used to estimate. My next instructional move would be to ask Monique how she came up with the value of 12.5%. I would find out if Monique
- 56. knew how the box plots were created and how to interpret the results. I would provide Monique with the boys’ raw data or have her create the data set from the dot plot. I would ask Monique to tell me what a box plot represents and what the different parts mean. I would ask her to show me how to find the five-number summary, all the while scaffolding any parts she needs help with. Finally, I would ask her to compare the data set broken into four groups to the boys box plot and I would ask if her thoughts on the boys’ data changed and how. I would also ask her how she came up with the 10% value and possibly have her redo the steps with the girls’ data. Student 2 In Problem D2, Arketa stated that: "There is a lot of overlap in heights between the boys and girls." That is a true statement, but it is very broad. Is Arketa talking in terms of the middle 50% of the data or the full range of the data? My next instructional move would be to ask Arketa for more information. Where does the data overlap? How does it overlap? Why is it significant? Is the overlap of the boxes the same as the overlap of the whiskers? Why or why not? What does that mean? --Meghan I looked at the K-2 strand. In this strand there were many student obsevations about the data they collected. Below are the two reponses I chose to discuss. Sahar: "I think there will be between 32 and 38 raisins in that [unopened] box because most of our boxes had between 32 and 38." This student clearly understands the idea of using what they observed to help make a prediction. Thes student was able to look at where the data was "clumped" to help understand that most of the boxes they opened had this number of raisins. My next step with this student might be having them try to find the
- 57. median. This would help the student to find that middle value so that maybe they could use one value to make a prediction rather than a range of calues. Isaiah: "Look at that gap with the blue dots -- and there aren't any gaps on the green dots." This student is looking at the data and definitely comparing two different graphs. This student had a more observant response than some of the other classmates because they were more fixed on the vertical aspects of the data while this student also looked at the spread. My next step for this student would be to get them using the correct vocabulary. Have the student use spread, and outlier to talk about this data. Stacy….. Hi All, I teach second grade so I looked at the data and case study for the K-2 interval. My observations about the studnets are included below. Sahar and Paul- Mr. Mitchell’s Class Sahar: "I think there will be between 32 and 38 raisins in that [unopened] box because most of our boxes had between 32 and 38." Paul: “I think there will be 34 raisins in that [unopened] box, because 34 had the most." I think these two students demonstrate an understanding of central tendencies and ‘typical’ values when they make predictions about how many raisins would be in an unopened box. The idea of the mode being the value that appears most often is evident in Paul’s response and the idea of most of the data being contained in a cluster is evident in Sahar’s response. Both students accurately use these measures to make predictions about the unopened box of raisins. Since these students seem to have a good understanding of how to interpret the data and identify ‘typical’ values the next step would be to assign statistical vocabulary such as ‘mode’ and ‘cluster’ to the concepts that each student highlights.
- 58. Additionally, I may present these students with a data set that appears to be bimodal (maybe the second pocket data line plot) to see how they use what they know about modes and clusters to identify ‘typical’ values. Ramel: Mr. Mitchell’s class Ramel: "The range is from 25 to 43." From this statement it is clear that Ramel has a misunderstanding relating to the meaning of the vocabulary word ‘range.’ His statement indicates that he considers the range to be the distance between the smallest and largest number represented on the axis of the line plot rather than the distance between the smallest and largest VALUE represented on the line plot. He does however have a foundation for understanding the range as he understands that it encompasses the distance between two values; namely the smallest and largest. The next step for Ramel would be to review the meaning of the term ‘range’ and how it is found. His current statement has simply identified the interval for the range, he has not actually calculated the range (difference between the largest and smallest value). I may give him a few examples of the range, then have him work with a buddy to find the range on his own with other data sets and then return to the raisin data and ask him “after reviewing the term range can you revise your statement about the range of the raisin data?” This way he will be able to see and correct the error he made previously. SECTION 2 REPLIES TO #1,2,3,4: Make strong connections between the course and your practice. Take this opportunity to wrap it up together, in a nice bundle you can walk away with! 1. BRING IT BACK---RICHARD I am going to write this as if I were meeting with my 7th grade teaching peers. We really work well together and enjoy
- 59. bouncing ideas off each other. While much of this course dealt with concepts above our students expected knowledge level. I am going to address the parts that I would expect them to know or be able to learn. This course started with a review of measures of central tendency. This is more of a 5th/6th grade standard in Massachusetts, but it is important to review these concepts to ensure understanding. I am constantly surprised at how much students forget over the summer. It is important for students to be able to create and analyze multiple representations of data in the form of bar graphs, histograms, box plots, scatter plots, and frequency tables. In addition, using technology to create these representations will allow more time thinking about the meaning instead of the creation of these models. Once these models are created, students need to be able to identify and quantify the spread. Specific application to our grade level would include IQR and MAD. Standard deviation is something they will calculate in high school, but it is important to know what they will be learning in years to come. If the opportunity presents itself, we can expose them to this concept. One other concept that applies indirectly to our grade level is probability. In this course, we looked at probability through the Empirical Rule. This could tie together probability and even solving equations. I would not expect them to understand the Empirical Rule, but they should be able to find probabilities from given standard deviations. I would envision this as an enrichment activity because of the attention to detail needed to solve these problems. Also as enrichment, we could discuss bivariate data. This is a major concept in statistics and probability in the 8th grade curriculum. It can be an extension of representing proportional relationships in a graph, table, or equation. It would be an opportunity for them to see that in the real world, data doesn’t always fall exactly into an equation and we have to apply the line of best fit. There are two specific parts of this course that I would present
- 60. to my colleagues. The data set and questions on How Do Students Value Statistics is a rich activity with specific application to 7th grade. I also really enjoyed all the Annenburg segments. They are well developed and lead students through the discovery process. Ultimately this is a better way for students to learn. 2. RANDALL There is so much that I have learned in this class. Statistics are part of everyday life and for you to get the most out of the data that is given to each and every one of us it is imperative that we know how to read and interpret the data. Data can be manipulated so that whatever the entity that is presenting the data can make it look so that the data will support whatever agenda that entity has. Knowing the difference between the mean of a set of data and the median of the set of data can make all the difference in the world on the interpretation of that data. Knowing the Empirical Rule makes it very easy to predict the probability of an event occurring. Standard deviation allows one to see which data is truly important and which data doesn’t have an effect on the process. Just today in my Algebra 2 class we are taking data, making a scatter plot, finding the trend line, the equation of the trend line and the correlation coefficient. I am doing all of this on the TI -84 Plus calculator and the students are amazed at the results they are getting. I have already, on the third day of school, used what I have learned in this class and I am much better prepared to explain any questions that the students have. I would recommend this class to any math teacher in the secondary level so that he/she can become a better teacher and prepare our students today to life tomorrow. 3. PAM This course has shown me how critical it is for students, and adults, to understand how to interpret and how to use statistics in everyday life. The statistics strand in math is one that we encounter and apply on a regular basis.
- 61. There are many things from this course that I can bring back to my classroom. Things that come immediately to mind (in no particular order) are vocabulary, how statistics fit into the common core standards, activities and applets used in this course, the meaning of center in a data set and using a project to apply the concepts we learned. All of the vocabulary that we learned during the first week seemed overwhelming. I could not tell the difference between a variable and an observational unit. As the weeks went on, the new words became part of my own vocabulary. Our students benefit from exposure to math vocabulary on a constant basis. Another thing that I will bring back to my practice are the newfangled ways to say box and whisker plot (box plot), stem and leaf diagram (stem plot) and line plot (dot plot). I noticed the newer versions of those terms as I went through the common core standards for the grades below and above mine, so now is the time to use them! Some of the Annenberg activities (such as having students use the number of people each lives with to create a data set for summarizing and graphing), and applets, are pertinent for teaching statistics in 7th and 8th grades. In 7th grade we work with measures of central tendency and measures of variation (MAD, in particular) and in 8th grade we use bivariate data to create scatter plots and find the line of best fit (an approximation, only). Some of the applets show how to cut to the chase, so to speak. I can also use ideas from the NCTM articles we read. Finding a balancing point in a data set might help my 7th graders be able to put mean, median and mode into context. Using the previously mentioned family size data to help students understand how distribution works can lead into our unit on MAD, as it did in the article.