SlideShare a Scribd company logo
1 of 301
127
DOI: 10.1037/13937-006
APA Handbook of Behavior Analysis: Vol. 1. Methods and
Principles, G. J. Madden (Editor-in-Chief)
Copyright © 2013 by the American Psychological Association.
All rights reserved.
C h a P t e r 6
OBSErvAtIOn And MEASurEMEnt
In BEhAvIOr AnAlySIS
Raymond G. Miltenberger and Timothy M. Weil
You can observe a lot by watching.
—Yogi Berra, circa 1964
Throughout its history, behavior analysis has
focused on building an inductive science that uses
behavioral observation techniques to identify func-
tional behavior–environment relations such that
alteration of these relations may result in behavior
change that is scientifically, and often socially,
meaningful. Measuring behavior–environment rela-
tions in accurate and reliable ways is thus an inte-
gral tool in the process of analyzing and changing
behavior. Observable behavior has formal properties
or dimensions that can be measured. These behav-
ioral dimensions include frequency, intensity, dura-
tion, and latency (e.g., Bailey & Burch, 2002;
Miltenberger, 2012). Each of these dimensions
affords the observer the opportunity to measure
changes in level, trend, and variability when altera-
tions of environmental variables occur naturally or
are manipulated under various programmed
conditions.
Observation and measurement of behavior may
take many forms and involve a variety of techniques
across practically any setting. In this chapter, we
discuss observation and measurement in the field of
behavior analysis with a focus on identifying and
measuring the target behavior, logistics of observa-
tion, recording procedures and devices, reactivity,
interobserver agreement (IOA), and ethical consid-
erations. The information discussed in this chapter
is relevant to both research and practice in behavior
analysis because observation and measurement of
behavior is central to both endeavors.
BEHAVIOR
Regardless of whether the purpose of investigation is
research or practice, it is first necessary to define
behavior. Many authors define behavior in slightly
different terms; however, each stresses an individu-
al’s action or movement. According to Miltenberger
(2012), behavior involves the actions of individuals,
what people say and do. Malott and Trojan-Suarez
(2004) suggested that behavior is anything a dead
man cannot do, again suggesting that behavior con-
sists of action or movement. Cooper, Heron, and
Heward (2007) said that “behavior is the activity of
living organisms. Human behavior is everything
people do including how they move and what they
say, think, and feel” (p. 25). Finally, Johnston and
Pennypacker (1993) stated that behavior
is that portion of an organism’s interac-
tion with its environment that is char-
acterized by detectable displacement in
space through time of some part of the
organism and that results in a measurable
change in at least one aspect of the envi-
ronment. (p. 23)
These definitions of behavior are rooted in the tradi-
tional characterization of an operant as observable
action or movement that has some subsequent effect
on (operates on) the environment (Johnston &
Pennypacker, 1993, p. 25). Although the Cooper et al.
definition of behavior includes thinking and feeling,
these actions are nonetheless those of an individual
that can be observed and recorded. Therefore, in this
chapter we focus on observation and measurement of
Co
py
ri
gh
t
Am
er
ic
an
P
sy
ch
ol
og
ic
al
A
ss
oc
ia
ti
on
.
No
t
fo
r
fu
rt
he
r
di
st
ri
bu
ti
on
.
Miltenberger and Weil
128
behavior that can be detected, and thus recorded, by
an observer. In some cases, the observer may be the
individual engaging in the behavior.
SELECTING AND DEFINING TARGET
BEHAVIOR
The first step in developing a plan for observing and
recording behavior is to select and then define
appropriate target behavior.
Selecting Target Behavior
Target behavior can be selected for a variety of over-
lapping reasons (see Kazdin, 2010). It may be useful
but arbitrary; representative of a broader class of
operants; the focus of intervention or educational
efforts that occur in a particular setting (e.g., aca-
demic performance in a school setting); chosen
because it causes impairment in some area of func-
tioning for the individual; of particular concern to
the individual or significant others who seek to
change the behavior; or chosen because it will pre-
vent the development of future problems (e.g., the
promotion of safety skills to prevent injury). When
selecting target behavior, three general categories
are considered: behavioral deficits, behavioral
excesses, and problems of stimulus control. Behav-
ioral deficits are behaviors that need to increase,
such as desirable communicative responses for a
child with autism who has limited language (e.g.,
Sundberg & Michael, 2001). Behavioral excesses
are behaviors that need to decrease, such as self-
injurious or aggressive behavior emitted by an indi-
vidual with intellectual disability (e.g., Lerman, Iwata,
Smith, & Vollmer, 1994). Problems of stimulus con-
trol are present when behaviors occur, but not at the
appropriate time or place or in the appropriate con-
text. For example, a child may learn to engage in a
safety skill during training but fail to use it when the
opportunity arises in the natural environment (e.g.,
Gatheridge et al., 2004; Himle, Miltenberger, Fless-
ner, & Gatheridge, 2004). Likewise, a child with
autism may learn to label an object but be unable to
ask for the same object (e.g., failure of tact-to-mand
transfer; Wallace, Iwata, & Hanley, 2006). Identify-
ing developmentally appropriate topographies and
levels of behavior is also important when selecting
the target behavior. For example, in research on
stuttering, Wagaman, Miltenberger, and Arndorfer
(1993) chose a criterion of 3% or fewer stuttered
words as an indication of treatment success on the
basis of research showing that as many as 3% of the
words spoken by typical speakers were dysfluent.
A guiding factor in the selection of a target
behavior in applied work is its social significance
(Baer, Wolf, & Risley, 1968). Behavior is targeted
that will increase the client’s meaningful and effec-
tive interactions with the environment. One index of
social significance is the assessment of the social
validity of the targeted behavior (Wolf, 1978).
According to Wolf (1978), one of the three levels of
social validity is the degree to which society vali-
dates the social significance of the goals of a behav-
ior change procedure. In this regard, the important
question posed by Wolf is, “Are the specific behav-
ioral goals really what society wants?” (p. 207). In
practice, assessment of the social validity of a target
behavior or goal involves asking consumers for feed-
back on what behavior should be addressed, in what
order, and to what extent. Of course, the target
behavior selected in this way may possibly have
some secondary gain or benefit for the person pro-
viding the report and thus may or may not be in the
client’s best interest. The behavior analyst must be
aware of this possibility and decide with the client,
client surrogates, treatment team members, or some
or all of these on the target behavior that best serves
the client’s interests.
Although behavior analysts are interested in the
behavior of clients or research participants, they are
also interested in the behavior of the implementers
carrying out behavior-analytic procedures. The
degree to which individuals implement assessment
and treatment procedures as planned is referred to
as implementation fidelity, procedural fidelity, or treat-
ment integrity (e.g., Gresham, Gansle, & Noell,
1993; Peterson, Homer, & Wonderlich, 1982).
Implementation fidelity is important because higher
fidelity is associated with better treatment outcomes
(e.g., DiGennaro, Martens, & Kleinmann, 2007;
DiGennaro, Martens, & McIntyre, 2005; DiGennaro-
Reed, Codding, Catania, & Maguire, 2010; Plavnick,
Ferreri, & Maupin, 2010). Implementation fidelity
is assessed by observing and recording the behavior
Co
py
ri
gh
t
Am
er
ic
an
P
sy
ch
ol
og
ic
al
A
ss
oc
ia
ti
on
.
No
t
fo
r
fu
rt
he
r
di
st
ri
bu
ti
on
.
Observation and Measurement in Behavior Analysis
129
of the implementers as they observe and record the
behavior of the clients or research participants and
as the implementers carry out intervention proce-
dures. Everything discussed in this chapter applies
not only to observing and recording the behavior of
clients or research participants, but also to measur-
ing the behavior of the implementers.
Defining the Target Behavior
The target behavior should be defined in terms that
are objective, clear, and complete (Kazdin, 2010). A
behavioral definition must include active verbs
describing the individual’s actions, that is, the topog-
raphy or form of the action being observed. Some
behavioral definitions may also include the environ-
mental events that precede (antecedents) or follow
(consequences) the behavior. Behavioral definitions
cannot include category labels (e.g., aggression) or
appeal to internal states or characteristics (e.g.,
strong willed) but rather must identify the topogra-
phy of the behavior. A behavioral definition should
be easy to read and should suffice as a starting point
for the observer to engage in data collection. Once a
behavior analyst begins to observe instances of the
behavior, the behavioral definition may be modified
on the basis of those observations. Some examples of
target behavior definitions used in behavior-analytic
research are shown in Table 6.1. Note the precise
descriptions of behavior in these examples and the
inclusion of the appropriate context for the behavior
(e.g., unscripted verbalizations are “verbalizations
that were not modeled in the video script but were
appropriate to the context of the toy”) or the neces-
sary timing of the behavior in relation to other
events (e.g., an acceptance occurs when “the child’s
mouth opened . . . within 3 seconds after the food
item was held within 1 inch of the mouth”).
LOGISTICS OF OBSERVATION
Once the target behavior is identified and defined,
the time and place of observation must be deter-
mined and the observers identified. These logistics of
observation are not insignificant, because the choices
of observation periods and observers will determine
the quality of the data derived from the observations.
TABLE 6.1
Examples of Target Behavior Definitions From Published
Articles Involving Behavior Analytic Assessment
and Treatment
Label Definition Citation
Empathy “A contextually appropriate response to a display of
affect by a doll, puppet, or person that contained
motor and vocal components (in any order) and
began within 3 s of the end of the display.” (p. 20)
Schrandt, Townsend, and Poulson
(2009)
Acceptance “The child’s mouth opened so that the spoon or
piece of
food could be delivered within 3 s after the food item
was held within 1 in. of the mouth.” (p. 329)
Riordan, Iwata, Finney, Wohl, and
Stanley (1984)
Expulsion “Any amount of food (that had been in the mouth)
was
visible outside the mouth (Joan only) or outside
the lip and chin area (Nancy, Jerry, Holly) prior to
presentation of the next bite.” (p. 329)
Riordan et al. (1984)
Activity engagement “Facial orientation toward activity
materials, appropriate
use of activity materials, or comments related to the
activity.” (p. 178)
Mace et al. (2009)
Compliance “The child independently completing or initiating
the
activity described in the instruction within 10 s.” (p.
535)
Wilder, Zonneveld, Harris, Marcus, and
Reagan (2007)
Unscripted verbalizations “Verbalizations that were not
modeled in the video script
but were appropriate to the context of the toy [that
was present].” (p. 47)
MacDonald, Sacramone, Mansfield,
Wiltz, and Ahern (2009)
Co
py
ri
gh
t
Am
er
ic
an
P
sy
ch
ol
og
ic
al
A
ss
oc
ia
ti
on
.
No
t
fo
r
fu
rt
he
r
di
st
ri
bu
ti
on
.
Miltenberger and Weil
130
Time and Place of Observations
Observation periods (the time and place chosen for
observation) should be scheduled when the target
behavior is most likely to occur (or, in the case
of behavioral deficits, when the target behavior
should be occurring but is not). In some cases, the
target behavior occurs mostly or exclusively in the
context of specific events (e.g., behavioral acquisi-
tion training in academic sessions or athletic perfor-
mance), and therefore, observation sessions have to
occur at those times. A behavior analyst, however,
may be interested in measuring the target behavior
in naturalistic settings in which the behavior is, for
the most part, free of temporal constraints. In these
instances, it is possible to interview the client and
significant people to narrow the observation win-
dow. In addition, it may be valuable to validate the
reports by collecting initial data on the occurrence
of the target behavior. For instance, scatterplot
assessments, which identify at half-hour intervals
throughout the day whether the behavior did not
occur, occurred once, or occurred multiple times,
may help identify the best time to schedule the
observation period (Touchette, Macdonald, &
Langer, 1985). In instances in which reports on the
occurrence of the target behavior are not available or
when the reports are not descriptive enough, the
behavior analyst should err on the side of caution
and conduct a scatterplot assessment or other initial
observations to narrow the observation window.
Identifying the times at which the target behavior
is most likely to occur is desirable to capture the
greatest number of instances. The rationale for
observing and recording as many instances of the
behavior as possible rests with evaluation of func-
tion during assessment and analysis of the effects of
the independent variable during intervention. When
it is not possible to observe enough instances of the
behavior across a number of observation periods to
establish clear relations between the behavior and
specific antecedents and consequences, treatment
implementation may be delayed. With behavior that
occurs at a lower rate, a longer time frame of obser-
vation may be necessary to establish functional
relations.
Although a delay to intervention after a baseline
may be acceptable in some situations, in others it
could be undesirable or unacceptable for the client
or significant others, such as teachers or parents.
Such delays can sometimes be circumvented by
structuring observations in an analog setting to eval-
uate the effects of likely antecedent and consequent
stimuli with the objective of evoking the target
behavior. Alternatively, samples of the behavior
might be collected in the natural environment at
various times to provide a sufficient baseline that
would allow making an accurate assessment of func-
tion, deciding on an appropriate intervention, or
both. Circumstances such as availability of observers
and the client’s availability must also be considered.
A final consideration in preparing to make obser-
vations is to select a placement within the observa-
tion environment that permits a full view of the
person and the behavior of interest while at the
same time minimizing disruptions to the client or
others in the environment. In addition, when col-
lecting IOA data, it is important for both observers
to see the same events from similar angles and dis-
tances but simultaneously maintain their status as
independent observers. Depending on the character-
istics of the setting, issues may arise, such as walls
or columns that impede seeing the behavior and
interruptions from staff or other individuals. Disrup-
tions in the environment are also a concern. For
example, children in elementary school classrooms
are notorious for approaching and interacting with
an adult while he or she is observing and recording
the target behavior. In addition, if the target child is
identified, the other children may cause disruptions
by talking to the target child or behaving in other-
wise disruptive ways. Any disruption should be
recorded so that it can be considered in accounting
for variability in the data.
Selecting Observers
Most behavioral observations in research and prac-
tice are conducted by trained observers. Trained
observers may not be needed in some laboratory set-
tings in which permanent products are produced or
equipment records the behavior automatically.
However, in applied settings, individuals conducting
behavioral observations must see the behavior as it
occurs so data can be collected onsite or recorded
for review at a later time. Individuals who could
Co
py
ri
gh
t
Am
er
ic
an
P
sy
ch
ol
og
ic
al
A
ss
oc
ia
ti
on
.
No
t
fo
r
fu
rt
he
r
di
st
ri
bu
ti
on
.
Observation and Measurement in Behavior Analysis
131
conduct behavioral observations in the same setting
as the client include participant observers (individu-
als who are typically present in the environment),
nonparticipant observers (data collectors who are
external to the typical workings of the environ-
ment), or the client whose behavior is being
observed (self-monitoring).
Participant observers. According to Hayes,
Barlow, and Nelson-Gray (1999), participant observ-
ers may be used in situations in which a significant
other or other responsible party in the setting (e.g.,
parent, teacher) is available (and trained) to col-
lect data. The primary advantage of including these
individuals as observers is that they are already in
the environment, which eliminates the potential
logistical problems of scheduling nonparticipant
observers. In addition, the likelihood of the child
or student showing reactivity to observation is less-
ened because the person being observed is likely to
have habituated to the participant observer’s pres-
ence over time. A limitation when using participant
observers is that the observers may not have time to
conduct observations because of their other respon-
sibilities in the setting.
One factor to consider when arranging partici-
pant observation (and nonparticipant observation)
is the possibility of surreptitious observation. With
surreptitious observation, the participant observer
would not announce or otherwise cue the partici-
pant to the fact that a particular observation session
is taking place (e.g., Mowery, Miltenberger, & Weil,
2010). For example, in Mowery et al. (2010), gradu-
ate students were present in a group home setting to
record staff behavior. However, the staff members
were told that the students were there to observe
and record client behavior as part of a class project
(this deception was approved by the institutional
review board, and participants were later debriefed).
Surreptitious observation leads to less reactivity in
the person being observed. For surreptitious obser-
vation to occur ethically, the client or participant
must consent to observation with the knowledge
that he or she will not be told, and may not be aware
of, the exact time and place of observation (e.g.,
Wright & Miltenberger, 1987). The exception
would be when a parent or guardian gives consent
for surreptitious observation of a child or a
researcher gets institutional review board approval
for deception and later debriefs the participants.
Nonparticipant observers. When it is either
impossible or undesirable to involve a participant
observer, nonparticipant observers who are not part
of the typical environment are used. For instance,
observations in school settings may require that an
observer sit in an unobtrusive area of the classroom
and conduct observations of the child at various
times of the day. Three challenges of having non-
participant observers involved in data collection are
access, scheduling, and cost. Because observations
tend to occur while clients are involved in social set-
tings, it may not be permissible to observe because
of the potential for disruption or for reasons of
confidentiality. In the latter case, when conducting
observations of the behavior of a single individual in
a group setting such as a classroom, it is typical to
require consent of all students in the group because
all are present during the observation. This is espe-
cially true when observations of minors occur.
Because observation periods may be relatively
short (especially in the context of research), it may
also be difficult to schedule an observer several
times a day or week to collect data for only 15 to 60
minutes. In addition, the client’s schedule may
restrict when observation may occur. Finally, a sig-
nificant cost may be associated with the inclusion of
skilled data collectors who may need to be hired to
fulfill this role. Circumventing excessive costs is
possible, however, if student interns or other staff
already at the site are available. In addition to the
monetary cost of the observers, there is cost in terms
of time and effort to train the observers and conduct
checks for IOA to ensure consistency in the data
collected.
Self-monitoring. When the target behavior occurs
in the absence of others, it may be useful to have cli-
ents observe and record their own behavior. When
asking clients to record their own behavior, it is nec-
essary to train them as you would train any observer.
Although there are examples of research using data
gathered through self-monitoring (e.g., marijuana
use [Twohig, Shoenberger, & Hayes, 2007]; disrup-
tive outbursts during athletic performances [Allen,
Co
py
ri
gh
t
Am
er
ic
an
P
sy
ch
ol
og
ic
al
A
ss
oc
ia
ti
on
.
No
t
fo
r
fu
rt
he
r
di
st
ri
bu
ti
on
.
Miltenberger and Weil
132
1998]; physical activity levels [Van Wormer, 2004];
binge eating [Stickney & Miltenberger, 1999]),
self-monitoring is less desirable than observation
by another individual because it may be unreli-
able. If the target behavior occurs in the absence of
others, then IOA cannot be assessed. For example,
Bosch, Miltenberger, Gross, Knudson, and Brower-
Breitweiser (2008) used self-monitoring to collect
information on instances of binge eating by young
women but could not collect IOA data because binge
eating occurred only when the individual was alone.
Self-monitoring is best used when it can be com-
bined with periodic independent observations to
assess IOA. Independent observations occur when a
second observer records the same behavior at the
same time but has no knowledge of the other
observer’s recording. Thus, the recording of both
observers is under the stimulus control of the behav-
ior being observed and is not influenced by the
recording behavior of the other observer. When IOA
is high, it might indicate that self-monitoring is
being conducted with fidelity. It is possible, how-
ever, that self-monitoring is conducted with fidelity
only under the conditions of another observer being
present, but not when the client is alone or away
from the other observer. In some instances, it is pos-
sible to collect secondary data or product measures
that can be used to verify self-monitoring. For
instance, researchers measured expired carbon mon-
oxide samples in smoking cessation research (Brown
et al., 2008; Raiff, Faix, Turturici, & Dallery, 2010)
and tested urine samples in research on substance
abuse (Hayes et al., 2004; Wong et al., 2003).
Given the potential unreliability of self-monitoring,
taking steps to produce the most accurate data pos-
sible through self-monitoring is important. Such
steps might include making a data sheet or data col-
lection device as easy to use as possible, tying data
collection to specific times or specific activities to
cue the client to record his or her behavior, having
other people in the client’s environment cue the cli-
ent to conduct self-monitoring, checking with the
client frequently by phone or e-mail to see whether
self-monitoring is occurring, having the client sub-
mit data daily via e-mail or text message, and prais-
ing the client for reporting data rather than for the
level of the behavior to avoid influencing the data.
Even with these procedures in place, clients may
still engage in data collection with poor fidelity or
make up data in an attempt to please the therapist or
researcher. Therefore, self-monitoring that lacks
verification should be avoided as a form of data col-
lection whenever possible.
Training Observers
Adequate observer training is necessary to have con-
fidence in the data. Observing and recording behav-
ior can be a complex endeavor in which the observer
must record, simultaneously or in rapid order, a
number of response classes following a specific pro-
tocol, often while attending to timing cues (see Sam-
pling Procedures section). Finally, following this
routine session after session may lead to boredom
and set the occasion for observer drift. Observer drift
is the loosening of the observer’s adherence to the
behavioral definitions that are used to identify the
behavioral topographies to be recorded, a decrease
in attending to specific features of the data collec-
tion system, or both. When observer drift occurs,
the accuracy and reliability of the data suffer, and
faulty decisions or conclusions may result (see
Kazdin, 1977).
One way to train observers is to use behavior
skills training (Miltenberger, 2012), which involves
providing instructions and modeling, having the
observer rehearse the observation and recording
procedures, and providing feedback immediately
after the performance. Such training occurs first
with simulated occurrences of the target behavior in
the training setting and then with actual occurrences
of the target behavior in the natural environment.
Subsequent booster sessions can be conducted in
which the necessary training components are used
to correct problems. To maintain adequate data col-
lection, it is necessary to reinforce accurate data
collection and detect and correct errors that occur.
Several factors can influence the fidelity of data col-
lection (Kazdin, 1977). These include the quality of
initial training, consequences delivered for the target
behavior (Harris & Ciminero, 1978), feedback from a
supervisor for accurate data collection (Mozingo,
Smith, Riordan, Reiss, & Bailey, 2006), complexity
and predictability of the behavior being observed
(Mash & McElwee, 1974), and the mere presence of a
Co
py
ri
gh
t
Am
er
ic
an
P
sy
ch
ol
og
ic
al
A
ss
oc
ia
ti
on
.
No
t
fo
r
fu
rt
he
r
di
st
ri
bu
ti
on
.
Observation and Measurement in Behavior Analysis
133
supervisor (Mozingo et al., 2006). With these factors
in mind, strong initial training and periodic assess-
ment and retraining of observers are recommended for
participant observers, nonparticipant observers, and
individuals engaging in self-monitoring.
RECORDING PROCEDURES
The procedures available for collecting data on tar-
geted behavior are categorized as continuous record-
ing procedures, sampling procedures, and product
recording.
Continuous Recording
Continuous recording (also called event recording)
procedures involve observation and recording of
each behavioral event as it occurs during the obser-
vation period. Continuous recording will produce
the most precise measure of the behavior because
every occurrence is recorded. However, continuous
recording is also the most laborious method because
the observer must have constant contact with the
participant’s behavior throughout the observation
period. As with all forms of data collection, continu-
ous recording requires the behavior analyst to first
identify the dimensions on which to focus. Observ-
ers are recommended to initially collect data on
multiple dimensions of the behavior (e.g., frequency
and duration) to identify the most relevant dimen-
sions and to then wean over the course of observa-
tions as the analysis identifies the most important
dimensions. For example, in a classroom situation
involving academic performance, it may be useful to
count the number of math problems completed cor-
rectly, latency to initiate the task (and each prob-
lem), and the time spent on each problem. If after
several observations the observer finds that it takes
a while for the child to initiate the task, resulting
in a low number of problems completed, focusing
on measuring latency to initiate the task and fre-
quency of correct responses may be useful. Next, we
describe data collection procedures related to differ-
ent dimensions of behavior. Although we discuss
the procedures separately, various combinations of
these procedures may produce important data for
analysis that would not be apparent with a focus on
a single procedure.
Frequency. Perhaps the most common form of
continuous recording is frequency recording: count-
ing the number of occurrences of the target behavior
in the observation period (Mozingo et al., 2006).
Frequency recording is most appropriate when
the behavior occurs in discrete units with fairly
consistent durations. In frequency recording, each
occurrence of the target behavior (defined by the
onset and offset of the behavior) is recorded in the
observation period. Frequency data may be reported
as total frequency—number of responses per obser-
vation session—or converted to rate—number of
responses per unit of time (e.g., responses per min-
ute). Total frequency would only be reported if the
observation periods were of the same duration over
time. The advantage of reporting rate is that the
measure is equivalent across observation periods of
different durations.
Frequency recording requires the identification of
a clear onset and offset of the target behavior so each
instance can be counted. It has been used with a
wide range of target behavior when the number of
responses is the most important characteristic of the
behavior. Examples include recording the frequency
of tics (Miltenberger, Woods, & Himle, 2007), greet-
ings (Therrien, Wilder, Rodriguez, & Wine, 2005),
requests (Marckel, Neef, & Ferreri, 2006), and math-
ematics problems completed (Mayfield & Vollmer,
2007). When it is difficult to discriminate the onset
or offset of the behavior or the behavior occurs at
high rates such that instances of the behavior cannot
be counted accurately (e.g., high-frequency tics or
stereotypic behavior), a behavior sampling procedure
(i.e., interval or time-sample recording; see below) is
a more appropriate recording procedure. As we elab-
orate on later, in sampling procedures the behavior is
recorded as occurring or not occurring within con-
secutive or nonconsecutive intervals of time, but
individual responses are not counted.
Four additional methods of recording frequency
are frequency-within-interval recording, real-time
recording, cumulative frequency, and percentage of
opportunities. Each method has advantages over a
straight frequency count.
Frequency-within-interval recording. One limi-
tation of frequency recording is that it does not
Co
py
ri
gh
t
Am
er
ic
an
P
sy
ch
ol
og
ic
al
A
ss
oc
ia
ti
on
.
No
t
fo
r
fu
rt
he
r
di
st
ri
bu
ti
on
.
Miltenberger and Weil
134
provide information on the timing of the responses
in the observation period. With frequency-within-
interval recording, the frequency of the behavior is
recorded within consecutive intervals of time to
indicate when the behavior occurred within the
observation period. To conduct frequency-within-
interval recording, the data sheet is divided into con-
secutive intervals, a timing device cues the observer
to the appropriate interval, and the observer records
each occurrence of the behavior in the appropriate
interval. By providing information on the number of
responses and the timing of responses, more precise
measures of IOA can be calculated.
Real-time recording. Combining features of fre-
quency and duration procedures, real-time recording
also allows the researcher to collect information
on the temporal distribution of the target behavior
over the course of an observation period (Kahng &
Iwata, 1998; Miltenberger, Rapp, & Long, 1999).
Through use of either video playback or computers
in real time, it is possible to record the exact time of
onset and offset of each occurrence of the behavior.
For discrete momentary responses that occur for 1
second or less, the onset and offset are recorded in
the same second.
Real-time recording is especially valuable when
conducting within-session analysis of behavioral
sequences or antecedent–behavior–consequence rela-
tions. Borrero and Borrero (2008) conducted real-
time observations that included the recording of both
target behavior and precursor behavior or events
related to the target behavior. These data were then
used to construct a moment-to-moment analysis (lag-
sequential analysis) that provided probability values
for the occurrence of the precursor given the target
behavior and of the target behavior given the precur-
sor. The probability of a precursor reliably increased
approximately 1 second before the emission of the
target behavior. In addition, the probability of the tar-
get behavior was greatest within 1 second after the
precursor behavior or event. The real-time analysis
suggested that the precursor behavior or event was a
reliable predictor of the target behavior. Additional
analysis showed that both the precursor behavior and
the target behavior served the same function (e.g.,
both led to escape from demands).
Cumulative frequency. The origins of measuring
operant behavior involved the use of an electrome-
chanical data recording procedure that was designed
to record instances of behavior cumulatively across
time (Skinner, 1956). Each response produced an
uptick in the data path as the pen moved across
the paper and the paper revolved around a drum.
The original paper records of this recording were
only about 6 inches wide, and thus the pen used to
record responses would, on reaching the top of the
paper, reset to the bottom of the paper and continue
recording the responses. Increasing slopes indicated
higher response rates; horizontal lines indicated an
absence of the response.
This apparatus for the automatic recording of
cumulative frequencies is no longer used, but the
usefulness of cumulative response measures persists.
In cumulative frequency graphs, data are displayed
as a function of time across the x-axis and cumula-
tive frequency along the y-axis. The frequency of
responses that occur in a given time period is added
to the frequency in the previous time period. Thus,
data presented in a cumulative record must either
maintain at a particular level (no new responses) or
increase (new responses) across time but never
decrease. The use of cumulative frequency plots
allows one to assess frequency and temporal pat-
terns of responding.
Percentage of opportunities. In some cases,
recording the occurrence of a response in relation
to a specific event or response opportunity is use-
ful. In such cases, the percentage of opportunities
with correct responses is more important than the
number of responses that occurred. For example, in
recording compliance with adult requests, the per-
centage of requests to which the child responds cor-
rectly is more important than the number of correct
responses. Ten instances of compliance are desirable
if 10 opportunities occur. However, 10 instances
of compliance are much less desirable in relation
to 30 opportunities. Other examples include the
percentage of math problems completed correctly,
percentage of free throws made in a basketball game,
percentage of signals detected on a radar screen dur-
ing a training exercise, and percentage of trials in
which an item is labeled correctly during language
Co
py
ri
gh
t
Am
er
ic
an
P
sy
ch
ol
og
ic
al
A
ss
oc
ia
ti
on
.
No
t
fo
r
fu
rt
he
r
di
st
ri
bu
ti
on
.
Observation and Measurement in Behavior Analysis
135
training. Considering that the number of opportuni-
ties might vary in each of these cases, the percentage
of opportunities is a more sensitive measure of the
behavior than a simple frequency count or a rate
measure.
When a percentage-of-opportunities measure is
used, reporting the number of opportunities as well
as the percentage of correct responses is important.
If the number of opportunities is substantively dif-
ferent across observations, it may affect the variabil-
ity of the data and the interpretation of the results.
For instance, if on one occasion a child is provided
with 10 spelling words and spells eight correctly, the
result is 80% correct. The next day, if the two words
spelled incorrectly are retested and the child spells
one of the words correctly, the second performance
result is 50% correct. These data are not comparable
because the number of opportunities varied greatly,
and inappropriate conclusions could be drawn from
the results if only percentages were reported. In
these instances, providing an indicator of the num-
ber of opportunities to respond in the graphical rep-
resentation of the data will assist the reader in
interpreting the results.
Duration. When each response lasts for an
extended period of time or does not lend itself to a
frequency count (e.g., as in behavior such as read-
ing or play), it may be useful to record the duration
of the behavior, that is, the time from its onset to
its offset. Duration recording is desirable when the
most important aspect of the behavior is the length
of time for which it occurs. For example, if the
interest were in sustained performance or time on
task, duration recording is appropriate. If classroom
teachers are concerned with sustained engagement
in academic activities, the observer would identify
the length of time that engagement is desired (such
as in reading) and collect data on the duration of
engagement to identify any discrepancy between
the target duration and actual performance. Once a
discrepancy is determined to exist, programming for
successively longer durations could be initiated.
Other situations involve a combination of dura-
tion and frequency recording, as when the goal is to
decrease a young child’s tantrum behavior. If tan-
trums occur multiple times per day and each tantrum
continues for a number of minutes, recording both
frequency and duration will reveal whether tan-
trums are occurring less often and occurring for
shorter periods of time after intervention.
Finally, many types of behavior targeted in
applied work do not lend themselves readily to fre-
quency counts because they consist of (a) responses
that occur rapidly and repetitively over extended
periods of time (such as stereotypic behavior),
(b) complexes of discrete responses integrated into
chains or other higher order units, or (c) both. For
rapid, repetitive responses, for which each onset and
offset is not easily discriminated, a duration measure
can be used. In such cases, a time period in which
the behavior is absent can help the observer discrim-
inate the end of one episode and the start of the next.
For target behavior consisting of multiple compo-
nent behaviors, the target behavior might be defined
as the entire chain, and a duration measure would
then consist of recording the time from the onset of
the first response in the chain to the offset of the last
response in the chain. Finally, in some instances
duration is used to measure a behavior with multiple
component responses when it does not make sense
to reduce the behavior to a frequency count of its
component responses. For example, duration of play
would be of greater interest to a parent trying to
increase a child’s play time than would a frequency
count of the number of steps the child traveled
across the playground, went up and down a slide, or
moved back and forth on a swing.
Latency. Latency is the length of time from the pre-
sentation of a discriminative stimulus to the initia-
tion of the behavior. Latency is of interest when the
speed of initiation of the behavior is an important
feature. For example, latency is the time from the
sound of the starter’s pistol to the sprinter’s move-
ment off the starting blocks, the time it takes for
a child to initiate a task after the teacher’s request,
or the time it takes the wait staff at a restaurant to
respond once a customer is seated.
When working with a child who does not com-
plete math problems in the allotted time, for exam-
ple, latency indicates how long it takes the child to
initiate the task. By contrast, duration assesses how
long it takes the child to complete each problem
Co
py
ri
gh
t
Am
er
ic
an
P
sy
ch
ol
og
ic
al
A
ss
oc
ia
ti
on
.
No
t
fo
r
fu
rt
he
r
di
st
ri
bu
ti
on
.
Miltenberger and Weil
136
once he or she starts working on it. Depending on
the child and the circumstance, one or both dimen-
sions may be an important focus of assessment and
intervention.
Magnitude. On occasion, evaluating the magni-
tude or intensity of behavior is useful. One example
of response magnitude is the force exerted (e.g.,
muscle flexion), and another is the loudness of a
verbal response (as measured in decibels). Although
decreases in frequency, and perhaps duration, of
undesirable behaviors such as tantrums or self-
injury are important, a reduction in magnitude may
be an important initial goal. In some cases, reduc-
tions in magnitude may be observed before substan-
tial decreases occur on other dimensions, such as
frequency and duration. Alternatively, magnitude
may increase temporarily during an extinction burst
before the behavior decreases in frequency, duration,
or intensity.
Recording magnitude may be valuable when
considering recovery from an accident or injury
such as a knee injury for a football player. Measure-
ment would pertain to the ability of the affected
muscles to exert force after rehabilitation. In these
situations, recording magnitude tends to require
equipment such as that used by physical therapists
to evaluate force.
Direct observation of response magnitude may
not always measure force, however. Observers can
use intensity rating scales to evaluate the magnitude
of a response. For instance, given a scale ranging
from 1 to 10, a teacher may rate the intensity of each
occurrence of an undesirable behavior. In using rat-
ing scales, it is important to anchor the points
within the scale such that two observers can agree
on the level of intensity given a variety of occur-
rences of the behavior (e.g., 1 = mild whining, 10 =
loud screaming, throwing items, and head banging).
Although anchoring categories on a scale is consid-
ered valuable to decrease the variability in respond-
ing across observers, the literature is not clear as to
how many individual categories need be defined
(Pedhazur & Schmelkin, 1991). Another example in
which magnitude can be measured with a rating
scale is the intensity of a fear response (Milten-
berger, Wright, & Fuqua, 1986; Twohig, Masuda,
Varra, & Hayes, 2005) or other emotional responses
(Stickney & Miltenberger, 1999). In general, inten-
sity rating scales present issues of both reliability
and validity because the ratings that might be
assigned to specific instances of behavior may be
ambiguous; this is especially true when rating fear
or emotional responses because the magnitude of
these behaviors can be rated only by the individual
engaging in the behavior.
Sampling Procedures
It may not always be possible to collect adequate
information on the target behavior using continuous
recording procedures. When the onset and offset of
each instance of the behavior cannot be identified,
continuous recording is not possible. Likewise, the
constraints imposed by some environments, some
target behaviors, or some observers may make con-
tinuous recording impossible. For example, the
person exhibiting the target behavior might not be
continuously in sight of the observer, the target
behavior might occur almost exclusively when the
individual is alone, or the observer might have other
responsibilities that compete with observation. In
these instances, it may be desirable, and necessary,
to collect samples of the behavior that provide an
estimate of the behavior’s true level. Behavior-
sampling procedures include interval recording and
time-sample recording. In both procedures, the
observation period is divided into smaller units of
time, and the observer records whether the behavior
occurred in each interval.
Interval recording. Interval recording involves
dividing the observation period into equal consecu-
tive intervals and recording whether the behavior
occurred in each. Interval recording is different
than frequency recording or frequency-within-
interval recording in that an interval is scored once
regardless of whether a single instance or multiple
instances of a behavior occurred during the interval.
In behavior analysis research, intervals are usually
short—typically 10 to 15 seconds (DiGennaro et al.,
2007; Mace et al., 2009). Short intervals (usually
less than 20 seconds) are valuable when behavior
occurs at moderate to high frequencies or when
multiple topographies of behavior are recorded.
Co
py
ri
gh
t
Am
er
ic
an
P
sy
ch
ol
og
ic
al
A
ss
oc
ia
ti
on
.
No
t
fo
r
fu
rt
he
r
di
st
ri
bu
ti
on
.
Observation and Measurement in Behavior Analysis
137
Valuable too are shorter intervals when temporal
correlations may yield information on antecedent
events and potential maintaining consequences.
When interested in the relation between the target
behavior and antecedents and consequences, the
observer records whether any of the three events
occurred in each interval to examine the temporal
patterns of the behavior and its potential controlling
variables (e.g., Repp & Karsh, 1994). An additional
condition under which shorter intervals are valuable
is when an understanding of within-session tem-
poral distribution of the behavior is necessary. For
example, to determine whether self-injurious behav-
ior is high in a functional analysis condition because
of an extinction burst, the behavior analyst identi-
fies whether more intervals were scored early in the
session than later in the session (Vollmer, Marcus,
Ringdahl, & Roane, 1995). Similar patterns could be
discerned with cumulative frequency recording or
real-time recording as well.
In some applied settings, however, intervals
might be much longer—perhaps 15 or 30 minutes
(Aikman & Garbutt, 2003)—when behavior occurs
less frequently. Under these conditions, it may be
difficult to draw useful correlations between ante-
cedent and consequent events and the behavior as
well as behavior–behavior relations. Such limita-
tions notwithstanding, longer intervals are typically
used for the convenience of data collectors (often
participant observers) who can engage in other
responsibilities and still collect data.
Typically, the observer has a data sheet with con-
secutive intervals designated for recording, and dur-
ing the observation period, the observer is prompted
with auditory (through headphones so as to not dis-
rupt the ongoing behavior of the observee) or tactile
(vibration) cues delivered via a timing device to
move from interval to interval while observing and
recording the target behavior. As time passes, the
observer records the occurrence of the target behav-
ior in the appropriate interval; a blank interval indi-
cates the nonoccurrence of the behavior in that
interval. In some cases, a computer is used for data
collection, and as the observer records the behavior,
the software puts the data into the proper interval.
At the end of the observation period, the number of
intervals in which the behavior is observed is
divided by the number of observation intervals, and
the result is reported as the percentage of intervals
in which the behavior occurred. A similar process is
used for time-sample recording (described in the
next section).
The two types of interval recording procedures
are partial-interval recording and whole-interval
recording. In partial-interval recording, the observer
records the occurrence of the target behavior if it
occurred at any time within the interval. That is, the
interval is scored if the target behavior occurred
briefly in the interval or throughout the entire inter-
val. Furthermore, if the onset of the behavior occurs
in one interval and its offset occurs in the next, both
intervals are scored (e.g., Meidinger et al., 2005).
In whole-interval recording, the interval is scored
only if the target behavior occurred throughout the
entire interval. Whole-interval recording is more
useful with continuous behavior (e.g., play) than
with discrete or quickly occurring behavior (e.g., a
face slap). Typically, whole-interval recording is
used when a behavior occurs over longer periods of
time, as might be seen with noncompliant behavior
or on-task behavior. For example, Athens, Vollmer,
and St. Peter Pipkin (2007) recorded duration of on-
task behavior in 3-second intervals only if the
behavior was present for the entire interval.
Time-sample recording. In time-sample record-
ing, the observation period is divided into intervals
of time, but observation intervals are separated by
periods without observation. Time-sample recording
permits the observer to focus on other tasks when
not observing the target behavior. For example, the
observation period might be divided into 15-second
intervals, but observation occurs only at the end of
the interval. Likewise, an observation period might
be divided into 30-minute intervals, but observa-
tion and recording occur only in the last 5 minutes
of every 30 minutes. These intervals can be equally
divided, as when an observation occurs every 15
minutes, or variably divided to provide some flexi-
bility for the observer (such as a teacher who cannot
observe exactly on the quarter hour). The data are
displayed as a percentage (the number of intervals
with target behavior divided by the number of inter-
vals of observation).
Co
py
ri
gh
t
Am
er
ic
an
P
sy
ch
ol
og
ic
al
A
ss
oc
ia
ti
on
.
No
t
fo
r
fu
rt
he
r
di
st
ri
bu
ti
on
.
Miltenberger and Weil
138
For instance, if evaluating the extent of social
interactions between adolescents on a wing of an
inpatient psychiatric facility were desirable, con-
ducting observations every 15 minutes might be
possible. In this example, the observer would be
engaged in a job-related activity and, when
prompted by a timer, look up from his or her work,
note whether the target behavior was occurring, and
record the result. Data of this sort could identify
which of the adolescents tend to engage in social
interactions and the typical times at which social
interactions are likely to occur. From this sampling
approach, it is possible to refine the data collection
process toward a more precise measure of behavior.
Interval and time-sample recording have benefits
and limitations. The benefit of interval recording is
that with consecutive observation intervals, no
instance of the target behavior is missed during the
observation period. The limitation, especially with
shorter intervals, is that it requires the continu-
ous attention of, and frequent recording by, the
observer, making it difficult for the observer to
engage in other activities during the observation
period. A limitation of time-sample recording is that
because observation intervals are separated by peri-
ods without observation, some instances of the tar-
get behavior may be missed during the observation
period. However, a benefit is that the observer can
engage in other activities during the periods
between observation intervals, making the proce-
dure more user friendly for participant observers
such as teachers or parents.
Although interval and time-sample recording
procedures are used widely in behavior-analytic
research, some authors have cautioned that the
results of these sampling procedures might not
always correspond highly with data collected
through continuous recording procedures in which
every behavioral event is recorded (e.g., Rapp et al.,
2007; Rapp, Colby-Dirksen, Michalski, Carroll, &
Lindenberg, 2008). In summarizing the numerous
studies that have compared interval and time-
sample recording with continuous recording proce-
dures, Rapp et al. (2008) concluded that interval
recording tends to overestimate the duration of the
behavior, time-sample procedures with small inter-
vals tend to produce accurate estimates of duration,
and interval recording with small intervals tends to
produce fairly accurate estimates of frequency.
Although Rapp et al. provided several suggestions to
guide decision making regarding the use of interval
and time-sample procedures, they concluded by
suggesting that small interval sizes in interval and
time-sample procedures are likely to produce the
best results.
Product Recording
In some cases, the outcome or the product of the
behavior may be of interest, either as a primary
dependent variable or as a complement to direct
observation of the behavior itself. When the behav-
ior changes the physical environment, this product
can be recorded as an index of the occurrence of the
behavior. In some instances, collecting data on
products is valuable because measuring the behavior
directly may not be possible. For example, weight is
measured in weight-loss programs because measur-
ing the behavior that produces weight loss (i.e., diet
and exercise) is usually not feasible. Examples of
product recording may include number of academic
problems completed or number of units assembled
in a factory. In each case, the occurrence of the
behavior is not observed directly; rather, the prod-
ucts of the behavior are recorded as an indication of
its occurrence. In such cases, a focus on the prod-
ucts of behavior is easier and more efficient than
recording the behavioral events as they occur. An
important note in recording permanent products is
that although the focus is on results, if the results
fall short of expected quantity or quality, the focus
can then turn to evaluation of the behavior involved
in producing the products being measured (Daniels
& Daniels, 2004).
Beyond measuring the production of tangible
items, product recording can be used to measure the
physical damage caused by a problem behavior. For
example, self-injurious behavior can produce tissue
damage such as bruises, lacerations, or other bodily
injuries, and product recording could be used to
assess the severity of these injuries. Iwata, Pace,
Kissel, Nau, and Farber (1990) developed the Self-
Injury Trauma Scale to quantify surface injury
resulting from self-injurious behavior. Other exam-
ples of this type of product recording include the
Co
py
ri
gh
t
Am
er
ic
an
P
sy
ch
ol
og
ic
al
A
ss
oc
ia
ti
on
.
No
t
fo
r
fu
rt
he
r
di
st
ri
bu
ti
on
.
Observation and Measurement in Behavior Analysis
139
assessment of the size of a bald area related to
chronic hair pulling (Rapp, Miltenberger, & Long,
1998; Rapp, Miltenberger, Long, Elliott, & Lumley,
1998) or the length of fingernails as a measure of
nail biting (Flessner et al., 2005; Long, Milten-
berger, Ellingson, & Ott, 1999). Still other examples
of product recording include a measure of weight or
body mass index as an indication of changes in eat-
ing (Donaldson & Normand, 2009; see also Young
et al., 2006), measuring chemicals in urine samples
as a measure of drug ingestion (Silverman et al.,
2007), or weighing food before and after a feeding
session to assess the amount of food consumed
(Kerwin, Ahearn, Eicher, & Swearingin, 1998;
Maglieri, DeLeon, Rodriguez-Catter, & Sevin, 2000;
Patel, Piazza, Layer, Colemen, & Swartzwelder, 2005).
An advantage of product recording is that the
observer does not have to be present to record the
occurrence of the behavior (Miltenberger, 2012)
because the product can be recorded at a more con-
venient time after the behavior has occurred (e.g., at
the end of the class period or after the shift in a fac-
tory). A drawback of product recording, especially
when used with a group of individuals, is that it
might not be possible to determine which person
engaged in the behavior that resulted in the product.
Perhaps another student completed the academic
problems or another worker helped produce the
units in the factory (Jessup & Stahelski, 1999).
Although product recording is valuable when the
interest is in the tangible outcome of the behavior,
there must be some way to determine which indi-
vidual was responsible for the products being mea-
sured (e.g., did the urine sample come from the
client or someone else?). Another potential problem
with some uses of product recording is that it may
not identify the behavior that resulted in the prod-
uct. For example, correct answers to math problems
may have been produced by cheating, and weight
loss may have been produced through self-induced
vomiting rather than an increase in exercise or a
reduction in calorie consumption.
Recording Devices
Once the appropriate recording procedure has been
chosen, the next step is to choose a recording
device. Because the observer must record instances
of the behavior as they occur, the observer’s behav-
ior must result in a product that can be used later
for purposes of analysis. A recording device allows
the observer to produce a permanent product from
the observation session. The most commonly used
recording device is a data sheet structured for the
type of recording procedure being conducted.
Figures 6.1, 6.2, and 6.3 show sample data sheets
structured for frequency recording, duration record-
ing, and interval recording, respectively.
Although data sheets are used most often for data
collection, other recording devices, both low tech
and high tech, can be used to record instances of
the behavior. Several types of low-tech recording
devices have been used, such as wrist counters
for frequency recording (Lindsley, 1968) or stop
watches for duration recording. Still other possibili-
ties include activities as simple as moving beads
from one side of a string to the other, placing a coin
from one pocket to another, making small tears in a
piece of paper, or making a hash mark on a piece
of masking tape affixed to the recorder’s sleeve to
record frequency (Miltenberger, 2012). In fact, it is
feasible to record frequency with whatever may be
available in the environment as long as the observer
can produce a product that represents the occur-
rence of the behavior.
Although recording on a data sheet is the most
frequently used data collection process, with rapidly
changing technologies there is a move to identify
high-tech methods to streamline and automate data
collection (Connell & Witt, 2004; Jackson & Dixon,
2007; Kahng & Iwata, 1998). In applied behavior
analysis research, electronic devices such as a per-
sonal digital assistant (Fogel, Miltenberger, Graves,
& Koehler, 2010) or hand-held or laptop computers
(Gravlee, Zenk, Woods, Rowe, & Schulz, 2006;
Kahng & Iwata, 1998; Repp, Karsh, Felce, &
Ludewig, 1989) are frequently used for data collec-
tion. In addition, the use of bar codes and scanners
(Saunders, Saunders, & Saunders, 1993) for data
collection has been reported. With bar code scan-
ners, an observer holds a small battery-powered
scanning device and a sheet of paper with the bar
codes ordered according to behavioral topography.
When the target behavior is observed, the data col-
lector scans the relevant bar code to record the
Co
py
ri
gh
t
Am
er
ic
an
P
sy
ch
ol
og
ic
al
A
ss
oc
ia
ti
on
.
No
t
fo
r
fu
rt
he
r
di
st
ri
bu
ti
on
.
Miltenberger and Weil
140
occurrence of the behavior and the time within the
observation period. The use of bar codes is, how-
ever, only one of several ways to conduct electronic
recording of behavior.
In one investigation evaluating a shaping proce-
dure to increase the reach of a pole vaulter, a photo-
electric beam was used to determine the height of
the vaulter’s reach just after planting the pole for the
vault (Scott, Scott, & Goldwater, 1997). Another
high-tech method of data collection involves soft-
ware for cell phones. These software applications,
colloquially referred to as apps, allow behavior ana-
lysts to use the computing power of their phones
for data collection. The advantages of this technol-
ogy are numerous; however, the most obvious bene-
fits are the use of a small, portable device that can
Duration Data Form
Child: James M. Start Date: 9/15/2010 Setting: Mathematics
Observer: R.M. Primary/Reliability
Instructions: First, indicate date of observation in the far left
column. Second, identify the
start time (onset) and the stop time (offset) for each occurrence
of the behavior. Use more than
one line if necessary.
Definition of
behavior:_____________________________________________
____________
_____________________________________________________
_______________________
Date Onset Offset Onset Offset Onset Offset Onset Offset
DailyDuration
FIGURE 6.2. An example of a duration data sheet that provides
information
on the onset and offset of each occurrence of the behavior and
the frequency of
the behavior each day.
Frequency Data Form
Child: James M. Start Date: 9/15/2010 Setting: Mrs. Johnson’s
Class
Observer: R.M. Primary/Reliability
Instructions: First, indicate date of observation in the far left
column. Second, place a tick
mark for each occurrence of behavior during the specified
academic activity for that day.
Definition of
behavior:_____________________________________________
____________
_____________________________________________________
_______________________
Date CircleTime Mathematics
Individual
Reading
Social
Studies Science Writing
Daily
Total
FIGURE 6.1. Example of a daily frequency data sheet that
involves a break-
down of the frequency of the behavior by curricular areas in a
general education
classroom setting.
Co
py
ri
gh
t
Am
er
ic
an
P
sy
ch
ol
og
ic
al
A
ss
oc
ia
ti
on
.
No
t
fo
r
fu
rt
he
r
di
st
ri
bu
ti
on
.
Observation and Measurement in Behavior Analysis
141
facilitate any form of data collection mentioned thus
far and the ability to graph the data. Finally, these
graphs can be sent via text message to parents,
teachers, or colleagues (Maher, 2009). Undoubtedly,
as technology advances, even more high-tech data
collection methods will emerge.
Reactivity of Observation
A long-standing concern for behavioral researchers
is how observation affects performance (e.g., Par-
sons, 1974). Reactivity is the term used to describe
changes in behavior resulting from the act of observ-
ing and recording the behavior. Typically, when
reactivity occurs, the behavior changes in the
desired direction (e.g., Brackett, Reid, & Green,
2007; Mowery et al., 2010). Several researchers have
evaluated the effects of staff reactivity to observa-
tions (Boyce & Geller, 2001; Brackett et al., 2007;
Codding, Livanis, Pace, & Vaca, 2008; Mowery
et al., 2010). Mowery et al. (2010) evaluated staff
adherence to a protocol designed to increase the fre-
quency of staff’s positive social initiations during lei-
sure activities with adults with developmental
disabilities. They evaluated the effects on staff
behavior of having a supervisor absent or a supervi-
sor present in the environment to determine
whether reactivity to the supervisor’s presence
would occur. Positive social interactions only
Interval Data Form
Child: James M. Date: 9/15/2010 Setting: Mathematics
Observer: R.M. Primary/Reliability
Instructions: Place a check mark in the appropriate column to
reflect the events that occurred
in each 10–s interval.
Definition of
behavior:_____________________________________________
____________
_____________________________________________________
_______________________
10-s
Intervals
Demand
Placed Aggression Attention Ignore Escape
1
2
3
4
5
6
7
8
9
10
11
12
13
14
15
16
17
18
19
20
21
22
23
24
25
26
27
28
29
30
FIGURE 6.3. An example of a 10-second interval data sheet
(partial or
whole) that provides information on the occurrence of the target
behavior
and probable antecedents and consequences. In this example,
the hypothesis
is that the aggressive behavior occurs after the delivery of a
demand by the
teacher. In addition, potential responses by the teacher to the
problem behav-
ior are included. When completed, this data sheet will provide
information
on the temporal relationship between teacher behavior and
student problem
behavior.
Co
py
ri
gh
t
Am
er
ic
an
P
sy
ch
ol
og
ic
al
A
ss
oc
ia
ti
on
.
No
t
fo
r
fu
rt
he
r
di
st
ri
bu
ti
on
.
Miltenberger and Weil
142
occurred at acceptable levels when the supervisor
was present, suggesting that reactivity is an impor-
tant issue to consider in the valid assessment of staff
performance.
Considering reactivity to observation in research
or clinical settings is important because the target
behavior may be influenced not only by the inter-
vention but also by the act of observing. When
responding comes under the stimulus control of an
observer, the level of behavior in the presence of the
observer is likely to be different than in the absence
of the observer. Considering that most staff behavior
must be performed in the absence of supervision,
conducting observations without reactivity to obtain
an accurate characterization of the behavior is
important. There are a variety of ways in which to
minimize reactivity. For instance, making observers
a part of the regular environment for several ses-
sions or weeks before actual data collection occurs
may result in habituation to the presence of the
observers. It is important to keep in mind that habit-
uation to the observer is only likely to occur as long
as the observer does not interact with the person
being observed and no consequences are delivered
by the observer or others who may be associated
with the observer.
If the setting permits, reactivity may be avoided
in other ways. Video monitoring devices mounted
unobtrusively in the setting may be used. In
instances in which the cameras can be seen by the
person being observed, habituation to the presence
of the camera is likely to occur in the absence of
feedback or consequences contingent on perfor-
mance (e.g., Rapp, Miltenberger, Long, et al., 1998).
In addition, using an observation room equipped
with a one-way observation window provides the
observer an opportunity to conduct unannounced
observations. If the use of an observation window is
not possible, the use of confederates may be consid-
ered. Although confederates are present in the set-
ting to collect data (unobtrusively), a benign
purpose for their presence other than data collection
is provided to those being observed. That is, decep-
tion is used to conceal the true purpose of the
observers’ presence. As mentioned in the Mowery
et al. (2010) study, confederates may be used to
increase the chances that the data collected are
representative of typical levels (the level expected in
the absence of observation). Confederates can be
any variety of individuals such as a coworker, class-
mate, spouse, or person external to the setting as
seen in Mowery et al. (2010), in which observers
were introduced as student social workers who were
in the setting to observe individuals with intellectual
disabilities.
In recent research on abduction prevention, chil-
dren were observed without their knowledge to
assess their safety skills as a confederate approached
and attempted to lure them in a store setting (Beck
& Miltenberger, 2009). Research on child safety
skills training has demonstrated that children are
more likely to respond correctly when they are
aware of observation than when they are not aware
of observation (Gatheridge et al., 2004; Himle,
Miltenberger, Gatheridge, & Flessner, 2004). An
important caveat is that the use of confederates may
raise ethical concerns and should be approached
cautiously. The use of video or other inconspicuous
monitoring systems may present the same ethical
concerns and thus should also be approached with
caution. Prior approval is needed when using decep-
tive covert observation. Additionally, for research
purposes such covert observation must be approved
by an institutional review board with appropriate
debriefing afterward.
INTEROBSERVER AGREEMENT
Within research and practice in applied behavior
analysis, accurate data collection is important (see
Chapter 7, this volume). Accuracy refers to the
extent to which the recorded level of the behavior
matches the true level of the behavior (Cooper et al.,
2007; Johnston & Pennypacker, 1993; Kazdin,
1977). To evaluate accuracy, a researcher must be
able to obtain a measure of the true level of the
behavior to compare with the measurement of the
behavior produced by the observer. The difficulty
arises in obtaining the true level of the behavior, as
most recording is done by humans who must dis-
criminate the occurrence of the behavior from non-
occurrences (a stimulus–control problem). A “truer”
level of the behavior may be obtained through
mechanical means, but equipment also may fail
Co
py
ri
gh
t
Am
er
ic
an
P
sy
ch
ol
og
ic
al
A
ss
oc
ia
ti
on
.
No
t
fo
r
fu
rt
he
r
di
st
ri
bu
ti
on
.
Observation and Measurement in Behavior Analysis
143
on occasion and produce errors. Alternatively,
automated recording devices may fail to register
responses that vary slightly in topography or loca-
tion. Thus, knowing the true level of the behavior
with certainty is impossible, and therefore accuracy
is not measured in behavioral research.
Instead, behavior analysts train observers so that
the data they collect are in agreement with those
collected by another observer who has received
training in recording the target behavior. Although
measuring agreement between observers provides
no information about the accuracy of either set of
observations, it does improve the believability of the
data. That is, when two independent observers agree
on every occurrence and nonoccurrence of behavior,
one has more confidence that they are using the
same definition of the target behavior, observing and
recording the same responses, and marking the form
correctly (Miltenberger, 2012). If a valid definition
of the behavior of interest is being used, then high
agreement scores increase the belief that the behav-
ior has been recorded accurately; although, again,
accuracy has not been measured.
A frequently used measure of agreement between
observers is simply the percentage of observations
that agree, a measure commonly referred to as IOA.
IOA is calculated by dividing the number of agree-
ments (both observers recorded the occurrence or
nonoccurrence of the behavior) by the number of
agreements plus disagreements (one observer
recorded the occurrence of the behavior and the
other recorded the nonoccurrence of the behavior)
and multiplying the quotient by 100. For an ade-
quate assessment of IOA, two independent data col-
lectors are recommended to be present during at
least one third of all observation sessions across all
participants and phases of a clinical intervention or
research study (Cooper et al., 2007). This level of
IOA assessment (one third of sessions) is an arbi-
trary number, and efforts to maximize the number
of assessments that produce strong percentages of
agreement should result in greater confidence in
the data.
Cooper et al. (2007) suggested that research
studies maintain 90% or higher IOA but agreed
that 80% or higher may be acceptable under some
circumstances. Kazdin (2010) offered a different
perspective on the acceptable level of IOA and sug-
gested that the
level of agreement that is acceptable is
one that indicates to the researcher that
the observers are sufficiently consistent
in their recording of the behavior, that
the behaviors are adequately defined,
and that the measures will be sensitive to
change in the client’s performance over
time. (p. 118)
Kazdin suggested that the number and complexity
of behaviors being recorded, possible sources of
bias, expected level of change in the behavior, and
method of computing IOA are all considerations in
deciding on an acceptable level of IOA. For example,
if small changes in behavior are likely with the inter-
vention, then higher IOA would be demanded.
However, if larger changes are expected, then lower
levels of IOA might be tolerated. The bottom line is
that behavior analysts should strive for levels of IOA
as high as possible (e.g., 90% or more) but consider
the factors that might contribute to lower levels and
make adjustments as warranted by these factors.
IOA can be calculated in a variety of ways. How it
is computed depends on the dimension of the behav-
ior being evaluated and how it is measured. Next we
describe common methods for calculating IOA.
Frequency Recording
To calculate IOA on frequency recording, the
smaller frequency is divided by the larger frequency.
For example, if one observer records 40 occurrences
of a target behavior and a second independent
observer records 35, the percentage of IOA during
that observation session is 35/40, or 87.5%. The lim-
itation of IOA in frequency recording is that there is
no evidence that the two observers recorded the
same behavioral event even when IOA is high. For
example, if one observer recorded nine instances of
the behavior and the other observer recorded 10
instances, the two observers ostensibly agreed on
nine of the 10 instances for an IOA of 90%. It is pos-
sible, however, that the observers were actually
recording different instances of the behavior. One
way to increase confidence that the two observers
were agreeing on specific responses in frequency
Co
py
ri
gh
t
Am
er
ic
an
P
sy
ch
ol
og
ic
al
A
ss
oc
ia
ti
on
.
No
t
fo
r
fu
rt
he
r
di
st
ri
bu
ti
on
.
Miltenberger and Weil
144
IOA is to collect frequency data in intervals and
then compare the frequency in each interval (see
Frequency Within Interval section later in this
chapter). Dividing the observation period into
shorter, equal intervals permits a closer look at the
recording of frequencies in shorter time blocks. In
this way, there can be more confidence that the
observers recorded the same instances of the behav-
ior when agreement is high. To further enhance
confidence that observers are recording the same
behavioral events, it is possible to collect data on
behavior as it occurs in real time. With real-time
recording, it is possible to determine whether there
is exact agreement on each instance of the behavior.
Real-Time Recording
When using real-time recording, the onset and offset
of the behavior are recorded on a second-by-second
basis. Therefore, IOA can be calculated by dividing
the number of seconds in which the two observers
agreed that the behavior was or was not occurring
by the number of seconds in the observation ses-
sion. Typically, an agreement on the onset and offset
of the behavior can be defined as occurring when
both observers recorded the onset or offset at exactly
the same second. This form of IOA is the most strin-
gent because agreement is calculated for every sec-
ond of the observation period (e.g., Rapp,
Miltenberger, & Long, 1998; Rapp, Miltenberger,
Long, et al., 1998). Alternatively, IOA could be con-
ducted on the frequency of the behavior, but an
agreement would only be scored when both observ-
ers recorded the onset of the behavior at the same
instant or within a small window of time (e.g.,
within 1 or 2 seconds of each other).
Duration Recording
IOA for duration recording is calculated by dividing
the smaller duration by the larger duration. For
example, if one observer records 90 minutes of
break time taken in an 8-hour shift and the reliabil-
ity observer records 85 minutes, the agreement
between observers is 85/90, or 94.4%. The same lim-
itation described earlier for IOA on frequency
recording pertains to IOA on duration recording.
Although the duration recorded by the two observ-
ers may be similar, unless the data are time stamped,
there is no evidence that the two observers were
recording the same instances of the behavior. Real-
time recording is a way to overcome this problem.
Interval and Time-Sample Recording
Computing IOA with interval data requires an interval-
by-interval check for agreement on the occurrence
and nonoccurrence of the behavior throughout the
observation period. The number of intervals of agree-
ment is then divided by the number of intervals in the
observation period to produce a percentage of agree-
ment. An agreement is defined as an interval in which
both observers had a marked interval (indicating that
the behavior occurred) or an unmarked interval (indi-
cating that the behavior did not occur). Using only
one target behavior for this example, consider a
10-minute observation session with data recorded at
10-second intervals (60 intervals total). If the number
of intervals of observation with agreements is 56 of
60, the percentage of IOA is 56/60, or 93.3%.
Two variations of IOA calculations for interval
recording, which correct for chance agreement with
low-rate and high-rate behavior, are occurrence-
only and nonoccurrence-only calculations. The
occurrence-only calculation is used with low-rate
behavior (from which chance agreement on nonoc-
currence is high) and involves calculating IOA using
only agreements on occurrence and removing agree-
ments on nonoccurrence from consideration (agree-
ments on occurrence divided by agreements plus
disagreements on occurrence). The nonoccurrence-
only calculation is used with high-rate behavior
(from which chance agreement on occurrence is
high) and involves calculation of IOA using only
agreements on nonoccurrence and removing agree-
ments on occurrence from consideration (agree-
ments on nonoccurrence divided by agreements
plus disagreements on nonoccurrence).
Cohen’s Kappa
Kappa is another method of calculating observer
agreement, but it corrects for the probability that
two observers will agree as a result of chance alone.
Kappa is computed using the following formula:
−
−
P P
P
o c
c
1
,
Co
py
ri
gh
t
Am
er
ic
an
P
sy
ch
ol
og
ic
al
A
ss
oc
ia
ti
on
.
No
t
fo
r
fu
rt
he
r
di
st
ri
bu
ti
on
.
Observation and Measurement in Behavior Analysis
145
where Po is the proportion of agreement between
observers (sum of agreements on occurrences and
nonoccurrences divided by the total number of
intervals) and Pc is the proportion of agreement
expected by chance. The latter may be obtained
using the following formula:
P
I
c
o o n n=
2
,
where O1o is the number of occurrences recorded by
Observer 1, O2o is the number of occurrences
recorded by Observer 2; O1n and O2n are nonoccur-
rence counts, and I is the number of observations
made by each observer.
For example if Observer 1 scored nine intervals
out of 10 and Observer 2 scored eight intervals out of
10 (see Exhibit 6.1), kappa would be calculated as
follows: Po = .90; PC = (72 + 2)/102 = .74, κ = .62.
Kappa values can range from −1 to 1, with 0
reflecting a chance level of agreement. No single rule
for interpreting an obtained kappa value may be
given because the number of different categories
into which behavior may be classified will affect
kappa. If only two categories are used (e.g., occur-
rence vs. nonoccurrence), then the probability of a
chance agreement is higher than if more categories
had been used. Higher probabilities of chance agree-
ment are reflected in lower kappa values. Thus, if
the preceding example had used three categories
(e.g., slow-, medium-, or high-rate responding) and
IOA had been the same (90%), then kappa would
have been more than .62.
Kappa can be affected by other factors, including
the distribution of the ratings of the observers (Sim
& Wright, 2005). Because these latter factors have
little to do with the degree to which two observers
agree, there is little agreement on what constitutes
an acceptable kappa value. Within the social sci-
ences, Kazdin (2010) suggested that a kappa value
of 0.7 or higher reflects an acceptable level of agree-
ment. Lower criteria for acceptable kappa values
may be found (e.g., Fleiss, 1981; Landis & Koch,
1977), but these are as arbitrary as the cutoff sug-
gested by Kazdin (von Eye & von Eye, 2008). Per-
haps for this reason, kappa is less often used by
applied behavior analysts than is IOA.
Frequency Within Interval
Calculating IOA for frequency within interval mini-
mizes the limitation identified for IOA on frequency
recording (high agreement even though the two
observers might be recording different instances of
behavior). For example, if agreement is calculated
within each of a series of 20-second intervals, then
there is no chance that a response recorded by
Observer A in Interval 1 will be counted as an agree-
ment with a different response recorded by Observer
B in Interval 12. To calculate frequency-within-in-
terval agreement, calculate a percentage of agree-
ment between observers for each interval (smaller
number divided by larger number), sum the per-
centages for all the intervals, and divide by the num-
ber of intervals in the observation period. Exhibit 6.2
illustrates an IOA calculation for frequency-within-
interval data for 10 intervals for two observers. Each
X corresponds to an occurrence of the behavior in
an interval.
Ethical Considerations
Several ethical issues must be considered when con-
ducting observations and measurement as part of
research or clinical practice in applied behavior
analysis (e.g., Bailey & Burch, 2005). First, a behav-
ior analyst should observe and record the person’s
behavior only after receiving written consent from
the individual or the individual’s parent or guardian.
As part of the consent process, the individual must
be apprised of and agree to the ways in which the
data will be used (research presentation or publication,
Exhibit 6.1
Recordings for Observer 1 and Observer 2 in 10
Observation Intervals
Interval
1 2 3 4 5 6 7 8 9 10
Observer 1
X X X X X X X X X
Observer 2
X X X X X X X X
Co
py
ri
gh
t
Am
er
ic
an
P
sy
ch
ol
og
ic
al
A
ss
oc
ia
ti
on
.
No
t
fo
r
fu
rt
he
r
di
st
ri
bu
ti
on
.
Miltenberger and Weil
146
clinical decision making). If the behavior analyst
identifies new uses for the data after the original
consent has been obtained, new consent must be
obtained from the individual for the new ways in
which the data will be used. Second, the individual
must know when and where observation will take
place unless the individual provides written consent
for surreptitious or unannounced observation.
Third, observation and recording must take place in
such a way that confidentiality is maintained for the
individual receiving services or participating in
research. To maintain confidentiality, the observer
must not draw attention to the person being
observed and must not inform any other people
about the observations unless the individual being
observed has provided written permission to do so.
In addition, behavior analysts must use pseudonyms
and disguise other identifying information in pre-
sentations and publications. Fourth, observers must
treat the individual being observed and others in the
setting with dignity and respect at all times during
the course of their participation in research or as
they are receiving clinical services.
SUMMARy
Observation and measurement are at the heart of
applied behavior analysis because behavior (and its
controlling variables) is the subject matter of both
research and practice. As discussed in this chapter,
adequate measurement of behavior requires clear
definitions of the target behavior, precise specifica-
tions of recording logistics and procedures, appro-
priate choice of recording devices, and consideration
of reactivity and IOA. The validity of conclusions
that can be drawn from experimental manipulations
of controlling variables or evaluations of treatment
effectiveness depends on the adequacy of the obser-
vation and measurement of the behaviors targeted in
these endeavors.
References
Aikman, G., & Garbutt, V. (2003). Brief probes: A method
for analyzing the function of disruptive behaviour in
the natural environment. Behavioural and Cognitive
Psychotherapy, 31, 215–220. doi:10.1017/S1352465
803002108
Allen, K. D. (1998). The use of an enhanced simpli-
fied habit reversal procedure to reduce disruptive
outbursts during athletic performance. Journal of
Applied Behavior Analysis, 31, 489–492. doi:10.1901/
jaba.1998.31-489
Athens, E. S., Vollmer, T. R., & St. Peter Pipkin, C. C.
(2007). Shaping academic task engagement with
percentile schedules. Journal of Applied Behavior
Analysis, 40, 475–488. doi:10.1901/jaba.2007.40-475
Baer, D. M., Wolf, M. M., & Risley, T. R. (1968). Some
current dimensions of applied behavior analysis.
Journal of Applied Behavior Analysis, 1, 91–97.
doi:10.1901/jaba.1968.1-91
Bailey, J. S., & Burch, M. R. (2002). Research methods in
applied behavior analysis. Thousand Oaks, CA: Sage.
Exhibit 6.2
Frequency-Within-Interval Recordings for Two Observers
and Interobserver Agreement Calculation
Interval
1 2 3 4 5 6 7 8 9 10
Observer 1
XXX X XX XX X XXX XX
67% 100% 100% 100% 100% 100% 50% 100% 50% 100%
Observer 2
XX X XX XX XX XXX X
Note. Interobserver agreement = (67 + 100 + 100 + 100 + 100 +
100 +
50 + 100 + 50 + 100)/10 = 86.7%.
Co
py
ri
gh
t
Am
er
ic
an
P
sy
ch
ol
og
ic
al
A
ss
oc
ia
ti
on
.
No
t
fo
r
fu
rt
he
r
di
st
ri
bu
ti
on
.
Observation and Measurement in Behavior Analysis
147
Bailey, J. S., & Burch, M. R. (2005). Ethics for behavior
analysts. Mahwah, NJ: Erlbaum.
Beck, K. V., & Miltenberger, R. G. (2009). Evaluation of
a commercially available program and in situ train-
ing by parents to teach abduction-prevention skills
to children. Journal of Applied Behavior Analysis, 42,
761–772. doi:10.1901/jaba.2009.42-761
Borrero, C. S. W., & Borrero, J. C. (2008). Descriptive
and experimental analyses of potential precursors
to problem behavior. Journal of Applied Behavior
Analysis, 41, 83–96. doi:10.1901/jaba.2008.41-83
Bosch, A., Miltenberger, R. G., Gross, A., Knudson, P.,
& Brower-Breitweiser, C. (2008). Evaluation of
extinction as a functional treatment for binge eating.
Behavior Modification, 32, 556–576. doi:10.1177/
0145445507313271
Boyce, T. E., & Geller, E. S. (2001). A technology to mea-
sure multiple driving behaviors without self-report
or participant reactivity. Journal of Applied Behavior
Analysis, 34, 39–55. doi:10.1901/jaba.2001.34-39
Brackett, L., Reid, D. H., & Green, C. W. (2007). Effects
of reactivity to observations on staff performance.
Journal of Applied Behavior Analysis, 40, 191–195.
doi:10.1901/jaba.2007.112-05
Brown, R. A., Palm, K. M., Strong, D., Lejuez, C.,
Kahler, C., Zvolensky, M., . . . Gifford, E. (2008).
Distress tolerance treatment for early-lapse smok-
ers: Rationale, program description, and prelimi-
nary findings. Behavior Modification, 32, 302–332.
doi:10.1177/0145445507309024
Codding, R. S., Livanis, A., Pace, G. M., & Vaca, L.
(2008). Using performance feedback to improve
treatment integrity of classwide behavior plans:
An investigation of observer reactivity. Journal of
Applied Behavior Analysis, 41, 417–422. doi:10.1901/
jaba.2008.41-417
Connell, J. E., & Witt, J. C. (2004). Applications of
computer-based instruction: Using specialized soft-
ware to aid letter-name and letter-sound recogni-
tion. Journal of Applied Behavior Analysis, 37, 67–71.
doi:10.1901/jaba.2004.37-67
Cooper, J. O., Heron, T. E., & Heward, W. L. (2007).
Applied behavior analysis (2nd ed.). Upper Saddle
River, NJ: Pearson Education.
Daniels, A. C., & Daniels, J. E. (2004). Performance man-
agement: Changing behavior that drives organizational
effectiveness. Atlanta, GA: Performance Management.
DiGennaro, F. D., Martens, B. K., & Kleinmann, A. E.
(2007). A comparison of performance feedback
procedures on teachers’ treatment implementation
integrity and students’ inappropriate behavior in spe-
cial education classrooms. Journal of Applied Behavior
Analysis, 40, 447–461. doi:10.1901/jaba.2007.40-447
DiGennaro, F. D., Martens, B. K., & McIntyre, L. L.
(2005). Increasing treatment integrity through
negative reinforcement: Effects on teacher and stu-
dent behavior. School Psychology Review, 34, 220–231.
DiGennaro-Reed, F. D., Codding, R., Catania, C. N.,
& Maguire, H. (2010). Effects of video modeling
on treatment integrity of behavioral interventions.
Journal of Applied Behavior Analysis, 43, 291–295.
doi:10.1901/jaba.2010.43-291
Donaldson, J. M., & Normand, M. P. (2009). Using goals
setting, self-monitoring, and feedback to increase
calorie expenditure in obese adults. Behavioral
Interventions, 24, 73–83. doi:10.1002/bin.277
Fleiss, J. L. (1981). Statistical methods for rates and pro-
portions (2nd ed.). New York, NY: Wiley.
Flessner, C. A., Miltenberger, R. G., Egemo, K., Jostad, C.,
Gatheridge, B. J., Neighbors, C., . . . Kelso, P. (2005).
An evaluation of the social support component of
simplified habit reversal. Behavior Therapy, 36, 35–42.
doi:10.1016/S0005-7894(05)80052-8
Fogel, V. A., Miltenberger, R. G., Graves, R., & Koehler,
S. (2010). Evaluating the effects of exergaming on
physical activity among inactive children in a physi-
cal education classroom. Journal of Applied Behavior
Analysis, 43, 591–600. doi:10.1901/jaba.2010.43-591
Gatheridge, B. J., Miltenberger, R., Huneke, D. F.,
Satterlund, M. J., Mattern, A. R., Johnson, B. M., &
Flessner, C. A. (2004). A comparison of two pro-
grams to teach firearm injury prevention skills to 6-
and 7-year-old children. Pediatrics, 114, e294–e299.
doi:10.1542/peds.2003-0635-L
Gravlee, C. C., Zenk, S. N., Woods, S., Rowe, Z., &
Schulz, A. J. (2006). Handheld computers for direct
observation of the social and physical environment.
Field Methods, 18, 382–397. doi:10.1177/1525822X
06293067
Gresham, F. M., Gansle, K. A., & Noell, G. H. (1993).
Treatment integrity in applied behavior analysis with
children. Journal of Applied Behavior Analysis, 26,
257–263. doi:10.1901/jaba.1993.26-257
Harris, F. C., & Ciminero, A. R. (1978). The effects of
witnessing consequences on the behavioral recording
of experimental observers. Journal of Applied Behavior
Analysis, 11, 513–521. doi:10.1901/jaba.1978.11-513
Hayes, S. C., Barlow, D. H., & Nelson-Gray, R. O. (1999).
The scientist practitioner: Research and accountabil-
ity in the age of managed care. Boston, MA: Allyn &
Bacon.
Hayes, S. C., Wilson, K. G., Gifford, E., Bissett, R., Piasecki,
M., Batten, S., . . . Gregg, J. (2004). A preliminary trial
of twelve-step facilitation and acceptance and commit-
ment therapy with polysubstance-abusing methadone-
maintained opiate addicts. Behavior Therapy, 35,
667–688. doi:10.1016/S0005-7894(04)80014-5
Himle, M. B., Miltenberger, R. G., Flessner, C., & Gatheridge,
B.
(2004). Teaching safety skills to children to prevent
Co
py
ri
gh
t
Am
er
ic
an
P
sy
ch
ol
og
ic
al
A
ss
oc
ia
ti
on
.
No
t
fo
r
fu
rt
he
r
di
st
ri
bu
ti
on
.
Miltenberger and Weil
148
gun play. Journal of Applied Behavior Analysis, 37,
1–9. doi:10.1901/jaba.2004.37-1
Himle, M. B., Miltenberger, R. G., Gatheridge, B., &
Flessner, C. (2004). An evaluation of two procedures
for training skills to prevent gun play in children.
Pediatrics, 113, 70–77. doi:10.1542/peds.113.1.70
Iwata, B. A., Pace, G. M., Kissel, R. C., Nau, P. A., &
Farber, J. M. (1990). The Self-Injury Trauma (SIT)
scale: A method for quantifying surface tissue dam-
age caused by self-injurious behavior. Journal of
Applied Behavior Analysis, 23, 99–110. doi:10.1901/
jaba.1990.23-99
Jackson, J., & Dixon, M. R. (2007). A mobile computing
solution for collecting functional analysis data on a
pocket PC. Journal of Applied Behavior Analysis, 40,
359–384. doi:10.1901/jaba.2007.46-06
Jessup, P. A., & Stahelski, A. J. (1999). The effects of
a combined goal setting, feedback and incentive
intervention on job performance in a manufactur-
ing environment. Journal of Organizational Behavior
Management, 19, 5–26. doi:10.1300/J075v19n03_02
Johnston, J. M., & Pennypacker, H. S. (1993). Readings
for strategies and tactics of behavioral research (2nd
ed.). Hillsdale, NJ: Erlbaum.
Kahng, S. W., & Iwata, B. A. (1998). Computerized
systems for collecting real-time observational data.
Journal of Applied Behavior Analysis, 31, 253–261.
doi:10.1901/jaba.1998.31-253
Kazdin, A. E. (1977). Artifact, bias, and complexity
of assessment: The ABCs of reliability. Journal of
Applied Behavior Analysis, 10, 141–150. doi:10.1901/
jaba.1977.10-141
Kazdin, A. E. (2010). Single case research designs: Methods
for clinical and applied settings (2nd ed.). New York,
NY: Oxford University Press.
Kerwin, M. L., Ahearn, W. H., Eicher, P. S., & Swearingin,
W. (1998). The relationship between food refusal
and self-injurious behavior: A case study. Journal of
Behavior Therapy and Experimental Psychiatry, 29,
67–77. doi:10.1016/S0005-7916(97)00040-2
Landis, J. R., & Koch, G. G. (1977). The measurement of
observer agreement for categorical data. Biometrics,
33, 159–174. doi:10.2307/2529310
Lerman, D. C., Iwata, B. A., Smith, R. G., & Vollmer, T. R.
(1994). Restraint fading and the development of alter-
native behaviour in the treatment of self-restraint and
self-injury. Journal of Intellectual Disability Research,
38, 135–148. doi:10.1111/j.1365-2788.1994.tb00369.x
Lindsley, O. R. (1968). Technical note: A reliable wrist
counter for recording behavior rates. Journal of
Applied Behavior Analysis, 1, 77–78. doi:10.1901/
jaba.1968.1-77
Long, E. S., Miltenberger, R. G., Ellingson, S. A., & Ott,
S. M. (1999). Augmenting simplified habit reversal
in the treatment of oral-digit habits exhibited by
individuals with mental retardation. Journal of
Applied Behavior Analysis, 32, 353–365. doi:10.1901/
jaba.1999.32-353
MacDonald, R., Sacramone, S., Mansfield, R., Wiltz, K.,
& Ahern, W. (2009). Using video modeling to teach
reciprocal pretend play to children with autism.
Journal of Applied Behavior Analysis, 42, 43–55.
doi:10.1901/jaba.2009.42-43
Mace, F. C., Prager, K. L., Thomas, K., Kochy, J., Dyer,
T. J., Perry, L., & Pritchard, D. (2009). Effects of
stimulant medication under varied motivational
operations. Journal of Applied Behavior Analysis, 42,
177–183. doi:10.1901/jaba.2009.42-177
Maglieri, K. A., DeLeon, I. G., Rodriguez-Catter, V. R., &
Sevin, B. M. (2000). Treatment of covert food steal-
ing in an individual with Prader-Willi syndrome.
Journal of Applied Behavior Analysis, 33, 615–618.
doi:10.1901/jaba.2000.33-615
Maher, E. (2009). Behavior Tracker Pro. Retrieved from
http://www.behaviortrackerpro.com/btp/Welcome.
html
Malott, R., & Trojan-Suarez, E. A. (2004). Elementary
principles of behavior (5th ed.). Upper Saddle River,
NJ: Prentice Hall.
Marckel, J. M., Neef, N. A., & Ferreri, S. J. (2006). A pre-
liminary analysis of teaching improvisation with the
picture exchange communication system to children
with autism. Journal of Applied Behavior Analysis, 39,
109–115. doi:10.1901/jaba.2006.131-04
Mash, E. J., & McElwee, J. (1974). Situational effects on
observer accuracy: Behavioral predictability, prior
experience, and complexity of coding categories.
Child Development, 45, 367–377. doi:10.2307/1127957
Mayfield, K. H., & Vollmer, T. R. (2007). Teaching math
skills to at-risk students using home-based peer
tutoring. Journal of Applied Behavior Analysis, 40,
223–237. doi:10.1901/jaba.2007.108-05
Meidinger, A. L., Miltenberger, R. G., Himle, M., Omvig,
M., Trainor, C., & Crosby, R. (2005). An investiga-
tion of tic suppression and the rebound effect in
Tourette’s disorder. Behavior Modification, 29,
716–745. doi:10.1177/0145445505279262
Miltenberger, R. G. (2012). Behavior modification:
Principles and procedures (5th ed.). Belmont, CA:
Wadsworth.
Miltenberger, R., Rapp, J., & Long, E. (1999). A low tech
method for conducting real time recording. Journal of
Applied Behavior Analysis, 32, 119–120. doi:10.1901/
jaba.1999.32-119
Miltenberger, R. G., Woods, D. W., & Himle, M. (2007).
Tic disorders and trichotillomania. In P. Sturmey
(Ed.), Handbook of functional analysis and clinical
psychology (pp. 151–170). Burlington, MA: Elsevier.
Co
py
ri
gh
t
Am
er
ic
an
P
sy
ch
ol
og
ic
al
A
ss
oc
ia
ti
on
.
No
t
fo
r
fu
rt
he
r
di
st
ri
bu
ti
on
.
Observation and Measurement in Behavior Analysis
149
Miltenberger, R. G., Wright, K. M., & Fuqua, R. W.
(1986). Graduated in vivo exposure with a severe
spider phobic. Scandinavian Journal of Behaviour
Therapy, 15, 71–76. doi:10.1080/16506078609455763
Mowery, J., Miltenberger, R., & Weil, T. (2010).
Evaluating the effects of reactivity to supervisor
presence on staff response to tactile prompts and
self-monitoring in a group home setting. Behavioral
Interventions, 25, 21–35.
Mozingo, D. B., Smith, T., Riordan, M. R., Reiss, M. L.,
& Bailey, J. S. (2006). Enhancing frequency record-
ing by developmental disabilities treatment staff.
Journal of Applied Behavior Analysis, 39, 253–256.
doi:10.1901/jaba.2006.55-05
Parsons, H. M. (1974). What happened at Hawthorne?
Science, 183, 922–932. doi:10.1126/science.183.
4128.922
Patel, M. R., Piazza, C. C., Layer, S. A., Coleman, R., &
Swartzwelder, D. M. (2005). A systematic evaluation
of food textures to decrease packing and increase
oral intake in children with pediatric feeding dis-
orders. Journal of Applied Behavior Analysis, 38,
89–100. doi:10.1901/jaba.2005.161-02
Pedhazur, E., & Schmelkin, L. (1991). Measurement,
design, and analysis: An integrated approach. Hillsdale,
NJ: Erlbaum.
Peterson, L., Homer, A. L., & Wonderlich, S. A. (1982).
The integrity of independent variables in behavior
analysis. Journal of Applied Behavior Analysis, 15,
477–492. doi:10.1901/jaba.1982.15-477
Plavnick, J. B., Ferreri, S. J., & Maupin, A. N. (2010).
The effects of self-monitoring on the procedural
integrity of behavioral intervention for young chil-
dren with developmental disabilities. Journal of
Applied Behavior Analysis, 43, 315–320. doi:10.1901/
127DOI 10.103713937-006APA Handbook of Behavior Analys.docx

More Related Content

Similar to 127DOI 10.103713937-006APA Handbook of Behavior Analys.docx

Consumer Behavior - Attitudes ipad
Consumer Behavior - Attitudes ipadConsumer Behavior - Attitudes ipad
Consumer Behavior - Attitudes ipadGamze Saba
 
Communication Behavior part 3
Communication Behavior part 3Communication Behavior part 3
Communication Behavior part 3FkdiMl
 
theoretical-models-SAFETY.pdf
theoretical-models-SAFETY.pdftheoretical-models-SAFETY.pdf
theoretical-models-SAFETY.pdfprasad977251
 
Scales: Semantic Differential Scale Summated Rating Scale
Scales: Semantic Differential Scale Summated Rating ScaleScales: Semantic Differential Scale Summated Rating Scale
Scales: Semantic Differential Scale Summated Rating ScaleDrSindhuAlmas
 
120Reasoned Action TheoryPersuasion as Belief-Based Beha.docx
120Reasoned Action TheoryPersuasion as Belief-Based Beha.docx120Reasoned Action TheoryPersuasion as Belief-Based Beha.docx
120Reasoned Action TheoryPersuasion as Belief-Based Beha.docxmoggdede
 
Influencing Attitudes and Changing Behaviours in the Work Place
Influencing Attitudes and Changing Behaviours in the Work PlaceInfluencing Attitudes and Changing Behaviours in the Work Place
Influencing Attitudes and Changing Behaviours in the Work PlaceEmeka Anazia
 
Theories of Programme Planning - Arunkumar R, Annamalai University
Theories of Programme Planning - Arunkumar R, Annamalai UniversityTheories of Programme Planning - Arunkumar R, Annamalai University
Theories of Programme Planning - Arunkumar R, Annamalai UniversityARUNKUMAR R
 
Quantitative and research methods in business
Quantitative and research methods in businessQuantitative and research methods in business
Quantitative and research methods in businessSidharthanSD
 
The Duty of Loyalty and Whistleblowing Please respond to the fol.docx
The Duty of Loyalty and Whistleblowing Please respond to the fol.docxThe Duty of Loyalty and Whistleblowing Please respond to the fol.docx
The Duty of Loyalty and Whistleblowing Please respond to the fol.docxcherry686017
 
“Impact of Behavioral Biases on Investors Decision Making: Male Vs Female”
“Impact of Behavioral Biases on Investors Decision Making: Male Vs Female”“Impact of Behavioral Biases on Investors Decision Making: Male Vs Female”
“Impact of Behavioral Biases on Investors Decision Making: Male Vs Female”IOSR Journals
 
Respond in a paragraph the discussion board. In your response,.docx
Respond in a paragraph the discussion board. In your response,.docxRespond in a paragraph the discussion board. In your response,.docx
Respond in a paragraph the discussion board. In your response,.docxphilipnelson29183
 
Respond in a paragraph the discussion board. In your response,.docx
Respond in a paragraph the discussion board. In your response,.docxRespond in a paragraph the discussion board. In your response,.docx
Respond in a paragraph the discussion board. In your response,.docxpeggyd2
 
Reflection Of Learning On The Theory Of Planned Behavior
Reflection Of Learning On The Theory Of Planned BehaviorReflection Of Learning On The Theory Of Planned Behavior
Reflection Of Learning On The Theory Of Planned BehaviorRachel Davis
 

Similar to 127DOI 10.103713937-006APA Handbook of Behavior Analys.docx (19)

Consumer Behavior - Attitudes ipad
Consumer Behavior - Attitudes ipadConsumer Behavior - Attitudes ipad
Consumer Behavior - Attitudes ipad
 
Communication Behavior part 3
Communication Behavior part 3Communication Behavior part 3
Communication Behavior part 3
 
Organization Behavior - Introduction
Organization Behavior - IntroductionOrganization Behavior - Introduction
Organization Behavior - Introduction
 
Final bcc20101206
Final bcc20101206Final bcc20101206
Final bcc20101206
 
Final bcc20101206
Final bcc20101206Final bcc20101206
Final bcc20101206
 
Social cognitive theory
Social cognitive theorySocial cognitive theory
Social cognitive theory
 
theoretical-models-SAFETY.pdf
theoretical-models-SAFETY.pdftheoretical-models-SAFETY.pdf
theoretical-models-SAFETY.pdf
 
Scales: Semantic Differential Scale Summated Rating Scale
Scales: Semantic Differential Scale Summated Rating ScaleScales: Semantic Differential Scale Summated Rating Scale
Scales: Semantic Differential Scale Summated Rating Scale
 
120Reasoned Action TheoryPersuasion as Belief-Based Beha.docx
120Reasoned Action TheoryPersuasion as Belief-Based Beha.docx120Reasoned Action TheoryPersuasion as Belief-Based Beha.docx
120Reasoned Action TheoryPersuasion as Belief-Based Beha.docx
 
Research Methodology - Chapter 2
Research Methodology - Chapter 2Research Methodology - Chapter 2
Research Methodology - Chapter 2
 
Influencing Attitudes and Changing Behaviours in the Work Place
Influencing Attitudes and Changing Behaviours in the Work PlaceInfluencing Attitudes and Changing Behaviours in the Work Place
Influencing Attitudes and Changing Behaviours in the Work Place
 
Theories of Programme Planning - Arunkumar R, Annamalai University
Theories of Programme Planning - Arunkumar R, Annamalai UniversityTheories of Programme Planning - Arunkumar R, Annamalai University
Theories of Programme Planning - Arunkumar R, Annamalai University
 
Quantitative and research methods in business
Quantitative and research methods in businessQuantitative and research methods in business
Quantitative and research methods in business
 
The Duty of Loyalty and Whistleblowing Please respond to the fol.docx
The Duty of Loyalty and Whistleblowing Please respond to the fol.docxThe Duty of Loyalty and Whistleblowing Please respond to the fol.docx
The Duty of Loyalty and Whistleblowing Please respond to the fol.docx
 
“Impact of Behavioral Biases on Investors Decision Making: Male Vs Female”
“Impact of Behavioral Biases on Investors Decision Making: Male Vs Female”“Impact of Behavioral Biases on Investors Decision Making: Male Vs Female”
“Impact of Behavioral Biases on Investors Decision Making: Male Vs Female”
 
Respond in a paragraph the discussion board. In your response,.docx
Respond in a paragraph the discussion board. In your response,.docxRespond in a paragraph the discussion board. In your response,.docx
Respond in a paragraph the discussion board. In your response,.docx
 
Respond in a paragraph the discussion board. In your response,.docx
Respond in a paragraph the discussion board. In your response,.docxRespond in a paragraph the discussion board. In your response,.docx
Respond in a paragraph the discussion board. In your response,.docx
 
Attitudes
AttitudesAttitudes
Attitudes
 
Reflection Of Learning On The Theory Of Planned Behavior
Reflection Of Learning On The Theory Of Planned BehaviorReflection Of Learning On The Theory Of Planned Behavior
Reflection Of Learning On The Theory Of Planned Behavior
 

More from moggdede

CASE STUDY COMMENTARY•  Individual written task in Harvard sty.docx
CASE STUDY COMMENTARY•  Individual written task in Harvard sty.docxCASE STUDY COMMENTARY•  Individual written task in Harvard sty.docx
CASE STUDY COMMENTARY•  Individual written task in Harvard sty.docxmoggdede
 
Case Study Chapter 5 100 wordsTranscultural Nursing in the.docx
Case Study Chapter 5 100 wordsTranscultural Nursing in the.docxCase Study Chapter 5 100 wordsTranscultural Nursing in the.docx
Case Study Chapter 5 100 wordsTranscultural Nursing in the.docxmoggdede
 
Case Study Chapter 10 Boss, We’ve got a problemBy Kayla Cur.docx
Case Study Chapter 10 Boss, We’ve got a problemBy Kayla Cur.docxCase Study Chapter 10 Boss, We’ve got a problemBy Kayla Cur.docx
Case Study Chapter 10 Boss, We’ve got a problemBy Kayla Cur.docxmoggdede
 
CASE STUDY Caregiver Role Strain Ms. Sandra A. Sandra, a 47-year-o.docx
CASE STUDY Caregiver Role Strain Ms. Sandra A. Sandra, a 47-year-o.docxCASE STUDY Caregiver Role Strain Ms. Sandra A. Sandra, a 47-year-o.docx
CASE STUDY Caregiver Role Strain Ms. Sandra A. Sandra, a 47-year-o.docxmoggdede
 
Case Study Answers Week 7 and 8Group OneIn your grou.docx
Case Study Answers Week 7 and 8Group OneIn your grou.docxCase Study Answers Week 7 and 8Group OneIn your grou.docx
Case Study Answers Week 7 and 8Group OneIn your grou.docxmoggdede
 
Case Study and Transition Plan TemplateCase StudyD.docx
Case Study and Transition Plan TemplateCase StudyD.docxCase Study and Transition Plan TemplateCase StudyD.docx
Case Study and Transition Plan TemplateCase StudyD.docxmoggdede
 
Case Study AnalysisRead Compassion for Samantha Case Study.docx
Case Study AnalysisRead Compassion for Samantha Case Study.docxCase Study AnalysisRead Compassion for Samantha Case Study.docx
Case Study AnalysisRead Compassion for Samantha Case Study.docxmoggdede
 
Case Study AnalysisAn understanding of cells and cell behavi.docx
Case Study AnalysisAn understanding of cells and cell behavi.docxCase Study AnalysisAn understanding of cells and cell behavi.docx
Case Study AnalysisAn understanding of cells and cell behavi.docxmoggdede
 
Case Study Analysis and FindingsThe final assignment for this co.docx
Case Study Analysis and FindingsThe final assignment for this co.docxCase Study Analysis and FindingsThe final assignment for this co.docx
Case Study Analysis and FindingsThe final assignment for this co.docxmoggdede
 
Case Study Analysis A TutorialWhat is it Case studies are a .docx
Case Study Analysis  A TutorialWhat is it  Case studies are a .docxCase Study Analysis  A TutorialWhat is it  Case studies are a .docx
Case Study Analysis A TutorialWhat is it Case studies are a .docxmoggdede
 
Case Study AlcoholCertain occasional behaviors can cause more tro.docx
Case Study AlcoholCertain occasional behaviors can cause more tro.docxCase Study AlcoholCertain occasional behaviors can cause more tro.docx
Case Study AlcoholCertain occasional behaviors can cause more tro.docxmoggdede
 
Case study A group of nurse educators are having a discussion about.docx
Case study A group of nurse educators are having a discussion about.docxCase study A group of nurse educators are having a discussion about.docx
Case study A group of nurse educators are having a discussion about.docxmoggdede
 
Case study ;1Callista Roy and Betty Neumans theories view the.docx
Case study ;1Callista Roy and Betty Neumans theories view the.docxCase study ;1Callista Roy and Betty Neumans theories view the.docx
Case study ;1Callista Roy and Betty Neumans theories view the.docxmoggdede
 
Case Study 9Running head BP & THE GULF OF MEXICO OIL SPILLC.docx
Case Study 9Running head BP & THE GULF OF MEXICO OIL SPILLC.docxCase Study 9Running head BP & THE GULF OF MEXICO OIL SPILLC.docx
Case Study 9Running head BP & THE GULF OF MEXICO OIL SPILLC.docxmoggdede
 
Case Study 9-1 IT Governance at University of the Southeast. Answer .docx
Case Study 9-1 IT Governance at University of the Southeast. Answer .docxCase Study 9-1 IT Governance at University of the Southeast. Answer .docx
Case Study 9-1 IT Governance at University of the Southeast. Answer .docxmoggdede
 
Case Study 7-2 Sony Pictures The Criminals Won. Answer question 2 W.docx
Case Study 7-2 Sony Pictures The Criminals Won. Answer question 2 W.docxCase Study 7-2 Sony Pictures The Criminals Won. Answer question 2 W.docx
Case Study 7-2 Sony Pictures The Criminals Won. Answer question 2 W.docxmoggdede
 
Case Study 8.1 Team DenialEmory University Holocaust studies pr.docx
Case Study 8.1 Team DenialEmory University Holocaust studies pr.docxCase Study 8.1 Team DenialEmory University Holocaust studies pr.docx
Case Study 8.1 Team DenialEmory University Holocaust studies pr.docxmoggdede
 
Case Study 7 Solving Team Challenges at DocSystems Billing, Inc.docx
Case Study 7 Solving Team Challenges at DocSystems Billing, Inc.docxCase Study 7 Solving Team Challenges at DocSystems Billing, Inc.docx
Case Study 7 Solving Team Challenges at DocSystems Billing, Inc.docxmoggdede
 
Case Study 5.2 Hiding the Real Story at Midwestern Community Acti.docx
Case Study 5.2 Hiding the Real Story at Midwestern Community Acti.docxCase Study 5.2 Hiding the Real Story at Midwestern Community Acti.docx
Case Study 5.2 Hiding the Real Story at Midwestern Community Acti.docxmoggdede
 
Case Study 5.1Write a 3 to 4 (not including title or reference.docx
Case Study 5.1Write a 3 to 4 (not including title or reference.docxCase Study 5.1Write a 3 to 4 (not including title or reference.docx
Case Study 5.1Write a 3 to 4 (not including title or reference.docxmoggdede
 

More from moggdede (20)

CASE STUDY COMMENTARY•  Individual written task in Harvard sty.docx
CASE STUDY COMMENTARY•  Individual written task in Harvard sty.docxCASE STUDY COMMENTARY•  Individual written task in Harvard sty.docx
CASE STUDY COMMENTARY•  Individual written task in Harvard sty.docx
 
Case Study Chapter 5 100 wordsTranscultural Nursing in the.docx
Case Study Chapter 5 100 wordsTranscultural Nursing in the.docxCase Study Chapter 5 100 wordsTranscultural Nursing in the.docx
Case Study Chapter 5 100 wordsTranscultural Nursing in the.docx
 
Case Study Chapter 10 Boss, We’ve got a problemBy Kayla Cur.docx
Case Study Chapter 10 Boss, We’ve got a problemBy Kayla Cur.docxCase Study Chapter 10 Boss, We’ve got a problemBy Kayla Cur.docx
Case Study Chapter 10 Boss, We’ve got a problemBy Kayla Cur.docx
 
CASE STUDY Caregiver Role Strain Ms. Sandra A. Sandra, a 47-year-o.docx
CASE STUDY Caregiver Role Strain Ms. Sandra A. Sandra, a 47-year-o.docxCASE STUDY Caregiver Role Strain Ms. Sandra A. Sandra, a 47-year-o.docx
CASE STUDY Caregiver Role Strain Ms. Sandra A. Sandra, a 47-year-o.docx
 
Case Study Answers Week 7 and 8Group OneIn your grou.docx
Case Study Answers Week 7 and 8Group OneIn your grou.docxCase Study Answers Week 7 and 8Group OneIn your grou.docx
Case Study Answers Week 7 and 8Group OneIn your grou.docx
 
Case Study and Transition Plan TemplateCase StudyD.docx
Case Study and Transition Plan TemplateCase StudyD.docxCase Study and Transition Plan TemplateCase StudyD.docx
Case Study and Transition Plan TemplateCase StudyD.docx
 
Case Study AnalysisRead Compassion for Samantha Case Study.docx
Case Study AnalysisRead Compassion for Samantha Case Study.docxCase Study AnalysisRead Compassion for Samantha Case Study.docx
Case Study AnalysisRead Compassion for Samantha Case Study.docx
 
Case Study AnalysisAn understanding of cells and cell behavi.docx
Case Study AnalysisAn understanding of cells and cell behavi.docxCase Study AnalysisAn understanding of cells and cell behavi.docx
Case Study AnalysisAn understanding of cells and cell behavi.docx
 
Case Study Analysis and FindingsThe final assignment for this co.docx
Case Study Analysis and FindingsThe final assignment for this co.docxCase Study Analysis and FindingsThe final assignment for this co.docx
Case Study Analysis and FindingsThe final assignment for this co.docx
 
Case Study Analysis A TutorialWhat is it Case studies are a .docx
Case Study Analysis  A TutorialWhat is it  Case studies are a .docxCase Study Analysis  A TutorialWhat is it  Case studies are a .docx
Case Study Analysis A TutorialWhat is it Case studies are a .docx
 
Case Study AlcoholCertain occasional behaviors can cause more tro.docx
Case Study AlcoholCertain occasional behaviors can cause more tro.docxCase Study AlcoholCertain occasional behaviors can cause more tro.docx
Case Study AlcoholCertain occasional behaviors can cause more tro.docx
 
Case study A group of nurse educators are having a discussion about.docx
Case study A group of nurse educators are having a discussion about.docxCase study A group of nurse educators are having a discussion about.docx
Case study A group of nurse educators are having a discussion about.docx
 
Case study ;1Callista Roy and Betty Neumans theories view the.docx
Case study ;1Callista Roy and Betty Neumans theories view the.docxCase study ;1Callista Roy and Betty Neumans theories view the.docx
Case study ;1Callista Roy and Betty Neumans theories view the.docx
 
Case Study 9Running head BP & THE GULF OF MEXICO OIL SPILLC.docx
Case Study 9Running head BP & THE GULF OF MEXICO OIL SPILLC.docxCase Study 9Running head BP & THE GULF OF MEXICO OIL SPILLC.docx
Case Study 9Running head BP & THE GULF OF MEXICO OIL SPILLC.docx
 
Case Study 9-1 IT Governance at University of the Southeast. Answer .docx
Case Study 9-1 IT Governance at University of the Southeast. Answer .docxCase Study 9-1 IT Governance at University of the Southeast. Answer .docx
Case Study 9-1 IT Governance at University of the Southeast. Answer .docx
 
Case Study 7-2 Sony Pictures The Criminals Won. Answer question 2 W.docx
Case Study 7-2 Sony Pictures The Criminals Won. Answer question 2 W.docxCase Study 7-2 Sony Pictures The Criminals Won. Answer question 2 W.docx
Case Study 7-2 Sony Pictures The Criminals Won. Answer question 2 W.docx
 
Case Study 8.1 Team DenialEmory University Holocaust studies pr.docx
Case Study 8.1 Team DenialEmory University Holocaust studies pr.docxCase Study 8.1 Team DenialEmory University Holocaust studies pr.docx
Case Study 8.1 Team DenialEmory University Holocaust studies pr.docx
 
Case Study 7 Solving Team Challenges at DocSystems Billing, Inc.docx
Case Study 7 Solving Team Challenges at DocSystems Billing, Inc.docxCase Study 7 Solving Team Challenges at DocSystems Billing, Inc.docx
Case Study 7 Solving Team Challenges at DocSystems Billing, Inc.docx
 
Case Study 5.2 Hiding the Real Story at Midwestern Community Acti.docx
Case Study 5.2 Hiding the Real Story at Midwestern Community Acti.docxCase Study 5.2 Hiding the Real Story at Midwestern Community Acti.docx
Case Study 5.2 Hiding the Real Story at Midwestern Community Acti.docx
 
Case Study 5.1Write a 3 to 4 (not including title or reference.docx
Case Study 5.1Write a 3 to 4 (not including title or reference.docxCase Study 5.1Write a 3 to 4 (not including title or reference.docx
Case Study 5.1Write a 3 to 4 (not including title or reference.docx
 

Recently uploaded

ICT role in 21st century education and it's challenges.
ICT role in 21st century education and it's challenges.ICT role in 21st century education and it's challenges.
ICT role in 21st century education and it's challenges.MaryamAhmad92
 
Wellbeing inclusion and digital dystopias.pptx
Wellbeing inclusion and digital dystopias.pptxWellbeing inclusion and digital dystopias.pptx
Wellbeing inclusion and digital dystopias.pptxJisc
 
On National Teacher Day, meet the 2024-25 Kenan Fellows
On National Teacher Day, meet the 2024-25 Kenan FellowsOn National Teacher Day, meet the 2024-25 Kenan Fellows
On National Teacher Day, meet the 2024-25 Kenan FellowsMebane Rash
 
Kodo Millet PPT made by Ghanshyam bairwa college of Agriculture kumher bhara...
Kodo Millet  PPT made by Ghanshyam bairwa college of Agriculture kumher bhara...Kodo Millet  PPT made by Ghanshyam bairwa college of Agriculture kumher bhara...
Kodo Millet PPT made by Ghanshyam bairwa college of Agriculture kumher bhara...pradhanghanshyam7136
 
Beyond_Borders_Understanding_Anime_and_Manga_Fandom_A_Comprehensive_Audience_...
Beyond_Borders_Understanding_Anime_and_Manga_Fandom_A_Comprehensive_Audience_...Beyond_Borders_Understanding_Anime_and_Manga_Fandom_A_Comprehensive_Audience_...
Beyond_Borders_Understanding_Anime_and_Manga_Fandom_A_Comprehensive_Audience_...Pooja Bhuva
 
Plant propagation: Sexual and Asexual propapagation.pptx
Plant propagation: Sexual and Asexual propapagation.pptxPlant propagation: Sexual and Asexual propapagation.pptx
Plant propagation: Sexual and Asexual propapagation.pptxUmeshTimilsina1
 
21st_Century_Skills_Framework_Final_Presentation_2.pptx
21st_Century_Skills_Framework_Final_Presentation_2.pptx21st_Century_Skills_Framework_Final_Presentation_2.pptx
21st_Century_Skills_Framework_Final_Presentation_2.pptxJoelynRubio1
 
Jamworks pilot and AI at Jisc (20/03/2024)
Jamworks pilot and AI at Jisc (20/03/2024)Jamworks pilot and AI at Jisc (20/03/2024)
Jamworks pilot and AI at Jisc (20/03/2024)Jisc
 
How to Add New Custom Addons Path in Odoo 17
How to Add New Custom Addons Path in Odoo 17How to Add New Custom Addons Path in Odoo 17
How to Add New Custom Addons Path in Odoo 17Celine George
 
REMIFENTANIL: An Ultra short acting opioid.pptx
REMIFENTANIL: An Ultra short acting opioid.pptxREMIFENTANIL: An Ultra short acting opioid.pptx
REMIFENTANIL: An Ultra short acting opioid.pptxDr. Ravikiran H M Gowda
 
OSCM Unit 2_Operations Processes & Systems
OSCM Unit 2_Operations Processes & SystemsOSCM Unit 2_Operations Processes & Systems
OSCM Unit 2_Operations Processes & SystemsSandeep D Chaudhary
 
Basic Intentional Injuries Health Education
Basic Intentional Injuries Health EducationBasic Intentional Injuries Health Education
Basic Intentional Injuries Health EducationNeilDeclaro1
 
80 ĐỀ THI THỬ TUYỂN SINH TIẾNG ANH VÀO 10 SỞ GD – ĐT THÀNH PHỐ HỒ CHÍ MINH NĂ...
80 ĐỀ THI THỬ TUYỂN SINH TIẾNG ANH VÀO 10 SỞ GD – ĐT THÀNH PHỐ HỒ CHÍ MINH NĂ...80 ĐỀ THI THỬ TUYỂN SINH TIẾNG ANH VÀO 10 SỞ GD – ĐT THÀNH PHỐ HỒ CHÍ MINH NĂ...
80 ĐỀ THI THỬ TUYỂN SINH TIẾNG ANH VÀO 10 SỞ GD – ĐT THÀNH PHỐ HỒ CHÍ MINH NĂ...Nguyen Thanh Tu Collection
 
NO1 Top Black Magic Specialist In Lahore Black magic In Pakistan Kala Ilam Ex...
NO1 Top Black Magic Specialist In Lahore Black magic In Pakistan Kala Ilam Ex...NO1 Top Black Magic Specialist In Lahore Black magic In Pakistan Kala Ilam Ex...
NO1 Top Black Magic Specialist In Lahore Black magic In Pakistan Kala Ilam Ex...Amil baba
 
Salient Features of India constitution especially power and functions
Salient Features of India constitution especially power and functionsSalient Features of India constitution especially power and functions
Salient Features of India constitution especially power and functionsKarakKing
 
ICT Role in 21st Century Education & its Challenges.pptx
ICT Role in 21st Century Education & its Challenges.pptxICT Role in 21st Century Education & its Challenges.pptx
ICT Role in 21st Century Education & its Challenges.pptxAreebaZafar22
 
Fostering Friendships - Enhancing Social Bonds in the Classroom
Fostering Friendships - Enhancing Social Bonds  in the ClassroomFostering Friendships - Enhancing Social Bonds  in the Classroom
Fostering Friendships - Enhancing Social Bonds in the ClassroomPooky Knightsmith
 
Understanding Accommodations and Modifications
Understanding  Accommodations and ModificationsUnderstanding  Accommodations and Modifications
Understanding Accommodations and ModificationsMJDuyan
 
Accessible Digital Futures project (20/03/2024)
Accessible Digital Futures project (20/03/2024)Accessible Digital Futures project (20/03/2024)
Accessible Digital Futures project (20/03/2024)Jisc
 
On_Translating_a_Tamil_Poem_by_A_K_Ramanujan.pptx
On_Translating_a_Tamil_Poem_by_A_K_Ramanujan.pptxOn_Translating_a_Tamil_Poem_by_A_K_Ramanujan.pptx
On_Translating_a_Tamil_Poem_by_A_K_Ramanujan.pptxPooja Bhuva
 

Recently uploaded (20)

ICT role in 21st century education and it's challenges.
ICT role in 21st century education and it's challenges.ICT role in 21st century education and it's challenges.
ICT role in 21st century education and it's challenges.
 
Wellbeing inclusion and digital dystopias.pptx
Wellbeing inclusion and digital dystopias.pptxWellbeing inclusion and digital dystopias.pptx
Wellbeing inclusion and digital dystopias.pptx
 
On National Teacher Day, meet the 2024-25 Kenan Fellows
On National Teacher Day, meet the 2024-25 Kenan FellowsOn National Teacher Day, meet the 2024-25 Kenan Fellows
On National Teacher Day, meet the 2024-25 Kenan Fellows
 
Kodo Millet PPT made by Ghanshyam bairwa college of Agriculture kumher bhara...
Kodo Millet  PPT made by Ghanshyam bairwa college of Agriculture kumher bhara...Kodo Millet  PPT made by Ghanshyam bairwa college of Agriculture kumher bhara...
Kodo Millet PPT made by Ghanshyam bairwa college of Agriculture kumher bhara...
 
Beyond_Borders_Understanding_Anime_and_Manga_Fandom_A_Comprehensive_Audience_...
Beyond_Borders_Understanding_Anime_and_Manga_Fandom_A_Comprehensive_Audience_...Beyond_Borders_Understanding_Anime_and_Manga_Fandom_A_Comprehensive_Audience_...
Beyond_Borders_Understanding_Anime_and_Manga_Fandom_A_Comprehensive_Audience_...
 
Plant propagation: Sexual and Asexual propapagation.pptx
Plant propagation: Sexual and Asexual propapagation.pptxPlant propagation: Sexual and Asexual propapagation.pptx
Plant propagation: Sexual and Asexual propapagation.pptx
 
21st_Century_Skills_Framework_Final_Presentation_2.pptx
21st_Century_Skills_Framework_Final_Presentation_2.pptx21st_Century_Skills_Framework_Final_Presentation_2.pptx
21st_Century_Skills_Framework_Final_Presentation_2.pptx
 
Jamworks pilot and AI at Jisc (20/03/2024)
Jamworks pilot and AI at Jisc (20/03/2024)Jamworks pilot and AI at Jisc (20/03/2024)
Jamworks pilot and AI at Jisc (20/03/2024)
 
How to Add New Custom Addons Path in Odoo 17
How to Add New Custom Addons Path in Odoo 17How to Add New Custom Addons Path in Odoo 17
How to Add New Custom Addons Path in Odoo 17
 
REMIFENTANIL: An Ultra short acting opioid.pptx
REMIFENTANIL: An Ultra short acting opioid.pptxREMIFENTANIL: An Ultra short acting opioid.pptx
REMIFENTANIL: An Ultra short acting opioid.pptx
 
OSCM Unit 2_Operations Processes & Systems
OSCM Unit 2_Operations Processes & SystemsOSCM Unit 2_Operations Processes & Systems
OSCM Unit 2_Operations Processes & Systems
 
Basic Intentional Injuries Health Education
Basic Intentional Injuries Health EducationBasic Intentional Injuries Health Education
Basic Intentional Injuries Health Education
 
80 ĐỀ THI THỬ TUYỂN SINH TIẾNG ANH VÀO 10 SỞ GD – ĐT THÀNH PHỐ HỒ CHÍ MINH NĂ...
80 ĐỀ THI THỬ TUYỂN SINH TIẾNG ANH VÀO 10 SỞ GD – ĐT THÀNH PHỐ HỒ CHÍ MINH NĂ...80 ĐỀ THI THỬ TUYỂN SINH TIẾNG ANH VÀO 10 SỞ GD – ĐT THÀNH PHỐ HỒ CHÍ MINH NĂ...
80 ĐỀ THI THỬ TUYỂN SINH TIẾNG ANH VÀO 10 SỞ GD – ĐT THÀNH PHỐ HỒ CHÍ MINH NĂ...
 
NO1 Top Black Magic Specialist In Lahore Black magic In Pakistan Kala Ilam Ex...
NO1 Top Black Magic Specialist In Lahore Black magic In Pakistan Kala Ilam Ex...NO1 Top Black Magic Specialist In Lahore Black magic In Pakistan Kala Ilam Ex...
NO1 Top Black Magic Specialist In Lahore Black magic In Pakistan Kala Ilam Ex...
 
Salient Features of India constitution especially power and functions
Salient Features of India constitution especially power and functionsSalient Features of India constitution especially power and functions
Salient Features of India constitution especially power and functions
 
ICT Role in 21st Century Education & its Challenges.pptx
ICT Role in 21st Century Education & its Challenges.pptxICT Role in 21st Century Education & its Challenges.pptx
ICT Role in 21st Century Education & its Challenges.pptx
 
Fostering Friendships - Enhancing Social Bonds in the Classroom
Fostering Friendships - Enhancing Social Bonds  in the ClassroomFostering Friendships - Enhancing Social Bonds  in the Classroom
Fostering Friendships - Enhancing Social Bonds in the Classroom
 
Understanding Accommodations and Modifications
Understanding  Accommodations and ModificationsUnderstanding  Accommodations and Modifications
Understanding Accommodations and Modifications
 
Accessible Digital Futures project (20/03/2024)
Accessible Digital Futures project (20/03/2024)Accessible Digital Futures project (20/03/2024)
Accessible Digital Futures project (20/03/2024)
 
On_Translating_a_Tamil_Poem_by_A_K_Ramanujan.pptx
On_Translating_a_Tamil_Poem_by_A_K_Ramanujan.pptxOn_Translating_a_Tamil_Poem_by_A_K_Ramanujan.pptx
On_Translating_a_Tamil_Poem_by_A_K_Ramanujan.pptx
 

127DOI 10.103713937-006APA Handbook of Behavior Analys.docx

  • 1. 127 DOI: 10.1037/13937-006 APA Handbook of Behavior Analysis: Vol. 1. Methods and Principles, G. J. Madden (Editor-in-Chief) Copyright © 2013 by the American Psychological Association. All rights reserved. C h a P t e r 6 OBSErvAtIOn And MEASurEMEnt In BEhAvIOr AnAlySIS Raymond G. Miltenberger and Timothy M. Weil You can observe a lot by watching. —Yogi Berra, circa 1964 Throughout its history, behavior analysis has focused on building an inductive science that uses behavioral observation techniques to identify func- tional behavior–environment relations such that alteration of these relations may result in behavior change that is scientifically, and often socially, meaningful. Measuring behavior–environment rela- tions in accurate and reliable ways is thus an inte- gral tool in the process of analyzing and changing behavior. Observable behavior has formal properties or dimensions that can be measured. These behav- ioral dimensions include frequency, intensity, dura- tion, and latency (e.g., Bailey & Burch, 2002; Miltenberger, 2012). Each of these dimensions
  • 2. affords the observer the opportunity to measure changes in level, trend, and variability when altera- tions of environmental variables occur naturally or are manipulated under various programmed conditions. Observation and measurement of behavior may take many forms and involve a variety of techniques across practically any setting. In this chapter, we discuss observation and measurement in the field of behavior analysis with a focus on identifying and measuring the target behavior, logistics of observa- tion, recording procedures and devices, reactivity, interobserver agreement (IOA), and ethical consid- erations. The information discussed in this chapter is relevant to both research and practice in behavior analysis because observation and measurement of behavior is central to both endeavors. BEHAVIOR Regardless of whether the purpose of investigation is research or practice, it is first necessary to define behavior. Many authors define behavior in slightly different terms; however, each stresses an individu- al’s action or movement. According to Miltenberger (2012), behavior involves the actions of individuals, what people say and do. Malott and Trojan-Suarez (2004) suggested that behavior is anything a dead man cannot do, again suggesting that behavior con- sists of action or movement. Cooper, Heron, and Heward (2007) said that “behavior is the activity of living organisms. Human behavior is everything people do including how they move and what they say, think, and feel” (p. 25). Finally, Johnston and Pennypacker (1993) stated that behavior
  • 3. is that portion of an organism’s interac- tion with its environment that is char- acterized by detectable displacement in space through time of some part of the organism and that results in a measurable change in at least one aspect of the envi- ronment. (p. 23) These definitions of behavior are rooted in the tradi- tional characterization of an operant as observable action or movement that has some subsequent effect on (operates on) the environment (Johnston & Pennypacker, 1993, p. 25). Although the Cooper et al. definition of behavior includes thinking and feeling, these actions are nonetheless those of an individual that can be observed and recorded. Therefore, in this chapter we focus on observation and measurement of Co py ri gh t Am er ic an P sy ch
  • 5. 128 behavior that can be detected, and thus recorded, by an observer. In some cases, the observer may be the individual engaging in the behavior. SELECTING AND DEFINING TARGET BEHAVIOR The first step in developing a plan for observing and recording behavior is to select and then define appropriate target behavior. Selecting Target Behavior Target behavior can be selected for a variety of over- lapping reasons (see Kazdin, 2010). It may be useful but arbitrary; representative of a broader class of operants; the focus of intervention or educational efforts that occur in a particular setting (e.g., aca- demic performance in a school setting); chosen because it causes impairment in some area of func- tioning for the individual; of particular concern to the individual or significant others who seek to change the behavior; or chosen because it will pre- vent the development of future problems (e.g., the promotion of safety skills to prevent injury). When selecting target behavior, three general categories are considered: behavioral deficits, behavioral excesses, and problems of stimulus control. Behav- ioral deficits are behaviors that need to increase, such as desirable communicative responses for a child with autism who has limited language (e.g., Sundberg & Michael, 2001). Behavioral excesses are behaviors that need to decrease, such as self- injurious or aggressive behavior emitted by an indi- vidual with intellectual disability (e.g., Lerman, Iwata,
  • 6. Smith, & Vollmer, 1994). Problems of stimulus con- trol are present when behaviors occur, but not at the appropriate time or place or in the appropriate con- text. For example, a child may learn to engage in a safety skill during training but fail to use it when the opportunity arises in the natural environment (e.g., Gatheridge et al., 2004; Himle, Miltenberger, Fless- ner, & Gatheridge, 2004). Likewise, a child with autism may learn to label an object but be unable to ask for the same object (e.g., failure of tact-to-mand transfer; Wallace, Iwata, & Hanley, 2006). Identify- ing developmentally appropriate topographies and levels of behavior is also important when selecting the target behavior. For example, in research on stuttering, Wagaman, Miltenberger, and Arndorfer (1993) chose a criterion of 3% or fewer stuttered words as an indication of treatment success on the basis of research showing that as many as 3% of the words spoken by typical speakers were dysfluent. A guiding factor in the selection of a target behavior in applied work is its social significance (Baer, Wolf, & Risley, 1968). Behavior is targeted that will increase the client’s meaningful and effec- tive interactions with the environment. One index of social significance is the assessment of the social validity of the targeted behavior (Wolf, 1978). According to Wolf (1978), one of the three levels of social validity is the degree to which society vali- dates the social significance of the goals of a behav- ior change procedure. In this regard, the important question posed by Wolf is, “Are the specific behav- ioral goals really what society wants?” (p. 207). In practice, assessment of the social validity of a target behavior or goal involves asking consumers for feed-
  • 7. back on what behavior should be addressed, in what order, and to what extent. Of course, the target behavior selected in this way may possibly have some secondary gain or benefit for the person pro- viding the report and thus may or may not be in the client’s best interest. The behavior analyst must be aware of this possibility and decide with the client, client surrogates, treatment team members, or some or all of these on the target behavior that best serves the client’s interests. Although behavior analysts are interested in the behavior of clients or research participants, they are also interested in the behavior of the implementers carrying out behavior-analytic procedures. The degree to which individuals implement assessment and treatment procedures as planned is referred to as implementation fidelity, procedural fidelity, or treat- ment integrity (e.g., Gresham, Gansle, & Noell, 1993; Peterson, Homer, & Wonderlich, 1982). Implementation fidelity is important because higher fidelity is associated with better treatment outcomes (e.g., DiGennaro, Martens, & Kleinmann, 2007; DiGennaro, Martens, & McIntyre, 2005; DiGennaro- Reed, Codding, Catania, & Maguire, 2010; Plavnick, Ferreri, & Maupin, 2010). Implementation fidelity is assessed by observing and recording the behavior Co py ri gh t Am
  • 9. ti on . Observation and Measurement in Behavior Analysis 129 of the implementers as they observe and record the behavior of the clients or research participants and as the implementers carry out intervention proce- dures. Everything discussed in this chapter applies not only to observing and recording the behavior of clients or research participants, but also to measur- ing the behavior of the implementers. Defining the Target Behavior The target behavior should be defined in terms that are objective, clear, and complete (Kazdin, 2010). A behavioral definition must include active verbs describing the individual’s actions, that is, the topog- raphy or form of the action being observed. Some behavioral definitions may also include the environ- mental events that precede (antecedents) or follow (consequences) the behavior. Behavioral definitions cannot include category labels (e.g., aggression) or appeal to internal states or characteristics (e.g., strong willed) but rather must identify the topogra- phy of the behavior. A behavioral definition should be easy to read and should suffice as a starting point for the observer to engage in data collection. Once a behavior analyst begins to observe instances of the
  • 10. behavior, the behavioral definition may be modified on the basis of those observations. Some examples of target behavior definitions used in behavior-analytic research are shown in Table 6.1. Note the precise descriptions of behavior in these examples and the inclusion of the appropriate context for the behavior (e.g., unscripted verbalizations are “verbalizations that were not modeled in the video script but were appropriate to the context of the toy”) or the neces- sary timing of the behavior in relation to other events (e.g., an acceptance occurs when “the child’s mouth opened . . . within 3 seconds after the food item was held within 1 inch of the mouth”). LOGISTICS OF OBSERVATION Once the target behavior is identified and defined, the time and place of observation must be deter- mined and the observers identified. These logistics of observation are not insignificant, because the choices of observation periods and observers will determine the quality of the data derived from the observations. TABLE 6.1 Examples of Target Behavior Definitions From Published Articles Involving Behavior Analytic Assessment and Treatment Label Definition Citation Empathy “A contextually appropriate response to a display of affect by a doll, puppet, or person that contained motor and vocal components (in any order) and began within 3 s of the end of the display.” (p. 20)
  • 11. Schrandt, Townsend, and Poulson (2009) Acceptance “The child’s mouth opened so that the spoon or piece of food could be delivered within 3 s after the food item was held within 1 in. of the mouth.” (p. 329) Riordan, Iwata, Finney, Wohl, and Stanley (1984) Expulsion “Any amount of food (that had been in the mouth) was visible outside the mouth (Joan only) or outside the lip and chin area (Nancy, Jerry, Holly) prior to presentation of the next bite.” (p. 329) Riordan et al. (1984) Activity engagement “Facial orientation toward activity materials, appropriate use of activity materials, or comments related to the activity.” (p. 178) Mace et al. (2009) Compliance “The child independently completing or initiating the activity described in the instruction within 10 s.” (p. 535) Wilder, Zonneveld, Harris, Marcus, and Reagan (2007) Unscripted verbalizations “Verbalizations that were not modeled in the video script
  • 12. but were appropriate to the context of the toy [that was present].” (p. 47) MacDonald, Sacramone, Mansfield, Wiltz, and Ahern (2009) Co py ri gh t Am er ic an P sy ch ol og ic al A ss oc ia ti on . No t
  • 13. fo r fu rt he r di st ri bu ti on . Miltenberger and Weil 130 Time and Place of Observations Observation periods (the time and place chosen for observation) should be scheduled when the target behavior is most likely to occur (or, in the case of behavioral deficits, when the target behavior should be occurring but is not). In some cases, the target behavior occurs mostly or exclusively in the context of specific events (e.g., behavioral acquisi- tion training in academic sessions or athletic perfor- mance), and therefore, observation sessions have to occur at those times. A behavior analyst, however,
  • 14. may be interested in measuring the target behavior in naturalistic settings in which the behavior is, for the most part, free of temporal constraints. In these instances, it is possible to interview the client and significant people to narrow the observation win- dow. In addition, it may be valuable to validate the reports by collecting initial data on the occurrence of the target behavior. For instance, scatterplot assessments, which identify at half-hour intervals throughout the day whether the behavior did not occur, occurred once, or occurred multiple times, may help identify the best time to schedule the observation period (Touchette, Macdonald, & Langer, 1985). In instances in which reports on the occurrence of the target behavior are not available or when the reports are not descriptive enough, the behavior analyst should err on the side of caution and conduct a scatterplot assessment or other initial observations to narrow the observation window. Identifying the times at which the target behavior is most likely to occur is desirable to capture the greatest number of instances. The rationale for observing and recording as many instances of the behavior as possible rests with evaluation of func- tion during assessment and analysis of the effects of the independent variable during intervention. When it is not possible to observe enough instances of the behavior across a number of observation periods to establish clear relations between the behavior and specific antecedents and consequences, treatment implementation may be delayed. With behavior that occurs at a lower rate, a longer time frame of obser- vation may be necessary to establish functional relations.
  • 15. Although a delay to intervention after a baseline may be acceptable in some situations, in others it could be undesirable or unacceptable for the client or significant others, such as teachers or parents. Such delays can sometimes be circumvented by structuring observations in an analog setting to eval- uate the effects of likely antecedent and consequent stimuli with the objective of evoking the target behavior. Alternatively, samples of the behavior might be collected in the natural environment at various times to provide a sufficient baseline that would allow making an accurate assessment of func- tion, deciding on an appropriate intervention, or both. Circumstances such as availability of observers and the client’s availability must also be considered. A final consideration in preparing to make obser- vations is to select a placement within the observa- tion environment that permits a full view of the person and the behavior of interest while at the same time minimizing disruptions to the client or others in the environment. In addition, when col- lecting IOA data, it is important for both observers to see the same events from similar angles and dis- tances but simultaneously maintain their status as independent observers. Depending on the character- istics of the setting, issues may arise, such as walls or columns that impede seeing the behavior and interruptions from staff or other individuals. Disrup- tions in the environment are also a concern. For example, children in elementary school classrooms are notorious for approaching and interacting with an adult while he or she is observing and recording the target behavior. In addition, if the target child is identified, the other children may cause disruptions
  • 16. by talking to the target child or behaving in other- wise disruptive ways. Any disruption should be recorded so that it can be considered in accounting for variability in the data. Selecting Observers Most behavioral observations in research and prac- tice are conducted by trained observers. Trained observers may not be needed in some laboratory set- tings in which permanent products are produced or equipment records the behavior automatically. However, in applied settings, individuals conducting behavioral observations must see the behavior as it occurs so data can be collected onsite or recorded for review at a later time. Individuals who could Co py ri gh t Am er ic an P sy ch ol og ic
  • 17. al A ss oc ia ti on . No t fo r fu rt he r di st ri bu ti on . Observation and Measurement in Behavior Analysis 131 conduct behavioral observations in the same setting
  • 18. as the client include participant observers (individu- als who are typically present in the environment), nonparticipant observers (data collectors who are external to the typical workings of the environ- ment), or the client whose behavior is being observed (self-monitoring). Participant observers. According to Hayes, Barlow, and Nelson-Gray (1999), participant observ- ers may be used in situations in which a significant other or other responsible party in the setting (e.g., parent, teacher) is available (and trained) to col- lect data. The primary advantage of including these individuals as observers is that they are already in the environment, which eliminates the potential logistical problems of scheduling nonparticipant observers. In addition, the likelihood of the child or student showing reactivity to observation is less- ened because the person being observed is likely to have habituated to the participant observer’s pres- ence over time. A limitation when using participant observers is that the observers may not have time to conduct observations because of their other respon- sibilities in the setting. One factor to consider when arranging partici- pant observation (and nonparticipant observation) is the possibility of surreptitious observation. With surreptitious observation, the participant observer would not announce or otherwise cue the partici- pant to the fact that a particular observation session is taking place (e.g., Mowery, Miltenberger, & Weil, 2010). For example, in Mowery et al. (2010), gradu- ate students were present in a group home setting to record staff behavior. However, the staff members were told that the students were there to observe
  • 19. and record client behavior as part of a class project (this deception was approved by the institutional review board, and participants were later debriefed). Surreptitious observation leads to less reactivity in the person being observed. For surreptitious obser- vation to occur ethically, the client or participant must consent to observation with the knowledge that he or she will not be told, and may not be aware of, the exact time and place of observation (e.g., Wright & Miltenberger, 1987). The exception would be when a parent or guardian gives consent for surreptitious observation of a child or a researcher gets institutional review board approval for deception and later debriefs the participants. Nonparticipant observers. When it is either impossible or undesirable to involve a participant observer, nonparticipant observers who are not part of the typical environment are used. For instance, observations in school settings may require that an observer sit in an unobtrusive area of the classroom and conduct observations of the child at various times of the day. Three challenges of having non- participant observers involved in data collection are access, scheduling, and cost. Because observations tend to occur while clients are involved in social set- tings, it may not be permissible to observe because of the potential for disruption or for reasons of confidentiality. In the latter case, when conducting observations of the behavior of a single individual in a group setting such as a classroom, it is typical to require consent of all students in the group because all are present during the observation. This is espe- cially true when observations of minors occur.
  • 20. Because observation periods may be relatively short (especially in the context of research), it may also be difficult to schedule an observer several times a day or week to collect data for only 15 to 60 minutes. In addition, the client’s schedule may restrict when observation may occur. Finally, a sig- nificant cost may be associated with the inclusion of skilled data collectors who may need to be hired to fulfill this role. Circumventing excessive costs is possible, however, if student interns or other staff already at the site are available. In addition to the monetary cost of the observers, there is cost in terms of time and effort to train the observers and conduct checks for IOA to ensure consistency in the data collected. Self-monitoring. When the target behavior occurs in the absence of others, it may be useful to have cli- ents observe and record their own behavior. When asking clients to record their own behavior, it is nec- essary to train them as you would train any observer. Although there are examples of research using data gathered through self-monitoring (e.g., marijuana use [Twohig, Shoenberger, & Hayes, 2007]; disrup- tive outbursts during athletic performances [Allen, Co py ri gh t Am er
  • 22. on . Miltenberger and Weil 132 1998]; physical activity levels [Van Wormer, 2004]; binge eating [Stickney & Miltenberger, 1999]), self-monitoring is less desirable than observation by another individual because it may be unreli- able. If the target behavior occurs in the absence of others, then IOA cannot be assessed. For example, Bosch, Miltenberger, Gross, Knudson, and Brower- Breitweiser (2008) used self-monitoring to collect information on instances of binge eating by young women but could not collect IOA data because binge eating occurred only when the individual was alone. Self-monitoring is best used when it can be com- bined with periodic independent observations to assess IOA. Independent observations occur when a second observer records the same behavior at the same time but has no knowledge of the other observer’s recording. Thus, the recording of both observers is under the stimulus control of the behav- ior being observed and is not influenced by the recording behavior of the other observer. When IOA is high, it might indicate that self-monitoring is being conducted with fidelity. It is possible, how- ever, that self-monitoring is conducted with fidelity only under the conditions of another observer being present, but not when the client is alone or away from the other observer. In some instances, it is pos-
  • 23. sible to collect secondary data or product measures that can be used to verify self-monitoring. For instance, researchers measured expired carbon mon- oxide samples in smoking cessation research (Brown et al., 2008; Raiff, Faix, Turturici, & Dallery, 2010) and tested urine samples in research on substance abuse (Hayes et al., 2004; Wong et al., 2003). Given the potential unreliability of self-monitoring, taking steps to produce the most accurate data pos- sible through self-monitoring is important. Such steps might include making a data sheet or data col- lection device as easy to use as possible, tying data collection to specific times or specific activities to cue the client to record his or her behavior, having other people in the client’s environment cue the cli- ent to conduct self-monitoring, checking with the client frequently by phone or e-mail to see whether self-monitoring is occurring, having the client sub- mit data daily via e-mail or text message, and prais- ing the client for reporting data rather than for the level of the behavior to avoid influencing the data. Even with these procedures in place, clients may still engage in data collection with poor fidelity or make up data in an attempt to please the therapist or researcher. Therefore, self-monitoring that lacks verification should be avoided as a form of data col- lection whenever possible. Training Observers Adequate observer training is necessary to have con- fidence in the data. Observing and recording behav- ior can be a complex endeavor in which the observer must record, simultaneously or in rapid order, a number of response classes following a specific pro-
  • 24. tocol, often while attending to timing cues (see Sam- pling Procedures section). Finally, following this routine session after session may lead to boredom and set the occasion for observer drift. Observer drift is the loosening of the observer’s adherence to the behavioral definitions that are used to identify the behavioral topographies to be recorded, a decrease in attending to specific features of the data collec- tion system, or both. When observer drift occurs, the accuracy and reliability of the data suffer, and faulty decisions or conclusions may result (see Kazdin, 1977). One way to train observers is to use behavior skills training (Miltenberger, 2012), which involves providing instructions and modeling, having the observer rehearse the observation and recording procedures, and providing feedback immediately after the performance. Such training occurs first with simulated occurrences of the target behavior in the training setting and then with actual occurrences of the target behavior in the natural environment. Subsequent booster sessions can be conducted in which the necessary training components are used to correct problems. To maintain adequate data col- lection, it is necessary to reinforce accurate data collection and detect and correct errors that occur. Several factors can influence the fidelity of data col- lection (Kazdin, 1977). These include the quality of initial training, consequences delivered for the target behavior (Harris & Ciminero, 1978), feedback from a supervisor for accurate data collection (Mozingo, Smith, Riordan, Reiss, & Bailey, 2006), complexity and predictability of the behavior being observed (Mash & McElwee, 1974), and the mere presence of a
  • 26. he r di st ri bu ti on . Observation and Measurement in Behavior Analysis 133 supervisor (Mozingo et al., 2006). With these factors in mind, strong initial training and periodic assess- ment and retraining of observers are recommended for participant observers, nonparticipant observers, and individuals engaging in self-monitoring. RECORDING PROCEDURES The procedures available for collecting data on tar- geted behavior are categorized as continuous record- ing procedures, sampling procedures, and product recording. Continuous Recording Continuous recording (also called event recording) procedures involve observation and recording of
  • 27. each behavioral event as it occurs during the obser- vation period. Continuous recording will produce the most precise measure of the behavior because every occurrence is recorded. However, continuous recording is also the most laborious method because the observer must have constant contact with the participant’s behavior throughout the observation period. As with all forms of data collection, continu- ous recording requires the behavior analyst to first identify the dimensions on which to focus. Observ- ers are recommended to initially collect data on multiple dimensions of the behavior (e.g., frequency and duration) to identify the most relevant dimen- sions and to then wean over the course of observa- tions as the analysis identifies the most important dimensions. For example, in a classroom situation involving academic performance, it may be useful to count the number of math problems completed cor- rectly, latency to initiate the task (and each prob- lem), and the time spent on each problem. If after several observations the observer finds that it takes a while for the child to initiate the task, resulting in a low number of problems completed, focusing on measuring latency to initiate the task and fre- quency of correct responses may be useful. Next, we describe data collection procedures related to differ- ent dimensions of behavior. Although we discuss the procedures separately, various combinations of these procedures may produce important data for analysis that would not be apparent with a focus on a single procedure. Frequency. Perhaps the most common form of continuous recording is frequency recording: count- ing the number of occurrences of the target behavior in the observation period (Mozingo et al., 2006).
  • 28. Frequency recording is most appropriate when the behavior occurs in discrete units with fairly consistent durations. In frequency recording, each occurrence of the target behavior (defined by the onset and offset of the behavior) is recorded in the observation period. Frequency data may be reported as total frequency—number of responses per obser- vation session—or converted to rate—number of responses per unit of time (e.g., responses per min- ute). Total frequency would only be reported if the observation periods were of the same duration over time. The advantage of reporting rate is that the measure is equivalent across observation periods of different durations. Frequency recording requires the identification of a clear onset and offset of the target behavior so each instance can be counted. It has been used with a wide range of target behavior when the number of responses is the most important characteristic of the behavior. Examples include recording the frequency of tics (Miltenberger, Woods, & Himle, 2007), greet- ings (Therrien, Wilder, Rodriguez, & Wine, 2005), requests (Marckel, Neef, & Ferreri, 2006), and math- ematics problems completed (Mayfield & Vollmer, 2007). When it is difficult to discriminate the onset or offset of the behavior or the behavior occurs at high rates such that instances of the behavior cannot be counted accurately (e.g., high-frequency tics or stereotypic behavior), a behavior sampling procedure (i.e., interval or time-sample recording; see below) is a more appropriate recording procedure. As we elab- orate on later, in sampling procedures the behavior is recorded as occurring or not occurring within con- secutive or nonconsecutive intervals of time, but individual responses are not counted.
  • 29. Four additional methods of recording frequency are frequency-within-interval recording, real-time recording, cumulative frequency, and percentage of opportunities. Each method has advantages over a straight frequency count. Frequency-within-interval recording. One limi- tation of frequency recording is that it does not Co py ri gh t Am er ic an P sy ch ol og ic al A ss oc ia ti
  • 30. on . No t fo r fu rt he r di st ri bu ti on . Miltenberger and Weil 134 provide information on the timing of the responses in the observation period. With frequency-within- interval recording, the frequency of the behavior is recorded within consecutive intervals of time to indicate when the behavior occurred within the observation period. To conduct frequency-within- interval recording, the data sheet is divided into con-
  • 31. secutive intervals, a timing device cues the observer to the appropriate interval, and the observer records each occurrence of the behavior in the appropriate interval. By providing information on the number of responses and the timing of responses, more precise measures of IOA can be calculated. Real-time recording. Combining features of fre- quency and duration procedures, real-time recording also allows the researcher to collect information on the temporal distribution of the target behavior over the course of an observation period (Kahng & Iwata, 1998; Miltenberger, Rapp, & Long, 1999). Through use of either video playback or computers in real time, it is possible to record the exact time of onset and offset of each occurrence of the behavior. For discrete momentary responses that occur for 1 second or less, the onset and offset are recorded in the same second. Real-time recording is especially valuable when conducting within-session analysis of behavioral sequences or antecedent–behavior–consequence rela- tions. Borrero and Borrero (2008) conducted real- time observations that included the recording of both target behavior and precursor behavior or events related to the target behavior. These data were then used to construct a moment-to-moment analysis (lag- sequential analysis) that provided probability values for the occurrence of the precursor given the target behavior and of the target behavior given the precur- sor. The probability of a precursor reliably increased approximately 1 second before the emission of the target behavior. In addition, the probability of the tar- get behavior was greatest within 1 second after the precursor behavior or event. The real-time analysis
  • 32. suggested that the precursor behavior or event was a reliable predictor of the target behavior. Additional analysis showed that both the precursor behavior and the target behavior served the same function (e.g., both led to escape from demands). Cumulative frequency. The origins of measuring operant behavior involved the use of an electrome- chanical data recording procedure that was designed to record instances of behavior cumulatively across time (Skinner, 1956). Each response produced an uptick in the data path as the pen moved across the paper and the paper revolved around a drum. The original paper records of this recording were only about 6 inches wide, and thus the pen used to record responses would, on reaching the top of the paper, reset to the bottom of the paper and continue recording the responses. Increasing slopes indicated higher response rates; horizontal lines indicated an absence of the response. This apparatus for the automatic recording of cumulative frequencies is no longer used, but the usefulness of cumulative response measures persists. In cumulative frequency graphs, data are displayed as a function of time across the x-axis and cumula- tive frequency along the y-axis. The frequency of responses that occur in a given time period is added to the frequency in the previous time period. Thus, data presented in a cumulative record must either maintain at a particular level (no new responses) or increase (new responses) across time but never decrease. The use of cumulative frequency plots allows one to assess frequency and temporal pat- terns of responding.
  • 33. Percentage of opportunities. In some cases, recording the occurrence of a response in relation to a specific event or response opportunity is use- ful. In such cases, the percentage of opportunities with correct responses is more important than the number of responses that occurred. For example, in recording compliance with adult requests, the per- centage of requests to which the child responds cor- rectly is more important than the number of correct responses. Ten instances of compliance are desirable if 10 opportunities occur. However, 10 instances of compliance are much less desirable in relation to 30 opportunities. Other examples include the percentage of math problems completed correctly, percentage of free throws made in a basketball game, percentage of signals detected on a radar screen dur- ing a training exercise, and percentage of trials in which an item is labeled correctly during language Co py ri gh t Am er ic an P sy ch
  • 35. 135 training. Considering that the number of opportuni- ties might vary in each of these cases, the percentage of opportunities is a more sensitive measure of the behavior than a simple frequency count or a rate measure. When a percentage-of-opportunities measure is used, reporting the number of opportunities as well as the percentage of correct responses is important. If the number of opportunities is substantively dif- ferent across observations, it may affect the variabil- ity of the data and the interpretation of the results. For instance, if on one occasion a child is provided with 10 spelling words and spells eight correctly, the result is 80% correct. The next day, if the two words spelled incorrectly are retested and the child spells one of the words correctly, the second performance result is 50% correct. These data are not comparable because the number of opportunities varied greatly, and inappropriate conclusions could be drawn from the results if only percentages were reported. In these instances, providing an indicator of the num- ber of opportunities to respond in the graphical rep- resentation of the data will assist the reader in interpreting the results. Duration. When each response lasts for an extended period of time or does not lend itself to a frequency count (e.g., as in behavior such as read- ing or play), it may be useful to record the duration of the behavior, that is, the time from its onset to its offset. Duration recording is desirable when the most important aspect of the behavior is the length of time for which it occurs. For example, if the
  • 36. interest were in sustained performance or time on task, duration recording is appropriate. If classroom teachers are concerned with sustained engagement in academic activities, the observer would identify the length of time that engagement is desired (such as in reading) and collect data on the duration of engagement to identify any discrepancy between the target duration and actual performance. Once a discrepancy is determined to exist, programming for successively longer durations could be initiated. Other situations involve a combination of dura- tion and frequency recording, as when the goal is to decrease a young child’s tantrum behavior. If tan- trums occur multiple times per day and each tantrum continues for a number of minutes, recording both frequency and duration will reveal whether tan- trums are occurring less often and occurring for shorter periods of time after intervention. Finally, many types of behavior targeted in applied work do not lend themselves readily to fre- quency counts because they consist of (a) responses that occur rapidly and repetitively over extended periods of time (such as stereotypic behavior), (b) complexes of discrete responses integrated into chains or other higher order units, or (c) both. For rapid, repetitive responses, for which each onset and offset is not easily discriminated, a duration measure can be used. In such cases, a time period in which the behavior is absent can help the observer discrim- inate the end of one episode and the start of the next. For target behavior consisting of multiple compo- nent behaviors, the target behavior might be defined as the entire chain, and a duration measure would
  • 37. then consist of recording the time from the onset of the first response in the chain to the offset of the last response in the chain. Finally, in some instances duration is used to measure a behavior with multiple component responses when it does not make sense to reduce the behavior to a frequency count of its component responses. For example, duration of play would be of greater interest to a parent trying to increase a child’s play time than would a frequency count of the number of steps the child traveled across the playground, went up and down a slide, or moved back and forth on a swing. Latency. Latency is the length of time from the pre- sentation of a discriminative stimulus to the initia- tion of the behavior. Latency is of interest when the speed of initiation of the behavior is an important feature. For example, latency is the time from the sound of the starter’s pistol to the sprinter’s move- ment off the starting blocks, the time it takes for a child to initiate a task after the teacher’s request, or the time it takes the wait staff at a restaurant to respond once a customer is seated. When working with a child who does not com- plete math problems in the allotted time, for exam- ple, latency indicates how long it takes the child to initiate the task. By contrast, duration assesses how long it takes the child to complete each problem Co py ri gh
  • 39. bu ti on . Miltenberger and Weil 136 once he or she starts working on it. Depending on the child and the circumstance, one or both dimen- sions may be an important focus of assessment and intervention. Magnitude. On occasion, evaluating the magni- tude or intensity of behavior is useful. One example of response magnitude is the force exerted (e.g., muscle flexion), and another is the loudness of a verbal response (as measured in decibels). Although decreases in frequency, and perhaps duration, of undesirable behaviors such as tantrums or self- injury are important, a reduction in magnitude may be an important initial goal. In some cases, reduc- tions in magnitude may be observed before substan- tial decreases occur on other dimensions, such as frequency and duration. Alternatively, magnitude may increase temporarily during an extinction burst before the behavior decreases in frequency, duration, or intensity. Recording magnitude may be valuable when considering recovery from an accident or injury
  • 40. such as a knee injury for a football player. Measure- ment would pertain to the ability of the affected muscles to exert force after rehabilitation. In these situations, recording magnitude tends to require equipment such as that used by physical therapists to evaluate force. Direct observation of response magnitude may not always measure force, however. Observers can use intensity rating scales to evaluate the magnitude of a response. For instance, given a scale ranging from 1 to 10, a teacher may rate the intensity of each occurrence of an undesirable behavior. In using rat- ing scales, it is important to anchor the points within the scale such that two observers can agree on the level of intensity given a variety of occur- rences of the behavior (e.g., 1 = mild whining, 10 = loud screaming, throwing items, and head banging). Although anchoring categories on a scale is consid- ered valuable to decrease the variability in respond- ing across observers, the literature is not clear as to how many individual categories need be defined (Pedhazur & Schmelkin, 1991). Another example in which magnitude can be measured with a rating scale is the intensity of a fear response (Milten- berger, Wright, & Fuqua, 1986; Twohig, Masuda, Varra, & Hayes, 2005) or other emotional responses (Stickney & Miltenberger, 1999). In general, inten- sity rating scales present issues of both reliability and validity because the ratings that might be assigned to specific instances of behavior may be ambiguous; this is especially true when rating fear or emotional responses because the magnitude of these behaviors can be rated only by the individual engaging in the behavior.
  • 41. Sampling Procedures It may not always be possible to collect adequate information on the target behavior using continuous recording procedures. When the onset and offset of each instance of the behavior cannot be identified, continuous recording is not possible. Likewise, the constraints imposed by some environments, some target behaviors, or some observers may make con- tinuous recording impossible. For example, the person exhibiting the target behavior might not be continuously in sight of the observer, the target behavior might occur almost exclusively when the individual is alone, or the observer might have other responsibilities that compete with observation. In these instances, it may be desirable, and necessary, to collect samples of the behavior that provide an estimate of the behavior’s true level. Behavior- sampling procedures include interval recording and time-sample recording. In both procedures, the observation period is divided into smaller units of time, and the observer records whether the behavior occurred in each interval. Interval recording. Interval recording involves dividing the observation period into equal consecu- tive intervals and recording whether the behavior occurred in each. Interval recording is different than frequency recording or frequency-within- interval recording in that an interval is scored once regardless of whether a single instance or multiple instances of a behavior occurred during the interval. In behavior analysis research, intervals are usually short—typically 10 to 15 seconds (DiGennaro et al., 2007; Mace et al., 2009). Short intervals (usually less than 20 seconds) are valuable when behavior
  • 42. occurs at moderate to high frequencies or when multiple topographies of behavior are recorded. Co py ri gh t Am er ic an P sy ch ol og ic al A ss oc ia ti on . No t fo r fu
  • 43. rt he r di st ri bu ti on . Observation and Measurement in Behavior Analysis 137 Valuable too are shorter intervals when temporal correlations may yield information on antecedent events and potential maintaining consequences. When interested in the relation between the target behavior and antecedents and consequences, the observer records whether any of the three events occurred in each interval to examine the temporal patterns of the behavior and its potential controlling variables (e.g., Repp & Karsh, 1994). An additional condition under which shorter intervals are valuable is when an understanding of within-session tem- poral distribution of the behavior is necessary. For example, to determine whether self-injurious behav- ior is high in a functional analysis condition because
  • 44. of an extinction burst, the behavior analyst identi- fies whether more intervals were scored early in the session than later in the session (Vollmer, Marcus, Ringdahl, & Roane, 1995). Similar patterns could be discerned with cumulative frequency recording or real-time recording as well. In some applied settings, however, intervals might be much longer—perhaps 15 or 30 minutes (Aikman & Garbutt, 2003)—when behavior occurs less frequently. Under these conditions, it may be difficult to draw useful correlations between ante- cedent and consequent events and the behavior as well as behavior–behavior relations. Such limita- tions notwithstanding, longer intervals are typically used for the convenience of data collectors (often participant observers) who can engage in other responsibilities and still collect data. Typically, the observer has a data sheet with con- secutive intervals designated for recording, and dur- ing the observation period, the observer is prompted with auditory (through headphones so as to not dis- rupt the ongoing behavior of the observee) or tactile (vibration) cues delivered via a timing device to move from interval to interval while observing and recording the target behavior. As time passes, the observer records the occurrence of the target behav- ior in the appropriate interval; a blank interval indi- cates the nonoccurrence of the behavior in that interval. In some cases, a computer is used for data collection, and as the observer records the behavior, the software puts the data into the proper interval. At the end of the observation period, the number of intervals in which the behavior is observed is
  • 45. divided by the number of observation intervals, and the result is reported as the percentage of intervals in which the behavior occurred. A similar process is used for time-sample recording (described in the next section). The two types of interval recording procedures are partial-interval recording and whole-interval recording. In partial-interval recording, the observer records the occurrence of the target behavior if it occurred at any time within the interval. That is, the interval is scored if the target behavior occurred briefly in the interval or throughout the entire inter- val. Furthermore, if the onset of the behavior occurs in one interval and its offset occurs in the next, both intervals are scored (e.g., Meidinger et al., 2005). In whole-interval recording, the interval is scored only if the target behavior occurred throughout the entire interval. Whole-interval recording is more useful with continuous behavior (e.g., play) than with discrete or quickly occurring behavior (e.g., a face slap). Typically, whole-interval recording is used when a behavior occurs over longer periods of time, as might be seen with noncompliant behavior or on-task behavior. For example, Athens, Vollmer, and St. Peter Pipkin (2007) recorded duration of on- task behavior in 3-second intervals only if the behavior was present for the entire interval. Time-sample recording. In time-sample record- ing, the observation period is divided into intervals of time, but observation intervals are separated by periods without observation. Time-sample recording permits the observer to focus on other tasks when not observing the target behavior. For example, the
  • 46. observation period might be divided into 15-second intervals, but observation occurs only at the end of the interval. Likewise, an observation period might be divided into 30-minute intervals, but observa- tion and recording occur only in the last 5 minutes of every 30 minutes. These intervals can be equally divided, as when an observation occurs every 15 minutes, or variably divided to provide some flexi- bility for the observer (such as a teacher who cannot observe exactly on the quarter hour). The data are displayed as a percentage (the number of intervals with target behavior divided by the number of inter- vals of observation). Co py ri gh t Am er ic an P sy ch ol og ic al A
  • 47. ss oc ia ti on . No t fo r fu rt he r di st ri bu ti on . Miltenberger and Weil 138 For instance, if evaluating the extent of social interactions between adolescents on a wing of an inpatient psychiatric facility were desirable, con-
  • 48. ducting observations every 15 minutes might be possible. In this example, the observer would be engaged in a job-related activity and, when prompted by a timer, look up from his or her work, note whether the target behavior was occurring, and record the result. Data of this sort could identify which of the adolescents tend to engage in social interactions and the typical times at which social interactions are likely to occur. From this sampling approach, it is possible to refine the data collection process toward a more precise measure of behavior. Interval and time-sample recording have benefits and limitations. The benefit of interval recording is that with consecutive observation intervals, no instance of the target behavior is missed during the observation period. The limitation, especially with shorter intervals, is that it requires the continu- ous attention of, and frequent recording by, the observer, making it difficult for the observer to engage in other activities during the observation period. A limitation of time-sample recording is that because observation intervals are separated by peri- ods without observation, some instances of the tar- get behavior may be missed during the observation period. However, a benefit is that the observer can engage in other activities during the periods between observation intervals, making the proce- dure more user friendly for participant observers such as teachers or parents. Although interval and time-sample recording procedures are used widely in behavior-analytic research, some authors have cautioned that the results of these sampling procedures might not always correspond highly with data collected
  • 49. through continuous recording procedures in which every behavioral event is recorded (e.g., Rapp et al., 2007; Rapp, Colby-Dirksen, Michalski, Carroll, & Lindenberg, 2008). In summarizing the numerous studies that have compared interval and time- sample recording with continuous recording proce- dures, Rapp et al. (2008) concluded that interval recording tends to overestimate the duration of the behavior, time-sample procedures with small inter- vals tend to produce accurate estimates of duration, and interval recording with small intervals tends to produce fairly accurate estimates of frequency. Although Rapp et al. provided several suggestions to guide decision making regarding the use of interval and time-sample procedures, they concluded by suggesting that small interval sizes in interval and time-sample procedures are likely to produce the best results. Product Recording In some cases, the outcome or the product of the behavior may be of interest, either as a primary dependent variable or as a complement to direct observation of the behavior itself. When the behav- ior changes the physical environment, this product can be recorded as an index of the occurrence of the behavior. In some instances, collecting data on products is valuable because measuring the behavior directly may not be possible. For example, weight is measured in weight-loss programs because measur- ing the behavior that produces weight loss (i.e., diet and exercise) is usually not feasible. Examples of product recording may include number of academic problems completed or number of units assembled in a factory. In each case, the occurrence of the
  • 50. behavior is not observed directly; rather, the prod- ucts of the behavior are recorded as an indication of its occurrence. In such cases, a focus on the prod- ucts of behavior is easier and more efficient than recording the behavioral events as they occur. An important note in recording permanent products is that although the focus is on results, if the results fall short of expected quantity or quality, the focus can then turn to evaluation of the behavior involved in producing the products being measured (Daniels & Daniels, 2004). Beyond measuring the production of tangible items, product recording can be used to measure the physical damage caused by a problem behavior. For example, self-injurious behavior can produce tissue damage such as bruises, lacerations, or other bodily injuries, and product recording could be used to assess the severity of these injuries. Iwata, Pace, Kissel, Nau, and Farber (1990) developed the Self- Injury Trauma Scale to quantify surface injury resulting from self-injurious behavior. Other exam- ples of this type of product recording include the Co py ri gh t Am er ic
  • 52. Observation and Measurement in Behavior Analysis 139 assessment of the size of a bald area related to chronic hair pulling (Rapp, Miltenberger, & Long, 1998; Rapp, Miltenberger, Long, Elliott, & Lumley, 1998) or the length of fingernails as a measure of nail biting (Flessner et al., 2005; Long, Milten- berger, Ellingson, & Ott, 1999). Still other examples of product recording include a measure of weight or body mass index as an indication of changes in eat- ing (Donaldson & Normand, 2009; see also Young et al., 2006), measuring chemicals in urine samples as a measure of drug ingestion (Silverman et al., 2007), or weighing food before and after a feeding session to assess the amount of food consumed (Kerwin, Ahearn, Eicher, & Swearingin, 1998; Maglieri, DeLeon, Rodriguez-Catter, & Sevin, 2000; Patel, Piazza, Layer, Colemen, & Swartzwelder, 2005). An advantage of product recording is that the observer does not have to be present to record the occurrence of the behavior (Miltenberger, 2012) because the product can be recorded at a more con- venient time after the behavior has occurred (e.g., at the end of the class period or after the shift in a fac- tory). A drawback of product recording, especially when used with a group of individuals, is that it might not be possible to determine which person engaged in the behavior that resulted in the product. Perhaps another student completed the academic problems or another worker helped produce the
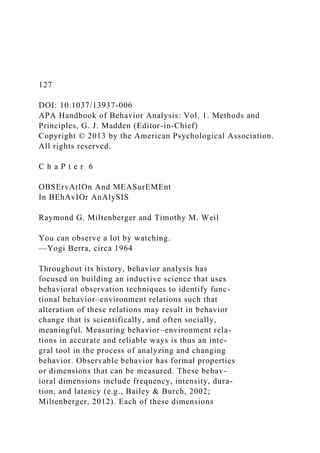
  • 53. units in the factory (Jessup & Stahelski, 1999). Although product recording is valuable when the interest is in the tangible outcome of the behavior, there must be some way to determine which indi- vidual was responsible for the products being mea- sured (e.g., did the urine sample come from the client or someone else?). Another potential problem with some uses of product recording is that it may not identify the behavior that resulted in the prod- uct. For example, correct answers to math problems may have been produced by cheating, and weight loss may have been produced through self-induced vomiting rather than an increase in exercise or a reduction in calorie consumption. Recording Devices Once the appropriate recording procedure has been chosen, the next step is to choose a recording device. Because the observer must record instances of the behavior as they occur, the observer’s behav- ior must result in a product that can be used later for purposes of analysis. A recording device allows the observer to produce a permanent product from the observation session. The most commonly used recording device is a data sheet structured for the type of recording procedure being conducted. Figures 6.1, 6.2, and 6.3 show sample data sheets structured for frequency recording, duration record- ing, and interval recording, respectively. Although data sheets are used most often for data collection, other recording devices, both low tech and high tech, can be used to record instances of the behavior. Several types of low-tech recording devices have been used, such as wrist counters
  • 54. for frequency recording (Lindsley, 1968) or stop watches for duration recording. Still other possibili- ties include activities as simple as moving beads from one side of a string to the other, placing a coin from one pocket to another, making small tears in a piece of paper, or making a hash mark on a piece of masking tape affixed to the recorder’s sleeve to record frequency (Miltenberger, 2012). In fact, it is feasible to record frequency with whatever may be available in the environment as long as the observer can produce a product that represents the occur- rence of the behavior. Although recording on a data sheet is the most frequently used data collection process, with rapidly changing technologies there is a move to identify high-tech methods to streamline and automate data collection (Connell & Witt, 2004; Jackson & Dixon, 2007; Kahng & Iwata, 1998). In applied behavior analysis research, electronic devices such as a per- sonal digital assistant (Fogel, Miltenberger, Graves, & Koehler, 2010) or hand-held or laptop computers (Gravlee, Zenk, Woods, Rowe, & Schulz, 2006; Kahng & Iwata, 1998; Repp, Karsh, Felce, & Ludewig, 1989) are frequently used for data collec- tion. In addition, the use of bar codes and scanners (Saunders, Saunders, & Saunders, 1993) for data collection has been reported. With bar code scan- ners, an observer holds a small battery-powered scanning device and a sheet of paper with the bar codes ordered according to behavioral topography. When the target behavior is observed, the data col- lector scans the relevant bar code to record the Co py
  • 56. di st ri bu ti on . Miltenberger and Weil 140 occurrence of the behavior and the time within the observation period. The use of bar codes is, how- ever, only one of several ways to conduct electronic recording of behavior. In one investigation evaluating a shaping proce- dure to increase the reach of a pole vaulter, a photo- electric beam was used to determine the height of the vaulter’s reach just after planting the pole for the vault (Scott, Scott, & Goldwater, 1997). Another high-tech method of data collection involves soft- ware for cell phones. These software applications, colloquially referred to as apps, allow behavior ana- lysts to use the computing power of their phones for data collection. The advantages of this technol- ogy are numerous; however, the most obvious bene- fits are the use of a small, portable device that can
  • 57. Duration Data Form Child: James M. Start Date: 9/15/2010 Setting: Mathematics Observer: R.M. Primary/Reliability Instructions: First, indicate date of observation in the far left column. Second, identify the start time (onset) and the stop time (offset) for each occurrence of the behavior. Use more than one line if necessary. Definition of behavior:_____________________________________________ ____________ _____________________________________________________ _______________________ Date Onset Offset Onset Offset Onset Offset Onset Offset DailyDuration FIGURE 6.2. An example of a duration data sheet that provides information on the onset and offset of each occurrence of the behavior and the frequency of the behavior each day. Frequency Data Form Child: James M. Start Date: 9/15/2010 Setting: Mrs. Johnson’s Class Observer: R.M. Primary/Reliability Instructions: First, indicate date of observation in the far left
  • 58. column. Second, place a tick mark for each occurrence of behavior during the specified academic activity for that day. Definition of behavior:_____________________________________________ ____________ _____________________________________________________ _______________________ Date CircleTime Mathematics Individual Reading Social Studies Science Writing Daily Total FIGURE 6.1. Example of a daily frequency data sheet that involves a break- down of the frequency of the behavior by curricular areas in a general education classroom setting. Co py ri gh t Am
  • 60. on . Observation and Measurement in Behavior Analysis 141 facilitate any form of data collection mentioned thus far and the ability to graph the data. Finally, these graphs can be sent via text message to parents, teachers, or colleagues (Maher, 2009). Undoubtedly, as technology advances, even more high-tech data collection methods will emerge. Reactivity of Observation A long-standing concern for behavioral researchers is how observation affects performance (e.g., Par- sons, 1974). Reactivity is the term used to describe changes in behavior resulting from the act of observ- ing and recording the behavior. Typically, when reactivity occurs, the behavior changes in the desired direction (e.g., Brackett, Reid, & Green, 2007; Mowery et al., 2010). Several researchers have evaluated the effects of staff reactivity to observa- tions (Boyce & Geller, 2001; Brackett et al., 2007; Codding, Livanis, Pace, & Vaca, 2008; Mowery et al., 2010). Mowery et al. (2010) evaluated staff adherence to a protocol designed to increase the fre- quency of staff’s positive social initiations during lei- sure activities with adults with developmental disabilities. They evaluated the effects on staff behavior of having a supervisor absent or a supervi-
  • 61. sor present in the environment to determine whether reactivity to the supervisor’s presence would occur. Positive social interactions only Interval Data Form Child: James M. Date: 9/15/2010 Setting: Mathematics Observer: R.M. Primary/Reliability Instructions: Place a check mark in the appropriate column to reflect the events that occurred in each 10–s interval. Definition of behavior:_____________________________________________ ____________ _____________________________________________________ _______________________ 10-s Intervals Demand Placed Aggression Attention Ignore Escape 1 2 3 4 5 6 7 8 9
  • 62. 10 11 12 13 14 15 16 17 18 19 20 21 22 23 24 25 26 27 28 29 30 FIGURE 6.3. An example of a 10-second interval data sheet (partial or whole) that provides information on the occurrence of the target behavior and probable antecedents and consequences. In this example, the hypothesis is that the aggressive behavior occurs after the delivery of a demand by the teacher. In addition, potential responses by the teacher to the problem behav- ior are included. When completed, this data sheet will provide information on the temporal relationship between teacher behavior and student problem
  • 64. rt he r di st ri bu ti on . Miltenberger and Weil 142 occurred at acceptable levels when the supervisor was present, suggesting that reactivity is an impor- tant issue to consider in the valid assessment of staff performance. Considering reactivity to observation in research or clinical settings is important because the target behavior may be influenced not only by the inter- vention but also by the act of observing. When responding comes under the stimulus control of an observer, the level of behavior in the presence of the observer is likely to be different than in the absence of the observer. Considering that most staff behavior must be performed in the absence of supervision, conducting observations without reactivity to obtain
  • 65. an accurate characterization of the behavior is important. There are a variety of ways in which to minimize reactivity. For instance, making observers a part of the regular environment for several ses- sions or weeks before actual data collection occurs may result in habituation to the presence of the observers. It is important to keep in mind that habit- uation to the observer is only likely to occur as long as the observer does not interact with the person being observed and no consequences are delivered by the observer or others who may be associated with the observer. If the setting permits, reactivity may be avoided in other ways. Video monitoring devices mounted unobtrusively in the setting may be used. In instances in which the cameras can be seen by the person being observed, habituation to the presence of the camera is likely to occur in the absence of feedback or consequences contingent on perfor- mance (e.g., Rapp, Miltenberger, Long, et al., 1998). In addition, using an observation room equipped with a one-way observation window provides the observer an opportunity to conduct unannounced observations. If the use of an observation window is not possible, the use of confederates may be consid- ered. Although confederates are present in the set- ting to collect data (unobtrusively), a benign purpose for their presence other than data collection is provided to those being observed. That is, decep- tion is used to conceal the true purpose of the observers’ presence. As mentioned in the Mowery et al. (2010) study, confederates may be used to increase the chances that the data collected are representative of typical levels (the level expected in
  • 66. the absence of observation). Confederates can be any variety of individuals such as a coworker, class- mate, spouse, or person external to the setting as seen in Mowery et al. (2010), in which observers were introduced as student social workers who were in the setting to observe individuals with intellectual disabilities. In recent research on abduction prevention, chil- dren were observed without their knowledge to assess their safety skills as a confederate approached and attempted to lure them in a store setting (Beck & Miltenberger, 2009). Research on child safety skills training has demonstrated that children are more likely to respond correctly when they are aware of observation than when they are not aware of observation (Gatheridge et al., 2004; Himle, Miltenberger, Gatheridge, & Flessner, 2004). An important caveat is that the use of confederates may raise ethical concerns and should be approached cautiously. The use of video or other inconspicuous monitoring systems may present the same ethical concerns and thus should also be approached with caution. Prior approval is needed when using decep- tive covert observation. Additionally, for research purposes such covert observation must be approved by an institutional review board with appropriate debriefing afterward. INTEROBSERVER AGREEMENT Within research and practice in applied behavior analysis, accurate data collection is important (see Chapter 7, this volume). Accuracy refers to the extent to which the recorded level of the behavior matches the true level of the behavior (Cooper et al.,
  • 67. 2007; Johnston & Pennypacker, 1993; Kazdin, 1977). To evaluate accuracy, a researcher must be able to obtain a measure of the true level of the behavior to compare with the measurement of the behavior produced by the observer. The difficulty arises in obtaining the true level of the behavior, as most recording is done by humans who must dis- criminate the occurrence of the behavior from non- occurrences (a stimulus–control problem). A “truer” level of the behavior may be obtained through mechanical means, but equipment also may fail Co py ri gh t Am er ic an P sy ch ol og ic al A ss oc
  • 68. ia ti on . No t fo r fu rt he r di st ri bu ti on . Observation and Measurement in Behavior Analysis 143 on occasion and produce errors. Alternatively, automated recording devices may fail to register responses that vary slightly in topography or loca- tion. Thus, knowing the true level of the behavior with certainty is impossible, and therefore accuracy
  • 69. is not measured in behavioral research. Instead, behavior analysts train observers so that the data they collect are in agreement with those collected by another observer who has received training in recording the target behavior. Although measuring agreement between observers provides no information about the accuracy of either set of observations, it does improve the believability of the data. That is, when two independent observers agree on every occurrence and nonoccurrence of behavior, one has more confidence that they are using the same definition of the target behavior, observing and recording the same responses, and marking the form correctly (Miltenberger, 2012). If a valid definition of the behavior of interest is being used, then high agreement scores increase the belief that the behav- ior has been recorded accurately; although, again, accuracy has not been measured. A frequently used measure of agreement between observers is simply the percentage of observations that agree, a measure commonly referred to as IOA. IOA is calculated by dividing the number of agree- ments (both observers recorded the occurrence or nonoccurrence of the behavior) by the number of agreements plus disagreements (one observer recorded the occurrence of the behavior and the other recorded the nonoccurrence of the behavior) and multiplying the quotient by 100. For an ade- quate assessment of IOA, two independent data col- lectors are recommended to be present during at least one third of all observation sessions across all participants and phases of a clinical intervention or research study (Cooper et al., 2007). This level of IOA assessment (one third of sessions) is an arbi-
  • 70. trary number, and efforts to maximize the number of assessments that produce strong percentages of agreement should result in greater confidence in the data. Cooper et al. (2007) suggested that research studies maintain 90% or higher IOA but agreed that 80% or higher may be acceptable under some circumstances. Kazdin (2010) offered a different perspective on the acceptable level of IOA and sug- gested that the level of agreement that is acceptable is one that indicates to the researcher that the observers are sufficiently consistent in their recording of the behavior, that the behaviors are adequately defined, and that the measures will be sensitive to change in the client’s performance over time. (p. 118) Kazdin suggested that the number and complexity of behaviors being recorded, possible sources of bias, expected level of change in the behavior, and method of computing IOA are all considerations in deciding on an acceptable level of IOA. For example, if small changes in behavior are likely with the inter- vention, then higher IOA would be demanded. However, if larger changes are expected, then lower levels of IOA might be tolerated. The bottom line is that behavior analysts should strive for levels of IOA as high as possible (e.g., 90% or more) but consider the factors that might contribute to lower levels and make adjustments as warranted by these factors.
  • 71. IOA can be calculated in a variety of ways. How it is computed depends on the dimension of the behav- ior being evaluated and how it is measured. Next we describe common methods for calculating IOA. Frequency Recording To calculate IOA on frequency recording, the smaller frequency is divided by the larger frequency. For example, if one observer records 40 occurrences of a target behavior and a second independent observer records 35, the percentage of IOA during that observation session is 35/40, or 87.5%. The lim- itation of IOA in frequency recording is that there is no evidence that the two observers recorded the same behavioral event even when IOA is high. For example, if one observer recorded nine instances of the behavior and the other observer recorded 10 instances, the two observers ostensibly agreed on nine of the 10 instances for an IOA of 90%. It is pos- sible, however, that the observers were actually recording different instances of the behavior. One way to increase confidence that the two observers were agreeing on specific responses in frequency Co py ri gh t Am er ic
  • 73. Miltenberger and Weil 144 IOA is to collect frequency data in intervals and then compare the frequency in each interval (see Frequency Within Interval section later in this chapter). Dividing the observation period into shorter, equal intervals permits a closer look at the recording of frequencies in shorter time blocks. In this way, there can be more confidence that the observers recorded the same instances of the behav- ior when agreement is high. To further enhance confidence that observers are recording the same behavioral events, it is possible to collect data on behavior as it occurs in real time. With real-time recording, it is possible to determine whether there is exact agreement on each instance of the behavior. Real-Time Recording When using real-time recording, the onset and offset of the behavior are recorded on a second-by-second basis. Therefore, IOA can be calculated by dividing the number of seconds in which the two observers agreed that the behavior was or was not occurring by the number of seconds in the observation ses- sion. Typically, an agreement on the onset and offset of the behavior can be defined as occurring when both observers recorded the onset or offset at exactly the same second. This form of IOA is the most strin- gent because agreement is calculated for every sec- ond of the observation period (e.g., Rapp, Miltenberger, & Long, 1998; Rapp, Miltenberger,
  • 74. Long, et al., 1998). Alternatively, IOA could be con- ducted on the frequency of the behavior, but an agreement would only be scored when both observ- ers recorded the onset of the behavior at the same instant or within a small window of time (e.g., within 1 or 2 seconds of each other). Duration Recording IOA for duration recording is calculated by dividing the smaller duration by the larger duration. For example, if one observer records 90 minutes of break time taken in an 8-hour shift and the reliabil- ity observer records 85 minutes, the agreement between observers is 85/90, or 94.4%. The same lim- itation described earlier for IOA on frequency recording pertains to IOA on duration recording. Although the duration recorded by the two observ- ers may be similar, unless the data are time stamped, there is no evidence that the two observers were recording the same instances of the behavior. Real- time recording is a way to overcome this problem. Interval and Time-Sample Recording Computing IOA with interval data requires an interval- by-interval check for agreement on the occurrence and nonoccurrence of the behavior throughout the observation period. The number of intervals of agree- ment is then divided by the number of intervals in the observation period to produce a percentage of agree- ment. An agreement is defined as an interval in which both observers had a marked interval (indicating that the behavior occurred) or an unmarked interval (indi- cating that the behavior did not occur). Using only one target behavior for this example, consider a 10-minute observation session with data recorded at
  • 75. 10-second intervals (60 intervals total). If the number of intervals of observation with agreements is 56 of 60, the percentage of IOA is 56/60, or 93.3%. Two variations of IOA calculations for interval recording, which correct for chance agreement with low-rate and high-rate behavior, are occurrence- only and nonoccurrence-only calculations. The occurrence-only calculation is used with low-rate behavior (from which chance agreement on nonoc- currence is high) and involves calculating IOA using only agreements on occurrence and removing agree- ments on nonoccurrence from consideration (agree- ments on occurrence divided by agreements plus disagreements on occurrence). The nonoccurrence- only calculation is used with high-rate behavior (from which chance agreement on occurrence is high) and involves calculation of IOA using only agreements on nonoccurrence and removing agree- ments on occurrence from consideration (agree- ments on nonoccurrence divided by agreements plus disagreements on nonoccurrence). Cohen’s Kappa Kappa is another method of calculating observer agreement, but it corrects for the probability that two observers will agree as a result of chance alone. Kappa is computed using the following formula: − − P P P
  • 77. t fo r fu rt he r di st ri bu ti on . Observation and Measurement in Behavior Analysis 145 where Po is the proportion of agreement between observers (sum of agreements on occurrences and nonoccurrences divided by the total number of intervals) and Pc is the proportion of agreement expected by chance. The latter may be obtained using the following formula: P I
  • 78. c o o n n= 2 , where O1o is the number of occurrences recorded by Observer 1, O2o is the number of occurrences recorded by Observer 2; O1n and O2n are nonoccur- rence counts, and I is the number of observations made by each observer. For example if Observer 1 scored nine intervals out of 10 and Observer 2 scored eight intervals out of 10 (see Exhibit 6.1), kappa would be calculated as follows: Po = .90; PC = (72 + 2)/102 = .74, κ = .62. Kappa values can range from −1 to 1, with 0 reflecting a chance level of agreement. No single rule for interpreting an obtained kappa value may be given because the number of different categories into which behavior may be classified will affect kappa. If only two categories are used (e.g., occur- rence vs. nonoccurrence), then the probability of a chance agreement is higher than if more categories had been used. Higher probabilities of chance agree- ment are reflected in lower kappa values. Thus, if the preceding example had used three categories (e.g., slow-, medium-, or high-rate responding) and IOA had been the same (90%), then kappa would have been more than .62. Kappa can be affected by other factors, including the distribution of the ratings of the observers (Sim
  • 79. & Wright, 2005). Because these latter factors have little to do with the degree to which two observers agree, there is little agreement on what constitutes an acceptable kappa value. Within the social sci- ences, Kazdin (2010) suggested that a kappa value of 0.7 or higher reflects an acceptable level of agree- ment. Lower criteria for acceptable kappa values may be found (e.g., Fleiss, 1981; Landis & Koch, 1977), but these are as arbitrary as the cutoff sug- gested by Kazdin (von Eye & von Eye, 2008). Per- haps for this reason, kappa is less often used by applied behavior analysts than is IOA. Frequency Within Interval Calculating IOA for frequency within interval mini- mizes the limitation identified for IOA on frequency recording (high agreement even though the two observers might be recording different instances of behavior). For example, if agreement is calculated within each of a series of 20-second intervals, then there is no chance that a response recorded by Observer A in Interval 1 will be counted as an agree- ment with a different response recorded by Observer B in Interval 12. To calculate frequency-within-in- terval agreement, calculate a percentage of agree- ment between observers for each interval (smaller number divided by larger number), sum the per- centages for all the intervals, and divide by the num- ber of intervals in the observation period. Exhibit 6.2 illustrates an IOA calculation for frequency-within- interval data for 10 intervals for two observers. Each X corresponds to an occurrence of the behavior in an interval. Ethical Considerations Several ethical issues must be considered when con-
  • 80. ducting observations and measurement as part of research or clinical practice in applied behavior analysis (e.g., Bailey & Burch, 2005). First, a behav- ior analyst should observe and record the person’s behavior only after receiving written consent from the individual or the individual’s parent or guardian. As part of the consent process, the individual must be apprised of and agree to the ways in which the data will be used (research presentation or publication, Exhibit 6.1 Recordings for Observer 1 and Observer 2 in 10 Observation Intervals Interval 1 2 3 4 5 6 7 8 9 10 Observer 1 X X X X X X X X X Observer 2 X X X X X X X X Co py ri gh t Am er ic
  • 82. . Miltenberger and Weil 146 clinical decision making). If the behavior analyst identifies new uses for the data after the original consent has been obtained, new consent must be obtained from the individual for the new ways in which the data will be used. Second, the individual must know when and where observation will take place unless the individual provides written consent for surreptitious or unannounced observation. Third, observation and recording must take place in such a way that confidentiality is maintained for the individual receiving services or participating in research. To maintain confidentiality, the observer must not draw attention to the person being observed and must not inform any other people about the observations unless the individual being observed has provided written permission to do so. In addition, behavior analysts must use pseudonyms and disguise other identifying information in pre- sentations and publications. Fourth, observers must treat the individual being observed and others in the setting with dignity and respect at all times during the course of their participation in research or as they are receiving clinical services. SUMMARy Observation and measurement are at the heart of applied behavior analysis because behavior (and its
  • 83. controlling variables) is the subject matter of both research and practice. As discussed in this chapter, adequate measurement of behavior requires clear definitions of the target behavior, precise specifica- tions of recording logistics and procedures, appro- priate choice of recording devices, and consideration of reactivity and IOA. The validity of conclusions that can be drawn from experimental manipulations of controlling variables or evaluations of treatment effectiveness depends on the adequacy of the obser- vation and measurement of the behaviors targeted in these endeavors. References Aikman, G., & Garbutt, V. (2003). Brief probes: A method for analyzing the function of disruptive behaviour in the natural environment. Behavioural and Cognitive Psychotherapy, 31, 215–220. doi:10.1017/S1352465 803002108 Allen, K. D. (1998). The use of an enhanced simpli- fied habit reversal procedure to reduce disruptive outbursts during athletic performance. Journal of Applied Behavior Analysis, 31, 489–492. doi:10.1901/ jaba.1998.31-489 Athens, E. S., Vollmer, T. R., & St. Peter Pipkin, C. C. (2007). Shaping academic task engagement with percentile schedules. Journal of Applied Behavior Analysis, 40, 475–488. doi:10.1901/jaba.2007.40-475 Baer, D. M., Wolf, M. M., & Risley, T. R. (1968). Some current dimensions of applied behavior analysis. Journal of Applied Behavior Analysis, 1, 91–97.
  • 84. doi:10.1901/jaba.1968.1-91 Bailey, J. S., & Burch, M. R. (2002). Research methods in applied behavior analysis. Thousand Oaks, CA: Sage. Exhibit 6.2 Frequency-Within-Interval Recordings for Two Observers and Interobserver Agreement Calculation Interval 1 2 3 4 5 6 7 8 9 10 Observer 1 XXX X XX XX X XXX XX 67% 100% 100% 100% 100% 100% 50% 100% 50% 100% Observer 2 XX X XX XX XX XXX X Note. Interobserver agreement = (67 + 100 + 100 + 100 + 100 + 100 + 50 + 100 + 50 + 100)/10 = 86.7%. Co py ri gh t Am er
  • 86. on . Observation and Measurement in Behavior Analysis 147 Bailey, J. S., & Burch, M. R. (2005). Ethics for behavior analysts. Mahwah, NJ: Erlbaum. Beck, K. V., & Miltenberger, R. G. (2009). Evaluation of a commercially available program and in situ train- ing by parents to teach abduction-prevention skills to children. Journal of Applied Behavior Analysis, 42, 761–772. doi:10.1901/jaba.2009.42-761 Borrero, C. S. W., & Borrero, J. C. (2008). Descriptive and experimental analyses of potential precursors to problem behavior. Journal of Applied Behavior Analysis, 41, 83–96. doi:10.1901/jaba.2008.41-83 Bosch, A., Miltenberger, R. G., Gross, A., Knudson, P., & Brower-Breitweiser, C. (2008). Evaluation of extinction as a functional treatment for binge eating. Behavior Modification, 32, 556–576. doi:10.1177/ 0145445507313271 Boyce, T. E., & Geller, E. S. (2001). A technology to mea- sure multiple driving behaviors without self-report or participant reactivity. Journal of Applied Behavior Analysis, 34, 39–55. doi:10.1901/jaba.2001.34-39 Brackett, L., Reid, D. H., & Green, C. W. (2007). Effects of reactivity to observations on staff performance.
  • 87. Journal of Applied Behavior Analysis, 40, 191–195. doi:10.1901/jaba.2007.112-05 Brown, R. A., Palm, K. M., Strong, D., Lejuez, C., Kahler, C., Zvolensky, M., . . . Gifford, E. (2008). Distress tolerance treatment for early-lapse smok- ers: Rationale, program description, and prelimi- nary findings. Behavior Modification, 32, 302–332. doi:10.1177/0145445507309024 Codding, R. S., Livanis, A., Pace, G. M., & Vaca, L. (2008). Using performance feedback to improve treatment integrity of classwide behavior plans: An investigation of observer reactivity. Journal of Applied Behavior Analysis, 41, 417–422. doi:10.1901/ jaba.2008.41-417 Connell, J. E., & Witt, J. C. (2004). Applications of computer-based instruction: Using specialized soft- ware to aid letter-name and letter-sound recogni- tion. Journal of Applied Behavior Analysis, 37, 67–71. doi:10.1901/jaba.2004.37-67 Cooper, J. O., Heron, T. E., & Heward, W. L. (2007). Applied behavior analysis (2nd ed.). Upper Saddle River, NJ: Pearson Education. Daniels, A. C., & Daniels, J. E. (2004). Performance man- agement: Changing behavior that drives organizational effectiveness. Atlanta, GA: Performance Management. DiGennaro, F. D., Martens, B. K., & Kleinmann, A. E. (2007). A comparison of performance feedback procedures on teachers’ treatment implementation integrity and students’ inappropriate behavior in spe- cial education classrooms. Journal of Applied Behavior
  • 88. Analysis, 40, 447–461. doi:10.1901/jaba.2007.40-447 DiGennaro, F. D., Martens, B. K., & McIntyre, L. L. (2005). Increasing treatment integrity through negative reinforcement: Effects on teacher and stu- dent behavior. School Psychology Review, 34, 220–231. DiGennaro-Reed, F. D., Codding, R., Catania, C. N., & Maguire, H. (2010). Effects of video modeling on treatment integrity of behavioral interventions. Journal of Applied Behavior Analysis, 43, 291–295. doi:10.1901/jaba.2010.43-291 Donaldson, J. M., & Normand, M. P. (2009). Using goals setting, self-monitoring, and feedback to increase calorie expenditure in obese adults. Behavioral Interventions, 24, 73–83. doi:10.1002/bin.277 Fleiss, J. L. (1981). Statistical methods for rates and pro- portions (2nd ed.). New York, NY: Wiley. Flessner, C. A., Miltenberger, R. G., Egemo, K., Jostad, C., Gatheridge, B. J., Neighbors, C., . . . Kelso, P. (2005). An evaluation of the social support component of simplified habit reversal. Behavior Therapy, 36, 35–42. doi:10.1016/S0005-7894(05)80052-8 Fogel, V. A., Miltenberger, R. G., Graves, R., & Koehler, S. (2010). Evaluating the effects of exergaming on physical activity among inactive children in a physi- cal education classroom. Journal of Applied Behavior Analysis, 43, 591–600. doi:10.1901/jaba.2010.43-591 Gatheridge, B. J., Miltenberger, R., Huneke, D. F., Satterlund, M. J., Mattern, A. R., Johnson, B. M., &
  • 89. Flessner, C. A. (2004). A comparison of two pro- grams to teach firearm injury prevention skills to 6- and 7-year-old children. Pediatrics, 114, e294–e299. doi:10.1542/peds.2003-0635-L Gravlee, C. C., Zenk, S. N., Woods, S., Rowe, Z., & Schulz, A. J. (2006). Handheld computers for direct observation of the social and physical environment. Field Methods, 18, 382–397. doi:10.1177/1525822X 06293067 Gresham, F. M., Gansle, K. A., & Noell, G. H. (1993). Treatment integrity in applied behavior analysis with children. Journal of Applied Behavior Analysis, 26, 257–263. doi:10.1901/jaba.1993.26-257 Harris, F. C., & Ciminero, A. R. (1978). The effects of witnessing consequences on the behavioral recording of experimental observers. Journal of Applied Behavior Analysis, 11, 513–521. doi:10.1901/jaba.1978.11-513 Hayes, S. C., Barlow, D. H., & Nelson-Gray, R. O. (1999). The scientist practitioner: Research and accountabil- ity in the age of managed care. Boston, MA: Allyn & Bacon. Hayes, S. C., Wilson, K. G., Gifford, E., Bissett, R., Piasecki, M., Batten, S., . . . Gregg, J. (2004). A preliminary trial of twelve-step facilitation and acceptance and commit- ment therapy with polysubstance-abusing methadone- maintained opiate addicts. Behavior Therapy, 35, 667–688. doi:10.1016/S0005-7894(04)80014-5 Himle, M. B., Miltenberger, R. G., Flessner, C., & Gatheridge, B. (2004). Teaching safety skills to children to prevent
  • 91. he r di st ri bu ti on . Miltenberger and Weil 148 gun play. Journal of Applied Behavior Analysis, 37, 1–9. doi:10.1901/jaba.2004.37-1 Himle, M. B., Miltenberger, R. G., Gatheridge, B., & Flessner, C. (2004). An evaluation of two procedures for training skills to prevent gun play in children. Pediatrics, 113, 70–77. doi:10.1542/peds.113.1.70 Iwata, B. A., Pace, G. M., Kissel, R. C., Nau, P. A., & Farber, J. M. (1990). The Self-Injury Trauma (SIT) scale: A method for quantifying surface tissue dam- age caused by self-injurious behavior. Journal of Applied Behavior Analysis, 23, 99–110. doi:10.1901/ jaba.1990.23-99 Jackson, J., & Dixon, M. R. (2007). A mobile computing
  • 92. solution for collecting functional analysis data on a pocket PC. Journal of Applied Behavior Analysis, 40, 359–384. doi:10.1901/jaba.2007.46-06 Jessup, P. A., & Stahelski, A. J. (1999). The effects of a combined goal setting, feedback and incentive intervention on job performance in a manufactur- ing environment. Journal of Organizational Behavior Management, 19, 5–26. doi:10.1300/J075v19n03_02 Johnston, J. M., & Pennypacker, H. S. (1993). Readings for strategies and tactics of behavioral research (2nd ed.). Hillsdale, NJ: Erlbaum. Kahng, S. W., & Iwata, B. A. (1998). Computerized systems for collecting real-time observational data. Journal of Applied Behavior Analysis, 31, 253–261. doi:10.1901/jaba.1998.31-253 Kazdin, A. E. (1977). Artifact, bias, and complexity of assessment: The ABCs of reliability. Journal of Applied Behavior Analysis, 10, 141–150. doi:10.1901/ jaba.1977.10-141 Kazdin, A. E. (2010). Single case research designs: Methods for clinical and applied settings (2nd ed.). New York, NY: Oxford University Press. Kerwin, M. L., Ahearn, W. H., Eicher, P. S., & Swearingin, W. (1998). The relationship between food refusal and self-injurious behavior: A case study. Journal of Behavior Therapy and Experimental Psychiatry, 29, 67–77. doi:10.1016/S0005-7916(97)00040-2 Landis, J. R., & Koch, G. G. (1977). The measurement of observer agreement for categorical data. Biometrics,
  • 93. 33, 159–174. doi:10.2307/2529310 Lerman, D. C., Iwata, B. A., Smith, R. G., & Vollmer, T. R. (1994). Restraint fading and the development of alter- native behaviour in the treatment of self-restraint and self-injury. Journal of Intellectual Disability Research, 38, 135–148. doi:10.1111/j.1365-2788.1994.tb00369.x Lindsley, O. R. (1968). Technical note: A reliable wrist counter for recording behavior rates. Journal of Applied Behavior Analysis, 1, 77–78. doi:10.1901/ jaba.1968.1-77 Long, E. S., Miltenberger, R. G., Ellingson, S. A., & Ott, S. M. (1999). Augmenting simplified habit reversal in the treatment of oral-digit habits exhibited by individuals with mental retardation. Journal of Applied Behavior Analysis, 32, 353–365. doi:10.1901/ jaba.1999.32-353 MacDonald, R., Sacramone, S., Mansfield, R., Wiltz, K., & Ahern, W. (2009). Using video modeling to teach reciprocal pretend play to children with autism. Journal of Applied Behavior Analysis, 42, 43–55. doi:10.1901/jaba.2009.42-43 Mace, F. C., Prager, K. L., Thomas, K., Kochy, J., Dyer, T. J., Perry, L., & Pritchard, D. (2009). Effects of stimulant medication under varied motivational operations. Journal of Applied Behavior Analysis, 42, 177–183. doi:10.1901/jaba.2009.42-177 Maglieri, K. A., DeLeon, I. G., Rodriguez-Catter, V. R., & Sevin, B. M. (2000). Treatment of covert food steal- ing in an individual with Prader-Willi syndrome.
  • 94. Journal of Applied Behavior Analysis, 33, 615–618. doi:10.1901/jaba.2000.33-615 Maher, E. (2009). Behavior Tracker Pro. Retrieved from http://www.behaviortrackerpro.com/btp/Welcome. html Malott, R., & Trojan-Suarez, E. A. (2004). Elementary principles of behavior (5th ed.). Upper Saddle River, NJ: Prentice Hall. Marckel, J. M., Neef, N. A., & Ferreri, S. J. (2006). A pre- liminary analysis of teaching improvisation with the picture exchange communication system to children with autism. Journal of Applied Behavior Analysis, 39, 109–115. doi:10.1901/jaba.2006.131-04 Mash, E. J., & McElwee, J. (1974). Situational effects on observer accuracy: Behavioral predictability, prior experience, and complexity of coding categories. Child Development, 45, 367–377. doi:10.2307/1127957 Mayfield, K. H., & Vollmer, T. R. (2007). Teaching math skills to at-risk students using home-based peer tutoring. Journal of Applied Behavior Analysis, 40, 223–237. doi:10.1901/jaba.2007.108-05 Meidinger, A. L., Miltenberger, R. G., Himle, M., Omvig, M., Trainor, C., & Crosby, R. (2005). An investiga- tion of tic suppression and the rebound effect in Tourette’s disorder. Behavior Modification, 29, 716–745. doi:10.1177/0145445505279262 Miltenberger, R. G. (2012). Behavior modification: Principles and procedures (5th ed.). Belmont, CA: Wadsworth.
  • 95. Miltenberger, R., Rapp, J., & Long, E. (1999). A low tech method for conducting real time recording. Journal of Applied Behavior Analysis, 32, 119–120. doi:10.1901/ jaba.1999.32-119 Miltenberger, R. G., Woods, D. W., & Himle, M. (2007). Tic disorders and trichotillomania. In P. Sturmey (Ed.), Handbook of functional analysis and clinical psychology (pp. 151–170). Burlington, MA: Elsevier. Co py ri gh t Am er ic an P sy ch ol og ic al A ss oc ia
  • 96. ti on . No t fo r fu rt he r di st ri bu ti on . Observation and Measurement in Behavior Analysis 149 Miltenberger, R. G., Wright, K. M., & Fuqua, R. W. (1986). Graduated in vivo exposure with a severe spider phobic. Scandinavian Journal of Behaviour Therapy, 15, 71–76. doi:10.1080/16506078609455763 Mowery, J., Miltenberger, R., & Weil, T. (2010).
  • 97. Evaluating the effects of reactivity to supervisor presence on staff response to tactile prompts and self-monitoring in a group home setting. Behavioral Interventions, 25, 21–35. Mozingo, D. B., Smith, T., Riordan, M. R., Reiss, M. L., & Bailey, J. S. (2006). Enhancing frequency record- ing by developmental disabilities treatment staff. Journal of Applied Behavior Analysis, 39, 253–256. doi:10.1901/jaba.2006.55-05 Parsons, H. M. (1974). What happened at Hawthorne? Science, 183, 922–932. doi:10.1126/science.183. 4128.922 Patel, M. R., Piazza, C. C., Layer, S. A., Coleman, R., & Swartzwelder, D. M. (2005). A systematic evaluation of food textures to decrease packing and increase oral intake in children with pediatric feeding dis- orders. Journal of Applied Behavior Analysis, 38, 89–100. doi:10.1901/jaba.2005.161-02 Pedhazur, E., & Schmelkin, L. (1991). Measurement, design, and analysis: An integrated approach. Hillsdale, NJ: Erlbaum. Peterson, L., Homer, A. L., & Wonderlich, S. A. (1982). The integrity of independent variables in behavior analysis. Journal of Applied Behavior Analysis, 15, 477–492. doi:10.1901/jaba.1982.15-477 Plavnick, J. B., Ferreri, S. J., & Maupin, A. N. (2010). The effects of self-monitoring on the procedural integrity of behavioral intervention for young chil- dren with developmental disabilities. Journal of Applied Behavior Analysis, 43, 315–320. doi:10.1901/