Strategize a Smooth Tenant-to-tenant Migration and Copilot Takeoff
Macro 6 voice07
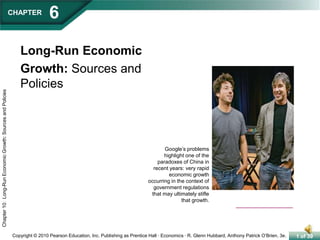
1. 6 CHAPTER Long-Run Economic Growth: Sources and Policies Google’s problems highlight one of the paradoxes of China in recent years: very rapid economic growth occurring in the context of government regulations that may ultimately stifle that growth.
2. Economic Growth over Time and around the World 10.1 LEARNING OBJECTIVE Define economic growth, calculate economic growth rates, and describe global trends in economic growth. Economic Growth from 1,000,000 B.C. to the Present Industrial Revolution The application of mechanical power to the production of goods, beginning in England around 1750.
3. 10.1 LEARNING OBJECTIVE MakingtheConnection YOUR TURN:Test your understanding by doing related problem 1.3 at the end of this chapter. Define economic growth, calculate economic growth rates, and describe global trends in economic growth. Why Did the IndustrialRevolution Begin in England? Most economists accept the idea that economic growth is not likely to occur unless a country’s government provides the necessary type of institutional framework. The British government’s guarantee of property rights set the stage for the Industrial Revolution.
4. Economic Growth over Time and around the World 10.1 LEARNING OBJECTIVE Define economic growth, calculate economic growth rates, and describe global trends in economic growth. Economic Growth from 1,000,000 B.C. to the Present FIGURE 10-1 Average Annual Growth Rates for the World Economy World economic growth was essentially zero in the years before 1300, and it was very slow—an average of only 0.2 percent per year—before 1800. The Industrial Revolution made possible the sustained increases in real GDP per capita that have allowed some countries to attain high standards of living.
5. Economic Growth over Time and around the World 10.1 LEARNING OBJECTIVE YOUR TURN:Test your understanding by doing related problem 1.6 at the end of this chapter. Define economic growth, calculate economic growth rates, and describe global trends in economic growth. Small Differences in Growth Rates Are Important In the long run, small differences in economic growth rates result in big differences in living standards. Why Do Growth Rates Matter? Growth rates matter because an economy that grows too slowly fails to raise living standards. Don’t Let This Happen to YOU!Don’t Confuse the Average Annual Percentage Change with the Total Percentage Change
6. 10.1 LEARNING OBJECTIVE MakingtheConnection YOUR TURN:Test your understanding by doing related problem 1.7 at the end of this chapter. Define economic growth, calculate economic growth rates, and describe global trends in economic growth. The Benefits of an EarlierStart: Standards of Livingin China and Japan Although China has experienced rapid economic growth, its living standards are still well below those of Japan.
7. Economic Growth over Time and around the World 10.1 LEARNING OBJECTIVE Define economic growth, calculate economic growth rates, and describe global trends in economic growth. “The Rich Get Richer and . . . ” FIGURE 10-2 GDP per Capita, 2008 GDP per capita is measured in U.S. dollars, corrected for differences across countries in the cost of living.
8. What Determines How Fast Economies Grow? 10.2 LEARNING OBJECTIVE Use the economic growth model to explain why growth rates differ across countries. Economic growthmodel A model that explains growth rates in real GDP per capita over the long run. Labor productivity The quantity of goods and services that can be produced by one worker or by one hour of work. Technological change A change in the quantity of output a firm can produce using a given quantity of inputs.
9. What Determines How Fast Economies Grow? 10.2 LEARNING OBJECTIVE Use the economic growth model to explain why growth rates differ across countries. There are three main sources of technological change: • Better machinery and equipment. • Increases in human capital. Human capital The accumulated knowledge and skills that workers acquire from education and training or from their life experiences. • Better means of organizing and managing production.
10. What Determines How Fast Economies Grow? 10.2 LEARNING OBJECTIVE Use the economic growth model to explain why growth rates differ across countries. The Per-Worker Production Function Per-worker production function The relationship between real GDP per hour worked and capital per hour worked, holding the level of technology constant.
11. What Determines How Fast Economies Grow? 10.2 LEARNING OBJECTIVE Use the economic growth model to explain why growth rates differ across countries. The Per-Worker Production Function FIGURE 10-3 The Per-Worker Production Function The per-worker production function shows the relationship between capital per hour worked and real GDP per hour worked, holding technology constant. Increases in capital per hour worked increase output per hour worked but at a diminishing rate. For example, an increase in capital per hour worked from $20,000 to $30,000 increases real GDP per hour worked from $200 to $350. An increase in capital per hour worked from $30,000 to $40,000 increases real GDP per hour worked only from $350 to $475. Each additional $10,000 increase in capital per hour worked results in a progressively smaller increase in output per hour worked.
12. What Determines How Fast Economies Grow? 10.2 LEARNING OBJECTIVE Use the economic growth model to explain why growth rates differ across countries. Which Is More Important for Economic Growth: More Capital or Technological Change? Technological change helps economies avoid diminishing returns to capital.
13. What Determines How Fast Economies Grow? 10.2 LEARNING OBJECTIVE Use the economic growth model to explain why growth rates differ across countries. Technological Change: The Key to Sustaining Economic Growth FIGURE 10-4 Technological Change Increases Output per Hour Worked Technological change shifts up the production function and allows more output per hour worked with the same amount of capital per hour worked. For example, along Production function1 with $50,000 in capital per hour worked, the economy can produce $575 in real GDP per hour worked. However, an increase in technology that shifts the economy to Production function2 makes it possible to produce $675 in real GDP per hour worked with the same level of capital per hour worked.
14. 10.2 LEARNING OBJECTIVE MakingtheConnection YOUR TURN:Test your understanding by doing related problem 2.10 at the end of this chapter. Use the economic growth model to explain why growth rates differ across countries. What Explains the Economic Failure of the Soviet Union? A centrally planned economy, such as the Soviet Union’s, could not, over the long run, grow faster than a market economy. The Soviet Union collapsed in 1991, and contemporary Russia now has a more market-oriented system, although the government continues to play a much larger role in the economy than does the government in the United States. The fall of the Berlin Wall in 1989 symbolized the failure of Communism.
15. 10.2 LEARNING OBJECTIVE 10-2 Solved Problem Use the economic growth model to explain why growth rates differ across countries. Using the Economic Growth Model to Analyze the Failure of the Soviet Union’s Economy YOUR TURN:For more practice, do related problems 2.7 and 2.8 at the end of this chapter.
16. What Determines How Fast Economies Grow? 10.2 LEARNING OBJECTIVE Use the economic growth model to explain why growth rates differ across countries. New Growth Theory New growth theory A model of long-run economic growth that emphasizes that technological change is influenced by economic incentives and so is determined by the working of the market system.
17. What Determines How Fast Economies Grow? 10.2 LEARNING OBJECTIVE Use the economic growth model to explain why growth rates differ across countries. New Growth Theory Government policy can help increase the accumulation of knowledge capital in three ways: • Protecting intellectual property with patents and copyrights. Patent The exclusive right to produce a product for a period of 20 years from the date the product is invented. • Subsidizing research and development. • Subsidizing education.
18. What Determines How Fast Economies Grow? 10.2 LEARNING OBJECTIVE Use the economic growth model to explain why growth rates differ across countries. Joseph Schumpeter and Creative Destruction Schumpeter developed a model of growth that emphasized his view that new products unleash a “gale of creative destruction” that drives older products—and, often, the firms that produced them—out of the market.
19. Economic Growth in the United States 10.3 LEARNING OBJECTIVE Discuss fluctuations in productivity growth in the United States. Economic Growth in the United States since 1950 FIGURE 10-5 Average Annual Growth Rates in Real GDP per Hour Worked in the United States The growth rate in the United States increased from 1800 through the mid-1970s. Then, for more than 20 years, growth slowed before increasing again in the mid-1990s.
20. Economic Growth in the United States 10.3 LEARNING OBJECTIVE Discuss fluctuations in productivity growth in the United States. Economic Growth in the United States since 1950 What Caused the Productivity Slowdown of 1973–1994? • Measurement problems • High oil prices • Deterioration in the U.S. educational system Has the “New Economy” Increased Productivity? Productivity growth in the United States increased between 1995 and 2008 compared to the previous 20-year period. Some economists argue that the development of a “new economy” based on information technology caused the higher productivity growth that began in the mid-1990s.
21. Economic Growth in the United States 10.3 LEARNING OBJECTIVE Discuss fluctuations in productivity growth in the United States. Productivity Growth in theHigh-Income Economies, 1995-2008 FIGURE 10-6 Productivity Growth in the Leading Industrial Economies, 1996–2008 Productivity growth as measured by the average annual growth rate of labor productivity was more rapid in the United States than in the other high-income countries during the years between 1995 and 2008.
22. Why Isn’t the Whole World Rich? 10.4 LEARNING OBJECTIVE Explain economic catch-up and discuss why many poor countries have not experienced rapid economic growth. Catch-up The prediction that the level of GDP per capita (or income per capita) in poor countries will grow faster than in rich countries.
23. Why Isn’t the Whole World Rich? 10.4 LEARNING OBJECTIVE Explain economic catch-up and discuss why many poor countries have not experienced rapid economic growth. Catch-up: Sometimes, but Not Always FIGURE 10-7 The Catch-up Predicted by the Economic Growth Model According to the economic growth model, countries that start with lower levels of real GDP per capita should grow faster (points near the top of the line) than countries that start with higher levels of real GDP per capita (points near the bottom of the line).
24. Why Isn’t the Whole World Rich? 10.4 LEARNING OBJECTIVE Explain economic catch-up and discuss why many poor countries have not experienced rapid economic growth. Catch-up: Sometimes, but Not Always Catch-up among High-Income Countries FIGURE 10-8 There Has Been Catch-up among High-income Countries Looking only at countries that currently have high incomes, countries such as Ireland and Japan that had the lowest incomes in 1960 grew the fastest between 1960 and 2008.Countries such as Switzerland and the United States that had the highest incomes in 1960 grew the slowest.
25. Why Isn’t the Whole World Rich? 10.4 LEARNING OBJECTIVE Explain economic catch-up and discuss why many poor countries have not experienced rapid economic growth. Catch-up: Sometimes, but Not Always Are the Developing Countries Catching Up to theHigh-income Countries? FIGURE 10-9 Most of the World Hasn’t Been Catching Up Looking at all countries for which statistics are available does not show the catch-up predicted by the economic growth model. Some countries that had low levels of real GDP per capita in 1960, such as Niger, Madagascar, and the Democratic Republic of the Congo, actually experienced negative economic growth. Other countries that started with low levels of real GDP per capita, such as Malaysia and South Korea, grew rapidly. Some middle-income countries in 1960, such as Venezuela, hardly grew between 1960 and 2008, while others, such as Israel, experienced significant growth.
26. 10.4 LEARNING OBJECTIVE 10-4 Solved Problem YOUR TURN:For more practice, do related problems 4.4 and 4.5 at the end of this chapter. Explain economic catch-up and discuss why many poor countries have not experienced rapid economic growth. The Economic Growth Model’s Prediction of Catch-up
27. Why Isn’t the Whole World Rich? 10.4 LEARNING OBJECTIVE Explain economic catch-up and discuss why many poor countries have not experienced rapid economic growth. Why Don’t More Low-Income Countries Experience Rapid Growth? Failure to Enforce the Rule of Law Property rights The rights individuals or firms have to the exclusive use of their property, including the right to buy or sell it. Rule of law The ability of a government to enforce the laws of the country, particularly with respect to protecting private property and enforcing contracts.
28. Why Isn’t the Whole World Rich? 10.4 LEARNING OBJECTIVE Explain economic catch-up and discuss why many poor countries have not experienced rapid economic growth. Why Don’t More Low-Income Countries Experience Rapid Growth? Wars and Revolutions Wars have made it impossible for countries such as Afghanistan, Angola, Ethiopia, the Central African Republic and the Congo to accumulate capital or adopt new technologies.
29. Why Isn’t the Whole World Rich? 10.4 LEARNING OBJECTIVE Explain economic catch-up and discuss why many poor countries have not experienced rapid economic growth. Why Don’t More Low-Income Countries Experience Rapid Growth? Poor Public Education and Health Many low-income countries have weak public school systems, so many workers are unable to read and write. People who are sick work less and are less productive when they do work. Low Rates of Saving and Investment The low savings rates in developing countries can contribute to a vicious cycle of poverty.
30. 10.4 LEARNING OBJECTIVE MakingtheConnection YOUR TURN:Test your understanding by doing related problem 4.7 at the end of this chapter. Explain economic catch-up and discuss why many poor countries have not experienced rapid economic growth. What Do Parking Tickets in New York City Have to Do WithPoverty in the Developing World?
31. Why Isn’t the Whole World Rich? 10.4 LEARNING OBJECTIVE Explain economic catch-up and discuss why many poor countries have not experienced rapid economic growth. The Benefits of Globalization Foreign direct investment (FDI)The purchase or building by a corporation of a facility in a foreign country. Foreign portfolio investmentThe purchase by an individual or a firm of stock or bonds issued in another country. Globalization The process of countries becoming more open to foreign trade and investment.
32. Why Isn’t the Whole World Rich? 10.4 LEARNING OBJECTIVE Explain economic catch-up and discuss why many poor countries have not experienced rapid economic growth. The Benefits of Globalization FIGURE 10-10 Globalization and Growth Developing countries that were more open to foreign trade and investment grew much faster during the 1990s than developing countries that were less open.
37. AN INSIDE LOOK >> Investment Spurs China’s Growth China Officials: Long Live Investment Continuous increases in capital per hour worked lead to smaller and smaller increases in output per hour worked.
38. KEY TERMS Catch-up Economic growth model Foreign direct investment (FDI) Foreign portfolio investment Globalization Human capital Industrial Revolution Labor productivity New growth theory Patent Per-worker production function Property rights Rule of law Technological change