2. 764 R.A. TIETZ AND R.W. HARTEL
The different milk-fat fractions were categorized as very Scientific, Pittsburgh, PA) containing a 7 × 2 mm magnetic
high-melting (VHM), high-melting (HM), middle-melting 2 stir bar. The samples were then cooled to 25°C to obtain rep-
(MM2), middle-melting 1 (MM1), and low-melting (LM), resentative rates of CB crystallization. Absorbance readings
with clear points of 47.4, 42.2, 28.4, 24.4, and 18.5°C, respec- were taken automatically every 30 s until a maximum ab-
tively. sorbance was reached. A crystallization rate was determined
Ivory Coast cocoa butter and a low-fat, semisweet, dark by the slope of the line fitted to the initial linear increasing
chocolate base (28.1% fat) were supplied by Guittard Choco- region of the absorbance vs. time curve using least square lin-
late Co. (Burlingame, CA). ear regression. The point where the fitted line intercepted the
Separation of ML. ML (i.e., DAG, MAG, cholesterol, and x-axis was determined as the crystallization induction time.
phospholipids) were separated from TAG in the different This induction time represents the point at which massive
milk-fat fractions and cocoa butter by using column chroma- crystallization occurs, whereas the crystallization rate (initial
tography according to a modified method of Carroll (18). A slope of absorbance) provides a measure of how rapidly the
custom-made glass was filled with 60 g of 60–100 mesh crystal phase develops under these conditions. Neither param-
Florisil® (Fisher Scientific, Pittsburgh, PA). After the milk fat eter provides a fundamental measure of nucleation or growth
was embedded in the packing material, the following lipid rate, but only provides an easily measured parameter for com-
components were separated through the column using the fol- parison of crystallization kinetics.
lowing solvent profile: 1 L of hexane (hydrocarbons), 2.4 L Microstructure analysis. Images of the crystalline mi-
of 2.5% ether in hexane (cholesterol esters), 3 L of 15% ether crostructure of CB and 10% milk fat–CB blends with varying
in hexane (TAG), 3 L of 25% ether in hexane (cholesterol), 3 levels of ML were taken using a Bio-Rad MRC-600 Confo-
L of 50% ether in hexane (DAG), 3 L of 2% methanol in ether cal Laser Scanning Microscope (CLSM) (Integrated Mi-
(MAG), and finally 3 L of 4% acetic acid in ether (free fatty croscopy Resources, University of Wisconsin, Madison, WI).
acids and remaining lipids). The TAG fractions were col- CLSM allowed for a detailed image of the effect of ML on
lected and kept separate. The ML components were pooled, microstructure, and gave better images than a polarized light
leaving a fraction of TAG and a fraction of non-TAG compo- microscope. Images were enhanced using a combination of
nents for each milk fat fluorescent dyes of Nile red and Nile blue at levels of 0.5 and
High-performance liquid chromatography (HPLC) and gas 100 mg, respectively, per 500 g of fat. These dyes were cho-
chromatography (GC) were used to characterize the purity sen based on previous work (16). It was verified in prelimi-
and composition of the component fats, the purified TAG, and nary crystallization experiments (data not shown) that this
the ML obtained from each fat. Quantification of the neutral dye combination at these levels did not have a significant ef-
lipid composition in CB, anhydrous milk fat (AMF), and fect on crystallization kinetics of the milk fat–CB system.
milk-fat fractions was done by using HPLC based on a modi- Samples were prepared by dissolving the dye in the fat at
fied technique of Liu et al. (19). Fatty acid profiles of the CB, 60°C for 16 h. A 1.3-g sample was then crystallized using a
AMF, milk-fat fractions, and the pooled ML for each fat were Spectronic® Genesys™ 5 Spectrophotometer with a thermo-
analyzed by GC according to a modified method of Iverson electric cuvette holder and internal agitator. A temperature of
and Sheppard (20). Acyl carbon number profiles of all com- 25°C and an agitation of 250 rpm were used when crystalliz-
ponent fats and their ML were analyzed by GC according to ing samples. Blends of WAMF and VHM with cocoa butter
a modified method of Lund (21). Further details can be found were left to crystallize for 1 h and 30 min, before placing sev-
in Tietz (22). eral drops of the fat slurry on a microscope slide. Samples
Fat crystallization. To study the impact of ML from the were cooled to 10°C and held for 16 h before taking images,
different milk-fat fractions and to look at the impact of differ- to ensure a fully crystalline sample.
ent levels of ML on CB crystallization, blends of 10% milk X-ray diffraction. To examine the effect of ML from milk
fat–CB were made with varying levels of ML collected from fat on the polymorphic change of CB, a STOE Powder X-Ray
their respective milk-fat fraction. The levels of ML used in Diffractometer (STOE and CIE GmbH, Darmstadt, Germany)
these experiments were no ML, natural levels of ML (ca. was used. Fat (ca. 0.75 g) was weighed in Teflon discs
2.5%), and twice the natural level of ML (ca. 5%). For each (Siemens Industrial Automation, Inc., Madison, WI). Blends
fat, the ML removed in the column were added back to the of 10% milk fat–CB with varying levels of ML were tem-
native fat to give twice the level of ML for that fat. pered according to IUPAC Method 2.150 (23). The diffrac-
Induction time and crystallization rate of these milk tion intensity was measured between angles of 5 and 32° (2θ),
fat–CB blends were determined based on turbidity changes, with a count time of 2 s and a step width of 0.05° per count.
using a Spectronic® Genesys™ 5 Spectrophotometer (Spec- Samples were stored in a temperature cycling chamber (19
tronic Instruments, Rochester, NY) with a thermoelectric cu- and 29°C at intervals of 6 h) with x-ray readings taken every
vette holder and internal agitator (250 rpm). A wavelength of 2 d to determine the polymorphic change from Form V to
490 nm was used to document changes in turbidity due to Form VI. These spectra were compared to standard x-ray
crystallization. spectra of increasing levels of Form VI polymorph to estimate
Samples were melted at 60°C with 1.3 g of fat weighed out the ratio of Form VI to Form V by the method of Bricknell
in a Fisherbrand™ rectangular optical glass cuvette (Fisher and Hartel (3).
JAOCS, Vol. 77, no. 7 (2000)
3. EFFECTS OF MINOR LIPIDS ON COCOA BUTTER AND CHOCOLATE 765
Chocolate preparation. Chocolate samples (500 g) were The point where this fitted line intercepted the x-axis was de-
made by adding the appropriate levels of milk fat or milk-fat termined as the bloom induction time.
fractions and CB to the low-fat chocolate base to make a
chocolate with 33% fat and 10% milk fat (on a fat basis).
RESULTS AND DISCUSSION
Three levels of ML were studied (no ML, natural levels, and
twice the natural level) as discussed previously. The choco- Chemical analyses. The composition of TAG and ML in each
lates were prepared and tempered in a 1-L jacketed temper- component fat is seen in Table 1. ML content varied from
ing beaker (Cole Parmer, Chicago, IL) with a Master Servo- 3.2% for the cocoa butter to 2.0% for WAMF. The different
dyne motor head and controller (Cole Parmer) to maintain milk-fat fractions contained different levels and types of ML
constant rpm and to monitor viscosity. A modified method of based on separation during fractionation. However, no trends
Kleinert (24) was used to temper the chocolate. The choco- in separation could be detected from the results in Table 1,
late was melted at 60°C for 30 min at a mixing speed of 80 since the fatty acid composition of each compound also influ-
rpm. It was then cooled to 26°C until a constant viscosity was ences its partition coefficient during fractionation.
reached (ca. 1.5 h). After this, the chocolate was heated to The fatty acid profiles of the component fats, the purified
32.8°C until a constant viscosity was reached. It was cooled TAG of each fat, and the ML separated from each fat are
again to 29°C and held until viscosity reached a constant shown in Tables 2–4, respectively. The fatty acid distributions
level. Finally, it was heated to 32.3°C, where it was held until of CB, milk fat, and milk-fat fractions (Table 2) were consis-
a constant viscosity was reached. About 12.5 g of tempered tent with previous studies. Long-chain saturated fatty acids
chocolate was poured into molds, which were then stored at were concentrated in the higher-melting fractions, whereas
13°C for 24 h to solidify the chocolate. short-chain and unsaturated fatty acids were concentrated in
Bloom formation. An accelerated bloom study was con- the lower-melting fractions. The purified TAG (Table 3) had
ducted by exposing the chocolate samples to cycling temper- essentially the same distribution as the intact fats. The fatty
atures (19 and 29°C at 6-h intervals). Samples were analyzed acid profiles of the pooled ML for each fat are shown in
daily for surface bloom using a Hunterlab Color Quest Col- Table 4. In CB, myristic acid (C14:0) is slightly concentrated
ormeter (model Q45/0; Hunter Association, Inc., Reston, VA) in the ML and the longer-chain fatty acids have been reduced
as described by Lohman and Hartel (5). L*, a*, and b* values in concentration. In general, the fatty acid content of the ML
obtained from the colormeter were used to calculate the of milk fats was reduced in the shorter-chain fatty acids.
whiteness index (WI) as described by Lohman and Hartel (5). Other differences in fatty acid composition between the ML
and the native fats were small.
0.5
[
WI = 100 − (100 − L *) 2 + a *2 + b *2 ] [1] Acyl carbon number profiles are shown in Tables 5–7. CB
is composed primarily of three TAG (C50–C54) with a minor
A total of eight readings were taken for each chocolate amount of TAG with C34–C38. WAMF shows a bimodal dis-
sample with the sample being rotated 90° for each reading. tribution with peaks at C38 and C50. The higher-melting
Change in WI with cycling time followed an S-curve with an milk-fat fractions tend to have more higher acyl carbon num-
induction period, a linearly increasing region of WI, and a sat- ber TAG and the lower-melting fractions have more lower
uration value after a certain WI was reached. From the slope acyl carbon number TAG, as expected. The purified fats have
of the linear region of the bloom development curve using only slightly different acyl carbon profiles (Table 6). Interest-
least square linear regression, bloom rate was determined. ingly, all of the shorter-chain TAG (C34–C38) were removed
TABLE 1
Composition of Neutral Lipids in Cocoa Butter, Milk Fat, and Milk-Fat Fractionsa,b,c
Fatd TAG FA 1,3-DAG Sterols 1,2-DAG MAG
ICCB 96.8 ± 0.1 1.8 ± 0.0 1.0 ± 0.0 0.1 ± 0.0 0.3 ± 0.0 Trace
SAMF 98.0 ± 0.1 0.9 ± 0.1 0.6 ± 0.1 0.2 ± 0.0 0.3 ± 0.1 Trace
WAMF 98.0 ± 0.3 0.7 ± 0.1 0.7 ± 0.2 0.2 ± 0.1 0.2 ± 0.1 0.1 ± 0.1
VHM 97.6 ± 0.1 1.8 ± 0.1 0.4 ± 0.0 0.1 ± 0.0 0.1 ± 0.0 Trace
HM 97.6 ± 0.2 1.6 ± 0.1 0.5 ± 0.1 0.1 ± 0.1 0.2 ± 0.1 0.1 ± 0.0
MM2 97.4 ± 0.2 1.5 ± 0.3 0.7 ± 0.1 0.2 ± 0.0 0.2 ± 0.2 0.1 ± 0.0
MM1 98.0 ± 0.2 0.8 ± 0.1 0.2 ± 0.0 0.1 ± 0.0 0.7 ± 0.1 0.1 ± 0.1
LM 97.8 ± 0.8 1.2 ± 0.6 0.3 ± 0.1 0.2 ± 0.0 0.4 ± 0.3 Trace
a
Values determined by area percentage (peak area/total area).
b
Average values determined by three replicates with standard deviations taken at 99% confidence
intervals.
c
Triacylglycerols (TAG), fatty acid (FA), 1,3-diacylglycerols (1,3-DAG), 1,2-diacylglycerols (1,2-
DAG), and monoacylglycerols (MAG).
d
Ivory Coast cocoa butter (ICCB), summer anhydrous milk fat (SAMF), winter anhydrous milk fat
(WAMF), milk-fat fractions; very high-melting (VHM), high-melting (HM), middle-melting 2 (MM2),
middle-melting 1 (MM1), and low-melting (LM).
JAOCS, Vol. 77, no. 7 (2000)
4. 766 R.A. TIETZ AND R.W. HARTEL
TABLE 2 TABLE 4
FA Content of ICCB, Anhydrous Milk Fat, and Milk-Fat Fractionsa,b FA Content of Combined Minor Lipids Separated from Cocoa Butter,
FA ICCB SAMF WAMF VHM HM MM2 MM1 LM Milk Fat, and Milk-Fat Fractionsa,b
Fatty acid ICCB WAMF VHM HM MM2 MM1 LM
C4:0 0.0 4.9 3.8 2.0 2.9 4.3 4.3 4.7
C6:0 0.0 2.2 2.3 1.6 1.7 2.4 2.5 2.7 C4:0 0.0 1.9 2.1 2.2 2.3 1.9 2.2
C8:0 0.0 1.4 1.5 1.1 1.4 2.3 2.6 1.6 C6:0 0.0 4.0 0.6 0.9 1.0 0.6 1.1
C10:0 0.0 2.5 3.0 2.2 2.6 3.1 2.7 3.2 C8:0 0.0 0.8 0.8 0.8 0.8 0.9 1.0
C12:0 0.0 3.2 3.7 3.3 3.5 3.6 3.1 3.7 C10:0 0.0 2.1 1.6 2.0 1.7 1.5 1.9
C14:0 6.8 17.9 11.4 12.4 13.7 12.2 12.1 10.9 C12:0 0.0 4.4 2.8 7.2 8.2 3.0 3.3
C14:1 0.0 1.6 1.2 2.1 1.9 2.0 2.4 1.2 C14:0 10.9 13.2 23.0 23.8 21.7 27.8 16.8
C16:0 29.3 30.5 31.4 38.5 35.0 29.9 33.8 29.5 C14:1 0.0 1.6 0.0 0.0 3.2 0.0 3.0
C16:1 3.4 3.2 1.8 1.9 2.4 2.3 2.0 1.9 C16:0 29.5 34.4 37.5 33.7 33.3 34.8 33.1
C18:0 30.6 11.1 14.1 20.4 16.2 12.3 13.9 12.2 C16:1 9.4 2.6 4.2 4.7 8.9 6.5 7.9
C18:1 29.9 21.6 25.7 14.5 18.6 25.5 20.6 28.5 C18:0 25.7 13.3 13.8 11.8 10.7 11.4 10.7
a
Fatty acid values based on the average of three trials. C18:1 24.5 21.7 13.7 12.8 14.9 11.6 19.1
b a
Values given based on area percentage (peak area/total area). For abbrevia- Fatty acid values based on the average of three trials.
tions see Table 1. b
Values given based on area percentage (peak area/total area). See Table 1
for abbreviations.
from CB, indicating that these components were primarily the resulted in a longer time for onset of nucleation to occur. The
ML contained in CB. The acyl carbon number profiles of the ML apparently serve as nucleating sites and aid in crystalliza-
ML for each fat are shown in Table 7. For CB, the TAG with tion when present at lower levels; however, at higher levels
C34–C38 were significantly concentrated in the ML, indicat- they begin to interfere with crystallization. These results gen-
ing the high content of DAG. In the milk-fat components, a erally agree with previous studies on CB (12) and milk fat
bimodal distribution of acyl carbon number TAG was still (25), which suggests that ML such as DAG, MAG, and phos-
found, but now the peaks had shifted slightly. In particular, pholipids act as nucleating sites. It is interesting to see that
the lower peak was shifted to a slightly lower acyl carbon different levels of ML in the different milk-fat fractions had
number than the native milk fat. varying impacts on induction time. This may be explained by
Although the data shown in Tables 1–7 indicate the over- the different composition and type of ML in each milk-fat
all composition of the ML in these fats, the specific molecu- fraction. For example, 1,2-DAG in palm oil and CB were
lar composition (positional arrangement) is still unknown. found to delay crystal growth (10,26) and, in some cases, 1,3-
Further analytical work will be necessary to completely char- DAG promoted crystallization. The 1,3-DAG may incorpo-
acterize these components. rate into the crystalline lattice more easily by mimicking more
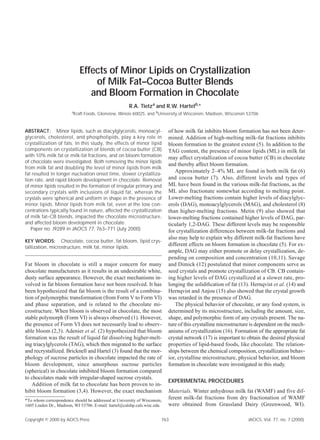
Crystallization kinetics. Differences in crystallization in- closely a CB TAG. These studies suggest that the levels of
duction times were found with different levels of ML from 1,2-DAG and 1,3-DAG may be more important than the over-
milk fat in 10% milk fat–CB blends. Induction times were
lowest for all milk fat and milk-fat fraction blends containing
their natural level of ML, as seen in Figure 1. Both removing TABLE 5
Acyl Carbon Content of Cocoa Butter, Milk Fat,
ML from milk fat and doubling the level of ML from milk fat
and Milk-Fat Fractionsa,b
Acyl
carbon ICCB SAMF WAMF VHM HM MM2 MM1 LM
TABLE 3
FA Content of Purified TAG Components of Cocoa Butter, Milk Fat, C26 0.0 2.9 4.4 2.4 3.1 3.3 1.5 3.0
and Milk-Fat Fractionsa,b C28 0.0 0.6 0.6 0.3 0.4 0.7 0.3 0.7
C30 0.0 1.0 1.1 0.6 1.7 1.2 0.6 1.3
FA ICCB WAMF VHM HM MM2 MM1 LM
C32 0.0 2.2 2.2 1.1 1.6 2.4 1.4 2.4
C4:0 0.0 4.6 3.5 4.7 3.7 5.1 4.7 C34 0.1 5.0 4.6 2.7 3.7 5.3 3.8 5.9
C6:0 0.0 2.7 1.9 2.6 2.7 2.8 2.5 C36 0.8 9.9 9.2 5.3 7.1 10.2 9.3 11.4
C8:0 0.0 2.3 1.4 1.9 1.8 2.1 2.3 C38 1.3 12.7 12.3 5.8 9.7 14.2 11.0 15.0
C10:0 0.0 3.1 2.6 3.5 3.4 2.8 2.8 C40 0.0 9.8 7.9 5.7 7.4 11.4 7.7 11.5
C12:0 0.0 3.6 3.4 4.2 3.7 3.0 3.0 C42 0.0 6.4 6.2 5.3 6.4 6.7 4.7 6.6
C14:0 4.2 12.3 12.5 7.7 11.3 10.9 13.9 C44 0.0 5.7 5.7 6.9 7.4 5.8 3.7 5.2
C14:1 0.0 2.8 2.5 2.4 1.9 2.9 3.2 C46 0.0 6.4 6.5 10.3 8.7 5.4 3.5 5.2
C16:0 28.5 31.6 38.3 37.7 30.4 34.5 29.7 C48 0.0 8.4 8.7 14.1 11.0 7.4 4.7 6.0
C16:1 4.9 2.8 1.3 1.7 1.9 1.6 2.3 C50 21.5 11.8 12.4 19.1 14.3 9.8 7.4 9.1
C18:0 31.5 12.6 18.7 17.4 12.8 13.2 10.2 C52 40.0 11.8 12.5 15.0 12.6 11.3 7.3 10.8
C18:1 30.7 21.5 13.6 16.2 26.5 19.4 25.2 C54 36.3 5.5 5.8 5.6 4.9 5.1 3.3 5.8
a a
Fatty acid values based on the average of three trials. Acyl carbon values based on the average of three trials.
b b
Values given based on area percentage (peak area/total area). See Table 1 Values given based on area percentage (peak area/total area). See Table 1
for abbreviations. for abbreviations.
JAOCS, Vol. 77, no. 7 (2000)
5. EFFECTS OF MINOR LIPIDS ON COCOA BUTTER AND CHOCOLATE 767
TABLE 6
Acyl Carbon Content of the Purified TAG Component
of Cocoa Butter, Milk Fat, and Milk-Fat Fractionsa,b
Acyl
carbon ICCB WAMF VHM HM MM2 MM1 LM
C26 0.0 0.0 0.0 0.0 0.0 0.0 0.0
C28 0.0 0.6 0.3 0.3 0.6 0.4 0.7
C30 0.0 1.2 0.5 0.6 1.0 0.9 1.3
C32 0.0 2.4 1.1 1.3 2.1 1.8 2.5
C34 0.0 5.5 2.4 3.1 5.0 5.3 5.2
C36 0.0 11.2 5.2 6.6 11.7 13.5 11.6
C38 0.0 15.2 7.2 9.2 14.3 14.6 15.6
C40 0.0 12.0 6.3 8.1 11.6 11.8 12.8
C42 0.0 7.5 4.9 6.7 7.0 7.4 7.1
C44 0.0 6.7 7.3 7.6 6.0 5.6 5.7
C46 0.0 4.1 10.7 9.3 6.1 5.3 5.5
C48 0.0 8.7 14.6 11.8 7.6 7.0 6.7 FIG. 1. Crystallization induction times for 10% milk fat–cocoa butter
C50 19.6 11.6 18.9 15.4 10.1 10.9 9.3 blends with varying levels of minor lipids (ML): no milk-fat ML [triacyl-
C52 47.2 8.3 15.1 13.9 11.3 10.8 10.8 glycerols (TAG) fraction], normal levels of milk-fat ML (intact fat) and
C54 33.2 5.1 5.6 6.0 5.7 4.8 5.4 twice the level of milk-fat ML (doubled ML). Winter anhydrous milk fat
a
Acyl carbon values based on the average of three trials. (WAMF) and milk-fat fractions; very high-melting (VHM), high-melting
b
Values given based on area percentage (peak area/total area). See Table 1 (HM), middle-melting 1 (MM1), middle-melting 2 (MM2), and low-melt-
for abbreviations. ing (LM) milk-fat fractions. Samples were crystallized with agitation at
25°C. Induction time determined as the time when absorbance first
began to increase.
all DAG concentration. ML play the greatest role in the ini-
tial nucleation step and play a smaller role in crystal growth.
This was also seen in our results (data not shown) on crystal- ation and crystal growth but also had an impact on the poly-
lization rates, which were not very different between samples. morphic change of CB from Form V to Form VI. For all
Only the VHM, HM, and LM fractions showed statistically blends made with 10% milk fat in CB, the initial x-ray spec-
significant differences in crystallization rates with varying tra showed that there was about 20% Form VI with the ma-
levels of ML. With these fractions, it was found that remov- jority in Form V. After 4 d of temperature cycling, the blends
ing ML or doubling the ML level resulted in a slight decrease made without ML contained about 80% Form VI, compared
in crystallization rate. to only about 40% Form VI for blends with ML. After 10 d
Polymorphism. ML from milk fat not only affected nucle- of temperature cycling, the blend without ML had reached ca.
100% Form VI, whereas the blends with ML had only
TABLE 7
reached about 60% Form VI. Higher levels of ML inhibited
Acyl Carbon Content of Minor Lipids Separated from Cocoa Butter, the polymorphic change from Form V to Form VI, which has
Milk Fat, and Milk-Fat Fractionsa,b been associated with bloom formation (1,27). Furthermore,
Acyl the transition to Form VI in CB was inhibited by the presence
carbon ICCB WAMF VHM HM MM2 MM1 LM of DAG (28).
C12 0.17 3.4 1.7 1.4 1.4 1.5 3.4 Crystalline microstructure. In this system, large primary
C18 1.5 4.6 5.5 2.5 4.3 2.9 5.7 crystals with spherulitic shape were formed during crystal-
C24 2.9 18.5 12.1 11.1 16.6 6.2 22.8 lization at 25°C. These spherulites were surrounded by many
C26 0 2.4 1.8 3.3 4.5 2.2 1.2 very small secondary crystals, which were most likely formed
C28 0 4.0 6.8 4.4 6.7 1.8 2.6
during cooling of the slurry to 10°C. The primary crystals
C30 0 6.1 5.5 8.6 4.8 1.9 5.3
C32 0 8.7 6.8 1.4 0.8 4.7 4.3 contained most of the crystalline fat in this system, since the
C34 1.9 6.0 7.9 8.4 8.3 2.4 0.4 solid fat content of CB at 25°C is 70–77%. Figure 2 shows
C36 10.0 1.2 3.7 3.0 1.1 5.7 2.4 the effect of removing the ML from CB on the primary and
C38 7.5 0.5 0.6 4.0 2.3 0.8 3.2 secondary crystal structure. When the ML were present, the
C40 0.5 2.5 2.2 0.8 3.4 1.3 1.2
primary crystals were essentially uniform spherulites
C42 0 1.4 1.5 2.0 2.7 1.8 1.4
C44 0.7 3.9 4.7 4.3 4.9 3.5 1.7 (200–300 µm) with filaments radiating from a central nucleus
C46 9.7 9.8 7.5 10.6 9.3 8.1 11.6 (Fig. 2A). A narrow band, or halo, appeared on the outside
C48 26.7 13.4 11.0 14.9 12.6 15.8 17.6 edge of the crystal, a phenomenon also observed by Rousseau
C50 27.8 5.8 13.8 14.0 9.7 17.8 8.7 et al. (29). Removal of the ML from cocoa butter resulted in
C52 9.4 7.1 5.1 4.0 4.8 17.2 6.0
a significantly different crystalline microstructure (Fig. 2B)
C54 1.3 0.7 1.9 1.4 1.9 6.9 0.7
a
even though there was no apparent difference in polymorph
Acyl carbon values based on the average of three trials.
b
Values given based on area percentage (peak area/total area). See Table 1 (similar x-ray spectra). When the ML were removed, the
for abbreviations. spherulites were more irregularly shaped and contained mul-
JAOCS, Vol. 77, no. 7 (2000)
6. 768 R.A. TIETZ AND R.W. HARTEL
FIG. 2. Confocal laser scanning micrographs of (A) Ivory Coast cocoa
butter, and (B) purified TAG component of Ivory Coast cocoa butter.
Samples were stained with Nile red and Nile blue used in a ratio of
0.5:100. Magnification = 100×. Sample crystallized at 25°C for 1 h,
placed on microscope slide and then further crystallized at 10°C for
16 h. For abbreviation see Figure 1.
tiple inclusions (potentially liquid fat). Apparently, the pres-
ence of ML helped organize the primary crystal structure
within the spherulites in a more uniform way. The secondary
crystal structure also was distorted upon removal of ML. In
this case, secondary crystals were more diffuse and irregular.
Similar results of the effects of ML on crystallization of milk
fat were observed by Marangoni and Hartel (17). The effect
of doubling the level of ML in CB was not studied. FIG. 3. Confocal laser scanning micrographs of Ivory Coast cocoa but-
The addition of 10% WAMF had only a minor effect on ter with (A) 10% winter milk fat, (B) 10% purified TAG of winter milk
the crystalline structure of CB (Fig. 3A), although the primary fat, and (C) 10% winter milk fat with twice the normal levels of minor
crystals were slightly smaller than the pure CB due to inhibi- lipids. Samples were stained with Nile red and Nile blue used in a ratio
tion of crystallization. In the milk fat–CB blends, removal of of 0.5:100. Magnification = 100×. Sample crystallized at 25°C for 1 h,
placed on microscope slide, and then further crystallized at 10°C for
the ML from milk fat resulted in formation of primary crys- 16 h. For abbreviation see Figure 1.
tals that were more random and open, with a branched struc-
ture, rather than filaments radiating from a central core (Fig.
3B). Once again, concentric rings were seen on the outside on the primary crystalline structure, but resulted in larger and
edge of the primary crystals. Secondary crystals were not af- more well-defined secondary crystals (Fig. 3C).
fected significantly due to addition of 10% WAMF. Addition Addition of 10% VHM had a significant effect on CB crys-
of twice the normal level of ML from milk fat had little effect tal structure (Fig. 4A). Both primary and secondary crystals
JAOCS, Vol. 77, no. 7 (2000)
7. EFFECTS OF MINOR LIPIDS ON COCOA BUTTER AND CHOCOLATE 769
sulted in even more irregular primary crystals in the CB blend
(Fig. 4B). The secondary crystals were also more random in
size and morphology. Addition of twice the level of ML in the
VHM fraction resulted in even greater disruption of the CB
crystal structure (Fig. 4C). Here, the primary crystals con-
tained several strong concentric rings as well as many inclu-
sions. The secondary crystals also were more random in size
and morphology, even than those found upon removal of ML.
These results indicate that different milk-fat components
result in solidification of different lipid crystalline networks
in this system with CB. Both TAG composition and ML level
influenced the solidification properties of the CB. The pres-
ence of the ML at low levels may direct the formation of uni-
form spherical crystals by serving as nucleation sites and fill-
ing lattice spaces in the CB crystals. Removal of the ML, as
well as addition of twice the level of ML, generally led to
more random crystal growth. These results may lead to dif-
ferent physical properties in lipid-based foods, like chocolate.
For example, formation of fat bloom in chocolate may be, in
part, related to migration of liquid fat through the chocolate
structure. Different CB crystal structures result in different
oil migration rates and may impact rate of bloom formation
in chocolate. To test this hypothesis, chocolates were made
with different levels of ML and tested for bloom stability.
Bloom formation. To understand the importance of chemi-
cal composition and microstructure on bloom formation in
chocolate, the different levels of milk-fat ML (none, natural
level, and twice the natural level) for each fraction were com-
pared. Significant differences in bloom development were
found for the different levels of ML contained in the milk-fat
fractions added to chocolate. Figure 5 compares the effects of
ML in WAMF on change in WI during temperature cycling
of chocolate. Bloom development was best inhibited in these
chocolates with the natural level of ML in WAMF. Choco-
lates made with increased levels of ML from milk fat or with
FIG. 4. Confocal laser scanning micrographs of Ivory Coast cocoa but-
ter with (A) 10% VHM, (B) 10% purified TAG of VHM, and (C) 10%
VHM with twice the levels of minor lipids. Samples were stained with
Nile red and Nile blue used in a ratio of 0.5:100. Magnification = 100×.
Sample crystallized at 25°C for 1 h, placed on microscope slide, and
then further crystallized at 10°C for 16 h. For abbreviations see Figure 1.
were more irregular than those found in pure CB or even with
10% WAMF. In this case, primary crystals had numerous con-
FIG. 5. Bloom development of chocolates made with 10% WAMF with
centric rings, or haloes, perhaps indicative of significant varying levels of ML. No milk-fat ML (WAMF TAG), normal levels of
cocrystallization between the high-melting component of ML (WAMF), and twice the level of ML (WAMF ML). For abbreviations
milk fat and the CB. Removal of the ML from the VHM re- see Figure 1.
JAOCS, Vol. 77, no. 7 (2000)
8. 770 R.A. TIETZ AND R.W. HARTEL
on Fat Bloom in Dark Chocolate, J. Am. Oil Chem. Soc. 71:
267–276 (1994).
6. Christie, W.W., The Analysis of Lipids with Special Reference
to Milk Fat, in Recent Advances in Chemistry and Technology
of Fats and Oils, edited by R.J. Hamilton and A. Bhati, Elsevier
Applied Science Publishers Ltd., Essex, England, 1987, pp.
57–74.
7. Okawachi, T., N. Sagi, and H. Mori, Confectionery Fats from
Palm Oil, J. Am. Oil Chem. Soc. 62:421–425 (1985).
8. Sherbon, J.W., Crystallization and Fractionation of Milk Fat,
Ibid. 51:22–25 (1974).
9. Metin, S., Crystallization Behavior and Kinetics of Blends of
Cocoa Butter and Milk Fat or Milk Fat Fractions, Ph.D. Thesis,
University of Wisconsin-Madison, 1997.
10. Wahnelt, S., D. Meusel, and M. Tulser, Der Einfluss Isomerer
Diglyceride auf Phasenumwanlungen von Kakaobutter-Unter-
suchungen Mittels Isothermer DSC, Fat Sci. Technol. 93:
FIG. 6. Bloom induction time for chocolates made with 10% milk-fat
174–178 (1991).
fractions with varying levels of ML. No milk-fat ML (TAG), normal lev-
11. Okiy, D.A., Interaction of Triglycerides and Diglycerides of
els of ML (Normal), and twice the level of ML. Cocoa butter (CB),
Palm Oil, Oleagineux 33:625–628 (1978).
WAMF, summer anhydrous milk fat (SAMF), milk-fat fractions; MM1,
12. Savage, C.M., and P.S. Dimick, Influence of Phospholipids Dur-
MM2, and LM milk-fat fractions. VHM and HM fractions did not show
ing Crystallization of Hard and Soft Cocoa Butters, Manuf. Con-
visual bloom after 60 d and were not included. See Figure 1 for other
fect. 75:127–132 (1995).
abbreviations.
13. Kattenberg, H.R., The Quality of Cocoa Butter, Ibid. 61:32–38
(1981).
14. Hernqvist, L., B. Herslof, K. Larsson, and O. Podlaha, Polymor-
phism of Rapeseed Oil with a Low Content of Erucic Acid and
no milk-fat ML exhibited more rapid bloom formation. Fig-
Possibilities to Stabilize the Beta-Crystal Form in Fats, J. Sci.
ure 6 shows that, in general, the induction time for onset of Food Agric. 32:1197–1202 (1981).
bloom was longest for chocolates made with milk-fat compo- 15. Hernqvist, L., and K. Anjou, Diglycerides as a Stabilizer of the
nents containing their natural level of ML. Again, either re- Beta-Crystal Form in Margarines and Fats, Fette Seifen
moving milk-fat ML or adding twice the level of ML gener- Anstrichm. 85:64–66 (1983).
16. Dickinson, E., New Physico-Chemical Techniques for the
ally resulted in faster onset of bloom formation. The rate of
Characterization of Complex Food Systems, Chapman and
bloom formation (slope of linear increasing portion of WI) Hall, Cambridge University Press, Great Britain, 1993,
was less affected by the ML (data not shown), although rate pp. 54–68.
of bloom formation was slightly lower for chocolates made 17. Marangoni, A.G., and R.W. Hartel, Visualization and Structural
with milk-fat components containing their natural level of Analysis of Fat Crystal Networks, Food Technol. 52:46–51
(1998).
ML.
18. Carroll, K.K., Separation of Lipid Classes by Chromatography
The ML from milk fat clearly affected crystallization kinet- on Florisil, J. Lipid Res. 2:135–141 (1961).
ics and the nature of the crystalline microstructure. The ML 19. Liu, J., T. Lee, E. Bobik, M. Guzman-Harty, and C. Hastilow,
from milk fat also had an impact on bloom formation in choco- Quantitative Determination of Monoglycerides and Diglycerides
lates, potentially through their effect on crystalline microstruc- by High-Performance Liquid Chromatography and Evaporative
Light-Scattering Detection, J. Am. Oil Chem. Soc. 70:343–347
ture. This relation between crystalline structure and physical
(1993).
properties of lipid-based foods should be explored further. 20. Iverson, J.L., and A.J. Sheppard, Determination of Fatty Acids
in Butter Fat Using Temperature-Programmed Gas Chromatog-
raphy of Butyl Esters, Food Chem. 21:223–234 (1986).
ACKNOWLEDGMENTS 21. Lund, P., Analysis of Butterfat Triglycerides by Capillary Gas
This research was funded by the Wisconsin Milk Marketing Board Chromatography, Milchwissenschaft 43:159–161 (1988).
through the Wisconsin Center for Dairy Research. 22. Tietz, R.A., The Effects of Milk Fat Minor Lipids on the Crys-
tallization of Milk Fat–Cocoa Butter Blends and Bloom Forma-
tion in Chocolate, M.S. Thesis, University of Wisconsin, Madi-
REFERENCES son, WI, 1998.
1. Wille, R.L., and E.S. Lutton, Polymorphism of Cocoa Butter, J. 23. IUPAC, Standard Method for the Analysis of Oils, Fats and De-
Am. Oil Chem. Soc. 43:491–496 (1966). rivatives, International Union of Pure and Applied Chemistry,
2. Adenier, H., H. Chaveron, and M. Ollivon, Developments in Applied Chemistry Division, Commission on Oils, Fats and De-
Food Science, Vol. 33, edited by G. Charalambous, Elsevier Sci- rivatives, 7th edn., edited by C. Paquot and A. Hautfenne,
ence Publishers B.V., New York, 1993, p. 353. Boston, Method 2.150, 1987.
3. Bricknell, J., and R.W. Hartel, Relation of Fat Bloom in Choco- 24. Kleinert, I.J., Tempering of Melted Chocolate Masses, Rev.
late to Polymorphic Transition of Cocoa Butter, J. Am. Oil Chocolate, Confectionery, Baking 5:19–24 (1980).
Chem. Soc. 75:1609–1616 (1998). 25. Walstra, P., and E.C.H. van Beresteyn, Crystallization of Milk
4. Campbell, L.B., D.A. Andersen, and P.G. Keeney, Hydro- Fat in the Emulsified State, Neth. Milk Dairy J. 29:35–65
genated Milk Fat as an Inhibitor of the Fat Bloom Difference in (1975).
Dark Chocolate, J. Dairy Sci. 52:976–979 (1969). 26. Siew, W., and W. Ng, Effect of Diglycerides on Crystallization
5. Lohman, M.H., and R.W. Hartel, Effect of Milk Fat Fractions of Palm Olein, J. Sci. Food Agric. 71:496–500 (1996).
JAOCS, Vol. 77, no. 7 (2000)
9. EFFECTS OF MINOR LIPIDS ON COCOA BUTTER AND CHOCOLATE 771
27. Cebula, D.J., and G. Ziegleder, Studies of Bloom Formation 29. Rousseau, D., A.G. Marangoni, and K.R. Jeffrey, The Influence
Using X-Ray Diffraction from Chocolates After Long-Term of Chemical Interesterification on the Physicochemical Proper-
Storage, Fat Sci. Technol. 9:340–343 (1993). ties of Complex Fat Systems. 2. Morphology and Polymor-
28. Schlichter-Aronhime, J., and N. Garti, Solidification and Poly- phism, J. Am. Oil Chem. Soc. 75:1833–1841 (1999).
morphism in Cocoa Butter and the Blooming Problems, in Crys-
tallization and Polymorphism of Fats and Fatty Acids, Vol. 31,
edited by N. Garti and K. Sato, Marcel Dekker, Inc., New York,
1988, pp. 363–393. [Received June 23, 1999; accepted March 16, 2000]
JAOCS, Vol. 77, no. 7 (2000)