
Recommended
More Related Content
Viewers also liked
Viewers also liked (12)
Similar to Flooding Evidence
Similar to Flooding Evidence (20)
Recently uploaded
Recently uploaded (20)
Flooding Evidence
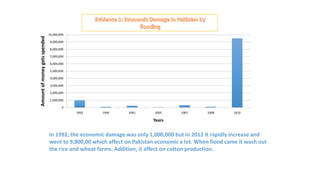
- 1. 10,000,000 Amount of money gets spended 9,000,000 8,000,000 7,000,000 6,000,000 5,000,000 4,000,000 3,000,000 2,000,000 1,000,000 0 1992 1994 2001 2005 2007 2008 2010 Years In 1992, the economic damage was only 1,000,000 but in 2012 it rapidly increase and went to 9,800,00 which affect on Pakistan economic a lot. When flood came it wash out the rice and wheat farms. Addition, it affect on cotton production.
- 2. 20000000 18000000 Number of people get affeted 16000000 14000000 12000000 10000000 8000000 6000000 4000000 2000000 0 1992 1992 1995 1996 2003 2005 2010 Years In 1992, the people who got affected were almost 6,500,00 but in 2010 it really increased. It went to 18,000,00 people get affected. It suddenly become higher from past years.
- 3. The picture 1 shows the actual rain. In 2nd picture it shows the normal rainfall. In 3rd picture the dark blue part shows those area’s had the most rainfall and those areas got flooded.
- 4. This picture shows the view of damage area in Pakistan.
- 6. Map:1 The area it is more red those area’s were most affected by flooding.
- 7. The area’s which are brown those area’s got affected badly.
- 8. This is showing the rain in Pakistan through 1998 to 2011
- 9. (a) shows that the geographic spreading of rainfall in South Asia. (b) Weather spreading of rainfall (mm/month) averaged in Pakistan. Most rain falls in July-August buy during the summer monsoon made twice the amount than happened in winter.
Editor's Notes
- The area it is red it was the most affected areas by flooding.