June 2008 Monthly Update
•
0 likes•203 views

Last Arbitrage performance letter. The halcyon days!

Recommended
More Related Content
What's hot
What's hot (20)
Similar to June 2008 Monthly Update
Similar to June 2008 Monthly Update (20)
Recently uploaded
Recently uploaded (20)
June 2008 Monthly Update
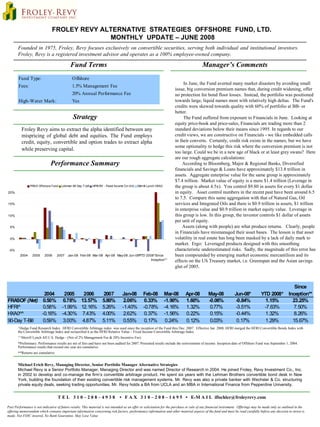
- 1. Fund Type: Offshore Fees: 1.5% Management Fee 20% Annual Performance Fee High-Water Mark: Yes -5% 0% 5% 10% 15% 20% 2004 2005 2006 2007 Jan-08 Feb-08 Mar-08 Apr-08 May-08 Jun-08* YTD 2008*Since Inception** FRAS Offshore Fund Lehman 90 Day T-bill HFRI RV - Fixed Income Cvt Arb Merrill Lynch HXA0 FROLEY REVY ALTERNATIVE STRATEGIES OFFSHORE FUND, LTD. MONTHLY UPDATE – JUNE 2008 Froley Revy aims to extract the alpha identified between any mispricing of global debt and equities. The Fund employs credit, equity, convertible and option trades to extract alpha while preserving capital. Fund Terms T E L 3 1 0 – 2 0 8 – 4 9 3 8 • F A X 3 1 0 – 2 0 8 – 1 6 9 5 • E-M A I L ifischler@froleyrevy.com Past Performance is not indicative of future results. This material is not intended as an offer or solicitation for the purchase or sale of any financial instrument. Offerings may be made only as outlined in the offering memorandum which contains important information concerning risk factors, performance information and other material aspects of the fund and must be read carefully before any decision to invest is made. Not FDIC insured, No Bank Guarantee, May Lose Value Michael Erich Revy, Managing Director, Senior Portfolio Manager Alternative Strategies Michael Revy is a Senior Portfolio Manager, Managing Director and was named Director of Research in 2004. He joined Froley, Revy Investment Co., Inc. in 2002 to develop and co-manage the firm’s convertible arbitrage product. He spent six years with the Lehman Brothers convertible bond desk in New York, building the foundation of their existing convertible risk management systems. Mr. Revy was also a private banker with Wechsler & Co. structuring private equity deals, seeking trading opportunities. Mr. Revy holds a BA from UCLA and an MBA in International Finance from Pepperdine University. Founded in 1975, Froley, Revy focuses exclusively on convertible securities, serving both individual and institutional investors. Froley, Revy is a registered investment advisor and operates as a 100% employee-owned company. Manager’s Comments Performance Summary ^Hedge Fund Research Index . HFRI Convertible Arbitrage index was used since the inception of the Fund thru Dec. 2007. Effective Jan. 2008, HFRI merged the HFRI Convertible Bonds Index with the Convertible Arbitrage Index and reclassified it as the HFRI Relative Value – Fixed Income Convertible Arbitrage Index. ^^Merrill Lynch All U.S. Hedge - (Net of 2% Management Fee & 20% Incentive Fee) *Preliminary. Performance results are net of fees and have not been audited for 2007. Presented results include the reinvestment of income. Inception date of Offshore Fund was September 1, 2004. Performance results that exceed one year are cumulative. **Returns are cumulative Strategy In June, the Fund averted many market disasters by avoiding small issue, big conversion premium names that, during credit widening, offer no protection for bond floor losses. Instead, the portfolio was positioned towards large, liquid names most with relatively high deltas. The Fund's credits were skewed towards quality with 60% of portfolio at BB- or better. The Fund suffered from exposure to Financials in June. Looking at equity price-book and price-sales, Financials are trading more than 2 standard deviations below their means since 1995. In regards to our credit views, we are constructive on Financials - we like embedded calls in their converts. Certainly, credit risk exists in the names, but we have some optionality to hedge this risk where the conversion premium is not too large. Could we be in a new age of black or at least grey swans? Here are our rough aggregate calculations: According to Bloomberg, Major & Regional Banks, Diversified financials and Savings & Loans have approximately $13.8 trillion in assets. Aggregate enterprise value for the same group is approximately $7.4 trillion. Market value of equity is a mere $1.4 trillion (Leverage in the group is about 4.5x). You control $9.80 in assets for every $1 dollar in equity. Asset control numbers in the recent past have been around 6.5 to 7.5. Compare this same aggregation with that of Natural Gas, Oil services and Integrated Oils and there is $0.9 trillion in assets, $1 trillion in enterprise value and $0.9 trillion in market equity value. Leverage in this group is low. In this group, the investor controls $1 dollar of assets per unit of equity. Assets (along with people) are what produce returns. Clearly, people in Financials have mismanaged their asset bases. The lesson is that asset volatility in real estate has long been masked by a lack of daily mark to market. Ergo: Leveraged products designed with this smoothing characteristic underestimated risks. Sadly, the magnitude of this error has been compounded by emerging market economic mercantilism and its effects on the US Treasury market, i.e. Greenspan and the Asian savings glut of 2005. 2004 2005 2006 2007 Jan-08 Feb-08 Mar-08 Apr-08 May-08 Jun-08* YTD 2008* Since Inception** FRASOF (Net) 0.50% 0.78% 13.57% 5.80% 2.06% 0.33% -1.90% 1.60% -0.06% -0.84% 1.15% 23.25% HFRI^ 0.58% -1.99% 12.16% 5.26% -1.40% -0.78% -4.16% 1.32% 0.77% -3.51% -7.63% 7.50% HXA0^^ -0.16% -4.30% 7.43% 4.00% 2.62% 0.37% -1.56% 0.22% 0.15% -0.44% 1.32% 8.26% 90-Day T-Bill 0.59% 3.00% 4.87% 5.11% 0.55% 0.17% 0.24% 0.12% 0.03% 0.17% 1.29% 15.67%