SlideShare a Scribd company logo
1 of 93
PERSPECTIVE
Understanding Nutritional Epidemiology and Its
Role in Policy1,2
Ambika Satija,3,4 Edward Yu,3 Walter C Willett,3–5 and Frank
B Hu3–5*
3Department of Nutrition and 4Department of Epidemiology,
Harvard School of Public Health, Boston, MA; and 5Channing
Division of Network Medicine, Brigham and Women’s Hospital,
Boston, MA
ABSTRACT
Nutritional epidemiology has recently been criticized on several
fronts, including the inability to measure diet accurately, and
for its reliance
on observational studies to address etiologic questions. In
addition, several recent meta-analyses with serious
methodologic flaws have arrived
at erroneous or misleading conclusions, reigniting controversy
over formerly settled debates. All of this has raised questions
regarding the
ability of nutritional epidemiologic studies to inform policy.
These criticisms, to a large degree, stem from a
misunderstanding of the
methodologic issues of the field and the inappropriate use of the
drug trial paradigm in nutrition research. The exposure of
interest in
nutritional epidemiology is human diet, which is a complex
system of interacting components that cumulatively affect
health. Consequently,
nutritional epidemiology constantly faces a unique set of
challenges and continually develops specific methodologies to
address these.
Misunderstanding these issues can lead to the nonconstructive
and sometimes naive criticisms we see today. This article aims
to clarify common
misunderstandings of nutritional epidemiology, address
challenges to the field, and discuss the utility of nutritional
science in guiding policy
by focusing on 5 broad questions commonly asked of the field.
Adv Nutr 2015;6:5–18.
Keywords: dietary assessment, food policy, meta-analysis,
nutritional epidemiology, randomized controlled trials,
prospective cohort studies
Introduction
Epidemiology has long had its share of skeptics, with Taubes’
1995 article being the most well-known (1). However, more
recent commentaries have attacked nutritional epidemiol-
ogy on several fronts. Ioannidis (2) criticizes the observa-
tional nature of epidemiologic studies and small trials,
stating that “definitive solutions won’t come from another
million observational papers or small randomized trials.”
He refers to an article by Archer et al. (3), which calls into
question the validity of data from the NHANES and suggests
that “the ability to estimate population trends in caloric
intake and generate empirically supported public policy rel-
evant to diet-health relations from US nutritional sur-
veillance is extremely limited.” Furthermore, questionably
designed and executed meta-analyses have disseminated
conflicting messages about nutrition and health, such as
the conclusion that being overweight lowers the risk of all-
cause mortality (4) and that replacing saturated fat with
polyunsaturated fats has no substantial impact on cardiovas-
cular risk (5). Such conclusions are not only confusing but
also dangerous because they can be perceived as misleading
messages, or can lead to the communication of misleading
messages to the public by popular media and the consequent
adoption of unhealthy practices by the population at large.
For instance, after the publication of the latter meta-analysis,
New York Times columnist Mark Bittman told his readers
that they “can go back to eating butter” (6).
Many authors have suggested that large randomized con-
trolled trials (RCTs)6 are the only solution to circumventing
the problems in observational research. In reality, RCTs are
far from being the panacea in the study of diet and chronic
disease, and the results of such trials can be misleading. A
key reason is that the exposure of interest in nutritional
epidemiology—dietary intake—is complex, with interac-
tions and synergies across different dietary components,
which can be difficult to study with use of a linear drug trial
approach. A complex behavioral exposure such as diet also
makes other aspects important in pharmacologic RCTs,
such as high compliance and blinding, difficult and infea-
sible in most dietary intervention trials. Consequently,
1
Supported by NIH grants HL60712, DK58845, P30 DK46200,
and U54CA155626.
2
Author disclosures: A Satija, E Yu, WC Willett, and FB Hu, no
conflicts of interest.
* To whom correspondence should be addressed. E-mail:
[email protected]
6 Abbreviations used: CVD, cardiovascular disease; DLW,
doubly labeled water; IHD, ischemic
heart disease; NTD, neural tube defect; RCT, randomized
controlled trial; SSB,
sugar-sweetened beverage; TFA, trans FA; WHI, Women’s
Health Initiative.
ã2015 American Society for Nutrition. Adv. Nutr. 6: 5–18,
2015; doi:10.3945/an.114.007492. 5
a
t F
O
R
T
V
A
L
L
E
Y
S
T
A
T
E
U
N
IV
E
R
S
IT
Y
o
n
Ja
n
u
a
ry 9
, 2
0
1
8
a
d
va
n
ce
s.n
u
tritio
n
.o
rg
D
o
w
n
lo
a
d
e
d
fro
m
http://advances.nutrition.org/
nutritional epidemiology has design and analysis issues
unique to the field, and understanding the details of nutri-
tional epidemiologic studies requires a deep knowledge of
nutritional science and its methodologic background.
The purpose of this article is to clarify common misun-
derstandings of nutritional epidemiology, address the chal-
lenges to the field, and discuss the utility of nutritional
science in guiding policy. In particular, we address 5 broad
questions that have been commonly raised about nutritional
epidemiologic studies.
Can We Reliably Measure Dietary Intakes in
Individuals and Populations?
Measuring diet in free-living populations is challenging be-
cause individual diets are complex exposures with innumer-
able and sometimes poorly characterized components that
are consumed in varying amounts and combinations by dif-
ferent individuals. Dietary variables are rarely dichotomous;
often, but not always, the entire population is “exposed” to
some degree. Diet is also a time-varying exposure, with in-
dividual dietary habits and food composition changing
over time. It is not surprising, then, that most dietary assess-
ment methods have a component of error, which could be
random day-to-day, diurnal, and seasonal variation in an in-
dividual’s diet over time, or because of systematic mecha-
nisms, such as omission of foods when collecting data.
Nonetheless, several techniques have been developed to as-
certain dietary intake from free-living populations, and
these methods have shown good validity with use of multi-
ple criteria. Although each assessment method comes with
its own set of limitations, strengths unique to each method
make it appropriate for use in specific applications (7–10).
Multiple-week diet records, which require participants to
record everything they eat or drink over the course of several
weeks, are regarded as the gold standard for ascertaining di-
etary information because, unlike other methods, they do
not rely on memory. The high participant burden and cost
of keeping diet records has limited their use in large-scale
epidemiologic studies; however, their ability to accurately
ascertain detailed dietary information makes them useful
in validation studies of other diet assessment methods,
and in monitoring compliance in trials. Another limitation
of diet records is that the process of recording can change
an individual’s diet, rendering the data atypical of usual in-
take, although estimated intakes from diet records have been
found to correlate reasonably well with those from multiple
24-h recalls (11). Repeated 24-h recalls involve a respondent
reporting all foods consumed in the previous 24 h or calen-
dar day to a trained interviewer in person or over the phone.
Although reliance on the participant’s memory leaves room
for measurement error, a skilled interviewer can produce
highly detailed and useful nutritional data comparable to a
diet record (11, 12). This method has been widely employed
in dietary intervention trials. It is also used in national sur-
veys to monitor trends in nutritional intake.
A potential source of error common to these methods is
in the estimation of nutrients with use of food composition
tables. The nutrient content of a food varies with season, lo-
cation of production, growing conditions, storage, process-
ing, and cooking techniques, and many of these factors are
unaccounted for in food composition tables. The degree to
which this is problematic differs from nutrient to nutrient.
Although for some nutrients, such as dietary FAs, it is rea-
sonable to assume that these variations do not substantially
affect calculated intakes, for others, such as selenium, the
variation can result in calculated intakes that are substan-
tially different from true intakes (7). In general, however,
this source of error does not substantially compromise the
ability to rank individuals with respect to nutrient intake
so as to evaluate associations with health outcomes (7,
13). Nevertheless, estimating nutrient composition from
food intake data is a challenge, especially given the changing
food landscape, and it is crucial that we continue to improve
the accuracy of food composition databases.
When participants provide biological specimens, re-
searchers can additionally measure intake by assaying bio-
markers. Examples of biomarkers include doubly labeled
water (DLW) (for total energy intake), urinary nitrogen
(for protein intake), 24-h urinary sodium and potassium,
blood lipid profiles, serum and plasma folate, and selenium
and other trace minerals in toenails. Biomarkers allow for
objective measurement of intake without any bias because
of self-reporting. The limitations of biomarkers, however,
have prevented their wider use. In particular, many foods
and nutrients lack sensitive or specific biomarkers, their
assessment always includes error from multiple sources,
they may not be indicators of individual long-term intake,
and obtaining and testing for biomarkers is expensive and
burdensome. Thus, use of biomarkers to investigate nutrient-
disease relations has been mostly confined to nested case-
control studies and small trials. Biomarkers are also useful
in assessing the validity of less-expensive, self-reported as-
sessments of diet, such as FFQs.
An FFQ consists of a structured food list and a frequency
response section on which the participant indicates his/her
usual frequency of intake of each food over a certain period
of time in the past, usually 1 y. This is the most common
choice for measuring intake in large observational studies
owing to its ease of use, low participant burden, and ability
to capture usual long-term dietary intake. These features
make possible repeated assessments over time, which is im-
portant to capture longer term variation in diets. Table 1
presents a comparative summary of the advantages, disad-
vantages, and applications of these dietary assessment
methods.
Thus, a collection of diverse diet assessment methods is
available; their appropriate application, alone or in combi-
nation, allows for a reasonably comprehensive assessment
of the diet of free-living populations. Nevertheless, recent
critiques of these dietary assessment methods have called
into question their utility in examining diet-disease relations
and informing policy. A recent example is the article by Ar-
cher et al. (3), which criticizes the use of 24-h dietary recall
data periodically collected in the NHANES. Archer et al.
6 Satija et al.
a
t F
O
R
T
V
A
L
L
E
Y
S
T
A
T
E
U
N
IV
E
R
S
IT
Y
o
n
Ja
n
u
a
ry 9
, 2
0
1
8
a
d
va
n
ce
s.n
u
tritio
n
.o
rg
D
o
w
n
lo
a
d
e
d
fro
m
http://advances.nutrition.org/
compared reported energy intake as assessed by the 24-h re-
calls with expected basal metabolic rate and concluded that
recalled energy intake data were implausibly low and recom-
mended that NHANES data be eliminated in considering
public policy. This finding represents the danger of misun-
derstanding methodologic issues and making inferences
with use of faulty logic. A recent article by Hébert et al.
(13) comprehensively refutes the conclusions drawn from
this study. The following section discusses key points from
this article while providing an overview of measurement er-
ror assessment and correction in nutritional epidemiology.
Nutritional epidemiology has advanced considerably over
the last 50 y with respect to understanding types and sources
of measurement error in dietary intake data (7, 14). An
insufficient appreciation of this can lead to erroneous con-
clusions like those of Archer et al. (3). Because of the con-
siderable day-to-day variation in dietary intake among
individuals, a single recall, as was used by Archer et al. in
their analysis, will tend to capture extremes of dietary intake
as opposed to usual current intake, increasing the likelihood
that any individual’s single recall will be implausibly high or
low. This random variation adds noise to the data, overesti-
mating the variance, and flattening the distribution, thereby
increasing the numbers of individuals in the extremes of the
distribution. Thus, repeated 24-h recalls on nonconsecutive
days are recommended to reduce within-person error. More
epidemiologic studies that use 24-h recalls to assess diet now
obtain multiple replicate measures on each participant, and
starting in 2002, a second 24-h recall was introduced in the
NHANES to address some of these issues (8).
However, as noted earlier, error in diet assessment need
not be completely random. Systematic sources of variation
include omission of foods consumed by individuals, errors
in estimating portion sizes, and over- or under-reporting
TABLE 1 Comparison of diet assessment methods
Several day/week
diet records Multiple 24-h recalls A single 24-h recall Validated
FFQ Biomarkers
Advantages Provides accurate, de-
tailed, open-ended
data on dietary in-
take, with no reliance
on memory, and di-
rect computation of
portion sizes.
Provides fairly accurate,
detailed, open-
ended data on die-
tary intake, without
reliance on long-
term memory.
Provides detailed,
open-ended data on
dietary intake, with-
out reliance on long-
term memory.
Provides time-inte-
grated data that rep-
resents usual long-
term intake. Can as-
sess past dietary
intake.
Provides an objective
assessment of intake.
Represents bioavail-
able dose, which is
relevant when it is
used in etiologic
analyses.
Errors from omission,
portion size estima-
tion, and recall are
least likely.
Has lower respondent
burden and is less
expensive than diet
records, and works
well in low-literacy
contexts.
Has lower respondent
burden and is less
expensive than diet
records and multiple
recalls; works in low-
literacy contexts.
The least expensive and
most easily adminis-
tered diet assess-
ment method, with
the lowest respon-
dent burden.
May be available in ret-
rospect (analysis of
stored specimens).
Disadvantages Needs literate, moti-
vated participants;
participant burden is
very high when done
over several days.
Could also alter usual
eating habits.
There is scope for short-
term recall error,
omissions, and errors
in portion size
estimation.
There is scope for short-
term recall error,
omissions, and errors
in portion size esti-
mation. Has high
random within-per-
son error.
There is scope for long-
term recall error.
Omissions possible
because of fixed-
food list.
FFQs need to be cul-
ture- and population-
specific.
Biomarker may not be
sensitive to intake,
may have low speci-
ficity, may not be
time-integrated, may
not represent usual
long-term intake, and
is subject to labora-
tory errors and other
sources of bias.
Expensive and re-
source-intensive diet
assessment method.
Potential for errors in
nutrient estimation
from food composi-
tion tables.
Has high interviewer
burden and is more
expensive than a
single recall and
FFQs.
Potential for errors in
nutrient estimation
from food composi-
tion tables.
Has high interviewer
burden and is more
expensive than FFQs.
Potential for errors in
nutrient estimation
from food composi-
tion tables.
Semi-quantitative.
Potential for errors in
nutrient estimation
from food composi-
tion tables.
Expensive and more in-
vasive. Biomarkers
are not available for
many nutrients.
Applications Validation of other diet
assessment methods.
Validation of other diet
assessment methods.
National surveillance of
mean population
intake.
Association analyses in
large epidemiologic
studies.
Validation of other diet
assessment methods.
Monitoring compliance
in dietary interven-
tion trials.
Monitoring compliance
in dietary interven-
tion trials.
Assessment of trends
in dietary intake
(current NHANES).
Assessment of trends in
dietary intake (earlier
NHANES).
Assessing past dietary
intake.
Association analyses in
epidemiologic stud-
ies and monitoring
compliance in inter-
vention trials
Understanding nutritional epidemiology 7
a
t F
O
R
T
V
A
L
L
E
Y
S
T
A
T
E
U
N
IV
E
R
S
IT
Y
o
n
Ja
n
u
a
ry 9
, 2
0
1
8
a
d
va
n
ce
s.n
u
tritio
n
.o
rg
D
o
w
n
lo
a
d
e
d
fro
m
http://advances.nutrition.org/
because of social approval (respond in certain ways to get so-
cial praise) or social desirability (respond in certain ways
avoid social criticism) (15–17). All of these could have led
to the under-reporting of energy intake observed by Archer
et al. The underestimation of energy intake from self-
reported data has long been known to nutrition researchers,
and many strides in methodology have been made to reduce
this source of measurement error (7, 18–22). Under-reporting
because of omission or portion size estimation errors is un-
likely to be differential with respect to determinants of the
outcome of interest. In addition, there have been improve-
ments in 24-h recall methodology that reduce these sources
of error, such as the USDA 5-pass method (8), which is
structured to minimize omission of foods and to help partic-
ipants report accurate portion sizes by using visual aids. This
5-pass method, which was introduced into the NHANES
starting in 2002, was found to agree reasonably well with ac-
tual intake assessed by direct observation (r = 0.57, P < 0.05)
(23), as well as with energy intake as assessed by the DLW
technique (r = 0.32 for males; r = 0.25 for females), which
is considered the gold standard for energy intake assessment
(provided body compartment masses such as fat mass and
water mass are stable over time because DLW is a measure
of energy expenditure), although the DLW technique has er-
rors of its own (8). Another solution is to use an isocaloric
statistical model in analysis, i.e., adjust for total energy in-
take. In analytic epidemiology we are generally less inter-
ested in the association of absolute energy/macronutrient
intake with health outcomes, and more with how dietary
composition relates to risk of disease because this is what
is most modifiable by individuals or populations. Hence, ad-
justing for energy intake is standard practice in nutritional
epidemiology. Adjusting for energy intake also diminishes
extraneous sources of variation in dietary intake, and to
some extent also reduces systematic sources of under- and
over-reporting (7, 21, 22). Issues related to measurement
error are not isolated to dietary assessment methods, but
extend to assessment of most behavioral exposures and bio-
markers, including physical activity (24, 25), with which Ar-
cher and colleagues, having worked considerably in the area
of physical activity epidemiology, are familiar (26, 27).
Hence, although there is no perfect method, there is am-
ple evidence that dietary measurements in national surveys
have reasonably good reliability and validity. The conclusion
of Archer et al. that dietary data with use of these methods
cannot support public policy is misleading. National survey
data such as the NHANES represent a small fraction of the
totality of evidence on the basis of which national guidelines
and public policy are made. A main purpose of using na-
tional survey data is to assess average population intakes
and trends. For example, we recently examined trends in di-
etary quality from 1999 to 2010 in the US adult population
among a nationally representative sample of 29,124 adults
aged 20–85 y with use of the NHANES data (28). We found
that better dietary quality, measured by the Alternate
Healthy Eating Index, was associated with higher socioeco-
nomic status, and the gap between the rich and the poor
widened with time. These data underscore the importance
of developing nutritional policies to improve diet quality
and reduce health disparities.
Because of its low cost and low participant burden, self-
administered computer-processed FFQs are the only option
in most large cohort studies to assess usual dietary intakes.
FFQs usually have lower random within-person variation
than other dietary assessment methods because they are de-
signed to assess average usual intake over the past year. For
this reason, they are better equipped to assess long-term di-
etary intake, the exposure of etiologic interest for most dis-
eases (7). Because of their reliance on memory, FFQs may
suffer from greater measurement error relative to recalls
and records if these methods are used for many days to re-
flect longer-term intakes (for certain nutrients, just a few
days of diet records or recalls might be enough, provided
the days are spread out over the entire reference period of
the FFQ). Nevertheless, FFQs have been shown to have ac-
ceptable validity when compared to reference measures
(29, 30), with typical correlation coefficients for individual
nutrients or foods ranging from 0.4 to 0.7 (7). Adjustment
for total energy intake, along with use of repeated FFQs in
long-term prospective cohort studies, further improves
these validity coefficients. Although extended dietary rec-
ords are the most popular reference method, when bio-
markers are available, triangulation methods can be used
to obtain improved estimates of correlations of FFQ intake
with true intake (31). These validity coefficients can be
used to correct for measurement error in epidemiologic
analyses, and the application of these measurement error
correction methods is increasingly being extended to more
complicated analyses (18–20). These techniques have al-
lowed for valid inferences to be drawn from large cohort
studies with use of FFQ data.
Despite these developments in reducing measurement er-
ror in dietary intake data, continued improvements in dietary
assessment methodology and measurement error correction
are needed to advance the field. Nevertheless, the consider-
able progress made over the past few decades, especially the
use of repeated measures of diet over time, has enabled nu-
tritional epidemiologists to reliably collect and use dietary in-
formation in both individuals and populations.
What Is the Role of Nutritional Epidemiology in
Inferring Causality?
One of the main criticisms leveled against nutritional epide-
miology is that it relies predominantly on observational
data, which is deemed to be inferior to experimental data
in determining causality. Figure 1 illustrates the typical hier-
archy of evidence from various study designs. While ran-
domized trials with hard endpoints occupy the highest
position in this hierarchy, they are usually not the most ap-
propriate or feasible study design to answer nutritional epi-
demiologic questions regarding long-term effects of specific
foods or nutrients (unless they can be packaged in a pill).
In the absence of evidence from large RCTs on hard
endpoints, nutritional epidemiologists typically rely on
8 Satija et al.
a
t F
O
R
T
V
A
L
L
E
Y
S
T
A
T
E
U
N
IV
E
R
S
IT
Y
o
n
Ja
n
u
a
ry 9
, 2
0
1
8
a
d
va
n
ce
s.n
u
tritio
n
.o
rg
D
o
w
n
lo
a
d
e
d
fro
m
http://advances.nutrition.org/
prospective cohort studies, the strongest observational study
design in terms of minimizing bias and inferring causality.
Being prospective in nature, they are less affected by several
biases, such as reverse causation, recall bias, and selection
bias, which commonly plague retrospective or cross-
sectional study designs. Reverse causation describes the sit-
uation in which the outcome affects the exposure, rather
than the other way around. This is a common concern
with cross-sectional studies and retrospective case-control
studies because they assess exposure and outcome at the
same time. Prospective cohort studies can minimize the pos-
sibility of reverse causation by apparent disease because par-
ticipants are followed forward in time, and these studies can
examine the extent of reverse causation from subclinical dis-
ease by lagged analyses. They are superior to retrospective
case-control studies because the issues of selection bias (con-
trols not being representative of the underlying population
that gave rise to cases) and recall bias (knowledge of disease
status affecting recall of diet) can be largely minimized be-
cause prospective cohort studies begin with a disease-free
population at baseline that is followed up to ascertain inci-
dent cases that develop over time. This is evident from the
fact that spurious links between total energy intake and co-
lon cancer (32), and fats and breast cancer (33), which were
reported in case-control studies, have not been replicated in
large prospective cohort studies.
A major challenge when working with any kind of obser-
vational data is confounding. A confounder is a variable that
is associated with both the exposure and outcome but is not
caused by either, and when unaccounted for, introduces bias
into the exposure-disease relation. The main reason why
randomized trials are considered superior in inferring cau-
sality is that randomly assigning participants to treatment
groups nullifies all sources of measured and unmeasured
confounding, provided the sample size is large enough. To
account for this type of bias in an observational study design
such as a prospective cohort study, researchers must rely on
their content knowledge to identify and adjust for all rele-
vant confounders. Once data have been collected on these
variables, the investigator can statistically adjust for con-
founders in a regression model or restrict the data to a
specific subgroup to minimize residual confounding. A
well-conducted cohort study can simulate a randomized trial
when the most relevant confounders are accounted for (34).
Sensitivity analysis further strengthens results by delineating
the magnitude of unmeasured confounding needed to com-
pletely neutralize an effect. Moreover, a prospective design al-
lows for up-to-date tracking of confounders and diminishes
the threat of residual confounding because updated informa-
tion may reduce measurement error in assessment of con-
founders, and additional information on confounders can
be collected when needed.
Although there are several ways in which confounding
can be accounted for in prospective cohort studies, the crit-
ical assumption of “no unmeasured or residual confound-
ing” that is needed to infer causality cannot be empirically
verified in observational epidemiology (34). For this reason,
prospective cohort studies are often seen as providing sta-
tistical associations but not causations. This can be a
dangerous premise to blindly adhere to, especially when ran-
domized trials of hard endpoints are not feasible and policy
decisions have to be made based on existing evidence. In this
scenario, the Hill criteria, published in 1965 by Sir Austin
Bradford Hill, are useful in inferring causality from observa-
tional data and making timely policy decisions that could
avert preventable morbidity and mortality in the population
(35). In his classic paper, Hill outlined a checklist of several
key conditions for establishing causality: strength, consis-
tency, temporality, biological gradient (dose-response),
plausibility, coherence, and experimental evidence. These
criteria have been satisfied in several exposure-disease rela-
tions such as sugar-sweetened beverages (SSBs) and diabetes
(36), whole grains and cardiovascular disease (CVD) (37),
and trans fats and CVD (38), which has resulted in timely
public health action to reduce the burden of these diseases
in the United States.
Given the complex nature of the human diet, another
way of inferring causality is to consider different types of ex-
posure (i.e., dietary patterns, foods, nutrients, and bio-
markers) simultaneously (39, 40). For example, adherence
to the Mediterranean-style diet has been known to confer
a cardioprotective effect in observational studies and RCTs
(41). Staples of the Mediterranean-style diet such as fish,
nuts, olive oil, fruits, and vegetables have been individually
linked to lower risk of heart disease (42–44). Reviews of ma-
jor nutrients abundant in these foods, such as unsaturated
fats and polyphenols, have confirmed this finding as well
(45, 46), as have studies of related biomarkers (47, 48).
Such a convergence among studies provides convincing sup-
port for adoption of the Mediterranean-style diet in preven-
tion of CVD.
In the study of nutrition and health, prospective cohort
studies aren’t the only sources of data used when considering
causality. Evidence from animal studies, mechanistic studies
in humans, prospective cohort studies of hard endpoints,
and randomized trials of intermediate outcomes are taken
FIGURE 1 Hierarchy of study designs in nutritional
epidemiology. RCT, randomized controlled trial.
Understanding nutritional epidemiology 9
a
t F
O
R
T
V
A
L
L
E
Y
S
T
A
T
E
U
N
IV
E
R
S
IT
Y
o
n
Ja
n
u
a
ry 9
, 2
0
1
8
a
d
va
n
ce
s.n
u
tritio
n
.o
rg
D
o
w
n
lo
a
d
e
d
fro
m
http://advances.nutrition.org/
together to arrive at a consensus. The inference of causal-
ity is strengthened when these different types of studies
provide consistent evidence. For example, a meta-analysis
of randomized trials of trans fat intake has shown harm-
ful effects of higher intake on intermediate endpoints,
such as increased LDL cholesterol and reduced HDL cho-
lesterol (49). Based on observational studies, there is a
significant and robust association between higher intake
of trans fat and increased risk of ischemic heart disease
(IHD) (49). Taken together, these studies forge a strong
case for the harmful effects of trans fat consumption on
heart disease. The most important aspect of this approach
is that it discourages viewing individual studies and mea-
sures of association in isolation and encourages interpret-
ing them in context of the larger evidence base.
Well-conducted prospective cohort studies thus can be
used to infer causality with a high degree of certainty
when randomized trials of hard endpoints are impractical.
Researchers can minimize bias from confounding and other
sources of bias by relying on high-quality study design, care-
ful statistical analysis and interpretation, and replications of
the findings across different populations. The Hill criteria
are a useful tool for establishing causality in the absence of
large RCTs on hard endpoints, and corroborating data
from multiple study types and populations can enhance
the weight of evidence.
Is the Drug Trial Paradigm Relevant in
Investigating Diet and Disease Relationships?
Some researchers consider RCTs as the be-all and end-all of
causal inference (2). This sentiment may be appropriate in
the pharmaceutical industry, but the drug trial paradigm
cannot be readily translated for use in the nutritional sci-
ences. Table 2 summarizes the differences between observa-
tional prospective cohort studies and RCTs, and Table 3
outlines the differences between RCTs in pharmaceutical
and nutritional research. Unlike classic drug trials, RCTs of
dietary interventions typically cannot be blinded, leading
to the possibility that the effect of the intervention is due
to knowledge of treatment assignment as opposed to the di-
etary component of the intervention. Dropout rates also
tend to be higher in RCTs of nutritional interventions
relative to those in drug trials, especially if the intervention
is implemented for long periods or is very demanding or
both. Dietary interventions to promote weight loss routinely
have dropout rates of 30–40% even after just 1 y of follow-
up (50, 51). Such dropout, when substantial, will reduce an-
alytical power in the presence of random loss to follow-up.
However, it can also introduce systematic bias in the effect
estimate, usually in unpredictable directions, if the dropout
is differential with respect to treatment and outcome (52).
Another problem faced to a greater extent in nutritional
RCTs relative to drug trials is noncompliance, i.e., insuffi-
cient adherence by participants to their assigned interven-
tion. Such noncompliance may become severe in trials of
longer duration. For example, over 8 y of follow-up in the
Women’s Health Initiative (WHI), the most expensive hu-
man study ever conducted, most of the participants ran-
domly assigned to the low-fat group were unable to
achieve their fat reduction target of 20% (53). Moreover,
during the trial, there were no differences between the
low-fat and control groups in plasma concentrations of
HDL cholesterol and triglycerides, which are known to
change on low-fat diets (53). The WHI, hence, failed to
test its original hypothesis, and its null findings were largely
uninformative with respect to the causal effect of a low-fat
dietary intervention. A similar fate afflicted the earlier Mul-
tiple Risk Factor Intervention Trial, in which reduction of
serum cholesterol by dietary means failed to produce a sub-
stantial contrast between intervention and control groups
and thus no significant difference in CVD was seen (54).
Randomized trials of nutritional interventions, although
free from confounding and selection bias at baseline, can
suffer from similar biases postbaseline that we often observe
in observational studies, especially when they are of long du-
ration, complicating their interpretation and diminishing
their utility above prospective cohort studies. An additional
issue with trials that last for extended periods of time is that
they risk becoming obsolete. During the early 1990s, the
WHI was set up to test the prevailing theory that reduced
fat intake would decrease breast cancer and CVD risk. How-
ever, during the course of the trial, clinical and epidemio-
logic evidence that had accumulated to support greater
importance of types of fat over total fat substantially
TABLE 2 Prospective cohort studies vs. RCTs of foods and
nutrients1
Design criterion Prospective cohort study RCT
Study characteristics
Size Variable, usually fairly large Usually small
Follow-up time Years and decades Weeks, months, a couple of
years
Dietary exposure Naturally occurring distributions Specific
predefined intervention and control
Endpoint Mortality, incident disease, intermediate outcomes
Disease prognosis and management, intermediate outcomes
Sources of bias
Confounding Residual and/or unmeasured confounding possible
No confounding if groups are balanced
Selection bias Possible because of differential dropout Possible
because of differential dropout
Measurement error Possible because of error in diet assessment
methods Possible because of incomplete compliance
Generalizability Potential for high generalizability Usually
fairly limited
Feasibility Usually more feasible Feasibility limited by costs
and ethical constraints
1 RCT, randomized controlled trial.
10 Satija et al.
a
t F
O
R
T
V
A
L
L
E
Y
S
T
A
T
E
U
N
IV
E
R
S
IT
Y
o
n
Ja
n
u
a
ry 9
, 2
0
1
8
a
d
va
n
ce
s.n
u
tritio
n
.o
rg
D
o
w
n
lo
a
d
e
d
fro
m
http://advances.nutrition.org/
weakened the original rationale, especially with respect to
CVD (55).
The choice of a control group can also be more compli-
cated in nutritional intervention trials relative to drug trials
because the latter are usually placebo-controlled, which is
rarely a possibility in the former because of ethical consider-
ations. Thus, the intervention and control groups are differ-
entiated in terms of the dose of a nutrient (“high” vs. “low”),
and the definition of these doses is also usually determined
by ethical constraints. For instance, it may not be ethically
feasible to give a very low dose to, or introduce deficiency
in, the control group. One way of circumventing this is to
conduct a trial in a naturally deficient population by provid-
ing supplementation to the intervention group. Even in this
instance, it is not ethically feasible to provide the control
group with just a placebo, and a minimum level of supple-
mentation in the control group is usually necessary. This
could result in too narrow a contrast in nutrient intake be-
tween the control and intervention groups, undermining the
trial’s ability to identify a true effect of the nutrient.
Another factor further complicating the choice of a con-
trol group is that nutrients and foods are not consumed in
isolation, and decreasing the intake of one nutrient/food
usually entails increasing the intake of another nutrient/
food to make up the reduction in calories in isocaloric trials
(e.g., a reduction in dietary fat is often accompanied by a
compensatory increase in carbohydrate intake or vice versa).
Thus, the choice of comparison group can influence the ef-
fect observed of a dietary intervention, further complicating
the interpretation of dietary intervention trials.
The utility of the drug trial paradigm in nutritional epi-
demiology is further diminished by the fact that the human
diet is a complex system, not amenable to the reductionist
approach of isolating individual nutrients or compounds
(56). Although drugs usually target a single system/pathway
in the pathology of disease, nutrients are usually pan-systemic,
influencing multiple systems and affecting disease risk
through multiple pathways. Unlike drugs, which are de-
signed to have large and targeted effects on individual path-
ways that play out in relatively short periods of time,
individual nutrients usually have modest effects that interact
with and aggregate across multiple nutrients and systems
over long periods of time to cumulatively affect disease
risk. In drug trials, other drugs with known interactions
are excluded or controlled for in some manner; in nutri-
tional intervention trials, synergies and antagonisms with
other nutrients and drugs are usually not given adequate
consideration. High-dose vitamin and antioxidant trials
mimic drug trials that examine the effect of isolated com-
pounds, but these findings have been largely negative (57),
which could be explained in part by the inappropriate use
of the linear drug trial paradigm, which fails to take into ac-
count the complex, interconnected nature of the dietary “ex-
posome” (58).
Well-conducted RCTs and observational studies that an-
swer similar questions tend to find consistent results (59).
However, when RCTs contradict the findings of observa-
tional studies, there is a tendency for the academic commu-
nity to believe that RCTs conclusively refute the hypotheses
generated by such observational studies. Although this is a
possibility, an equally, and sometimes more likely, possibility
is that the RCTand observational studies are answering very
different questions. For example, an observational study
might answer the question “are some persons in a popula-
tion at increased risk because of low intake of nutrient
X?,” whereas an RCT might answer the question “does add-
ing more nutrient X to the whole population reduce risk?”
In this example, the latter would not necessarily refute the
former. In fields like nutritional and chronic disease epide-
miology, RCTs typically cannot answer the questions that
observational cohorts do answer. RCTs tend to have several
exclusion criteria, and with diseases like CVD as the out-
come, tend to be carried out in high-risk populations. Ob-
servational studies tend to be more inclusive and hence
more representative of the general population. Additionally,
although observational studies can evaluate any exposure
contrast that is observed, RCTs usually examine a narrow ex-
posure distribution that is feasible within ethical and practi-
cal constraints.
Owing to these limitations, most randomized trials are
small (<200 subjects) and test for intermediate endpoints.
One exception is Prevención con Dieta Mediterránea (60).
In this landmark trial, the investigators tested for primary
CVD events in 7447 men and women. After a median fol-
low-up of 4.8 y, a Mediterranean diet was superior to a
low-fat diet in reducing CVD incidence. It should be noted
that the Prevención con Dieta Mediterránea was built on
prior observational evidence from both ecologic and pro-
spective cohort data that supported the benefits of the Med-
iterranean diet. Furthermore, the investigators provided free
foods to its participants to ensure high compliance, a crea-
tive but often infeasible strategy in large nutritional inter-
vention trials. Thus, it is important to remember that
although large, well-designed RCTs are desirable when
TABLE 3 RCTs of nutrients or foods vs. drugs1
Design criterion RCTs of nutrients or foods RCTs of drugs
Exposure Complex, interacting network of foods/nutrients
Individual, isolated chemical compounds
Choice of control Variable, dependent on prior studies,
feasibility, and ethicality Placebo
Endpoint Disease prognosis and management, intermediate
outcomes Clinical events, adverse events
Dropout rate Moderate to high depending on length and type of
intervention Low to moderate
Blinding Not possible with foods and dietary patterns Easy
Compliance Often decreases substantially over long period of
follow-up High to moderate over follow-up
1 RCT, randomized controlled trial.
Understanding nutritional epidemiology 11
a
t F
O
R
T
V
A
L
L
E
Y
S
T
A
T
E
U
N
IV
E
R
S
IT
Y
o
n
Ja
n
u
a
ry 9
, 2
0
1
8
a
d
va
n
ce
s.n
u
tritio
n
.o
rg
D
o
w
n
lo
a
d
e
d
fro
m
http://advances.nutrition.org/
feasible, the field of nutritional epidemiology cannot solely
depend on them, especially when testing individual compo-
nents of a dietary pattern. A large dietary intervention study,
carried out with use of considerable funds, and over many
years, tends to address only one question and only one expo-
sure contrast within that question. Hence, the question that
it answers needs to be carefully thought through because not
examining the most etiologically relevant range of the expo-
sure distribution will lead to potentially misleading results.
Arriving at the right question to pose with use of an RCT
needs valid observational data. The two, thus, go hand-in-
hand, with their strengths and limitations complementing
each other.
For these reasons, the drug trial paradigm is usually not
appropriate for investigating diet and disease relations and,
when attempted, can lead to misleading results. Instead, a
holistic research approach is likely to be more informative
(61). A reductionist view that one compound brings about
one physiologic effect ignores the intricacies of physiologic
interactions. Foods cannot be treated as drugs, and a broader
biological perspective will be necessary to effectively address
nutritional questions in the future. Finally, nutritional epi-
demiology is not the only field where RCTs can be mislead-
ing. Although few would now question the benefits of
smoking cessation, RCTs examining this issue have found
no effect on mortality, probably because of recidivism and
insufficient follow-up time (62). This is sobering consider-
ing that smoking is one of the most powerful risk factors
known, and diet and other behaviorally related risk factors
such as physical activity tend to have more subtle effects
on disease outcomes.
Can We Trust the Findings from Meta-Analyses
and Systematic Reviews of Nutritional
Epidemiologic Studies?
Systematic reviews and meta-analyses have been instrumen-
tal in advancing the field and informing policy. Because
meta-analyses and systematic reviews synthesize aggregate
data, they are regarded by some to be the most authoritative
form of available evidence (63, 64). Although they can be ex-
tremely useful in summarizing relevant literature, they are
not immune to limitations. Publication bias, the tendency
for null findings to remain unpublished, is a common diffi-
culty in such analyses, although Egger’s test (65) and trim-
and-fill techniques (66) can be used to detect and correct
for bias. Substantial between-study heterogeneity (e.g., dif-
ferent exposures, outcomes, study populations, etc.) pre-
sents another major obstacle to pooling and interpreting
effect estimates, although the presence of statistical hetero-
geneity does not necessarily invalidate the pooled results.
Several methods have been devised to deal with this prob-
lem. First, if heterogeneity (e.g., varying methods for out-
come ascertainment across studies) is so severe such that a
statistical synthesis of effect estimates is meaningless, then
a systematic review and qualitative description of study re-
sults is more appropriate. Second, one may choose to subset
studies by specific characteristics (e.g., cohorts consisting
only of women and only of men) to explore sources of het-
erogeneity. Third, one can use a random-effects model
rather than a fixed-effects model, which assumes that re-
ported effect estimates do not converge on the same value
(67). However, this solution introduces another complica-
tion. Random-effects models tend to give more weight to
and thus exaggerate the importance of smaller studies, lead-
ing to potentially distorted pooled-effect estimates and
wider CIs. Lastly, a meta-analysis is only as good as the stud-
ies it pools together. If the methodologic quality of included
studies is low, the meta-analysis can result in a misleading
pooled effect estimate. Thus, it is important to give adequate
consideration to the quality of included studies and either
exclude lower-quality studies from the analysis or report
pooled effects separately for higher-quality studies, and dis-
cuss the impact of study quality on the pooled results.
One must exercise care when interpreting a systematic re-
view or meta-analysis in nutritional epidemiology. The
number of systematic reviews and meta-analyses has ex-
ploded in recent years. A search on PubMed for “systematic
review” and “meta-analysis” retrieves 4374 hits published
from 2000 to 2004, 11,597 hits from 2005 to 2009, and
21,420 hits from 2010 to 2014. The rush to fill in gaps in
the literature has also led to sloppy reviews that would ben-
efit from a more thorough evaluation. Furthermore, because
a review does not require original data, anyone could poten-
tially write one; unlike the conduct of original studies, for
which the qualifications of the investigators and the research
plan are carefully vetted in the funding process. Too often,
articles appear to have been pushed to publication by
authors who do not fully appreciate the complexity of the
subject. Lack of content knowledge and insufficient under-
standing of underlying biological mechanisms can lead to
incomplete literature searches, flawed analytic methods,
and misleading conclusions.
Some of the methodologic problems were evident in a re-
cent meta-analysis of BMI and mortality, which concluded
that being overweight lowers the risk of all-cause mortality
than being normal weight (4). However, this finding is at
least partly explained by reverse causation because individ-
uals with existing or even preclinical chronic diseases such
as cancer and neurodegenerative diseases often experience
weight loss long before death (68, 69). Excluding sick indi-
viduals (70) or deaths from the first several years of follow-
up (71) yields reasonably unbiased estimates that confirm a
BMI range of 22–24.9 kg/m2 as having the lowest rates of all-
cause mortality. The BMI-mortality analyses were also se-
verely distorted by smoking, which is strongly associated
with death but lower body weight (72), and restriction of
analysis to never-smokers shifts the point of lowest mortality
to the normal weight range (73).
Another example is a recent meta-analysis that concluded
that types of fat including saturated or polyunsaturated fats
have no substantial impact on heart disease, a conclusion
stemming in part from an inadequate understanding of nu-
tritional epidemiologic methods (5). It has been long known
in clinical nutrition and nutritional epidemiology that, when
12 Satija et al.
a
t F
O
R
T
V
A
L
L
E
Y
S
T
A
T
E
U
N
IV
E
R
S
IT
Y
o
n
Ja
n
u
a
ry 9
, 2
0
1
8
a
d
va
n
ce
s.n
u
tritio
n
.o
rg
D
o
w
n
lo
a
d
e
d
fro
m
http://advances.nutrition.org/
examining the effects of macronutrients in an isocaloric
manner, one must be cognizant of which other macronutri-
ent is replacing the one in question. In the example of satu-
rated fat, assuming diets are isocaloric, a diet high in
saturated fats must be replacing another nutrient to main-
tain the same energy intake. At the population level, most
of an individual’s energy is derived from carbohydrates
(74, 75), which implies that those who consume high
amounts of saturated fats are most likely replacing carbohy-
drates. Substituting carbohydrates for saturated fats, how-
ever, does not substantially alter the risk of heart disease
(76). Refined carbohydrates, in particular, may be more
harmful than saturated fats in terms of metabolic effects
(77). However, substituting polyunsaturated fats for satu-
rated fats substantially decreases the incidence of heart dis-
ease (76). The conclusion, therefore, should not be that
saturated fat has no impact on heart disease, but that satu-
rated fat is not substantially better or worse than carbohy-
drates at reducing heart disease.
Thus, although systematic reviews and meta-analyses are
useful tools for summarizing a large body of evidence, it is
important to recognize their limitations, give adequate con-
sideration to sources of heterogeneity or bias, and consider
their conclusions in the context of other relevant literature.
What Is the Role of Nutritional Epidemiologic
Studies in Developing Policies?
In quality rating the strength of evidence, national organiza-
tions such as the American Diabetes Association, AHA,
American College of Cardiology, US Preventive Services
Task Force, and FDA have used well-defined grading systems
to assign the weight of evidence to particular study types
(78–81). Properly conducted RCTs with disease endpoints
occupy the top tier of evidence in most scales, and prospec-
tive cohort studies reside one level below RCTs. In the ab-
sence of large RCTs with disease endpoints, evidence from
prospective cohort studies in conjunction with smaller
RCTs with intermediate endpoints is often considered in
substantiating nutritional claims or establishing policies.
For instance, the USDA/US Department of Health and Hu-
man Services Dietary Guideline Advisory Committee has
used evidence from prospective cohort studies extensively,
in addition to evidence from RCTs, to evaluate the relations
between specific dietary factors and chronic disease risk
(82), which forms one of the foundations for making dietary
recommendations for the US population. Three examples
of epidemiologic data affecting policy change are discussed
below.
Folate was first identified as an important nutrient in pre-
venting neural tube defects (NTDs), such as anencephaly
and spina bifida, based on observational data from the
United Kingdom in the 1970s (83). Subsequent case-control
studies in the 1980s suggested that women who supple-
mented with folate before pregnancy had a reduced risk of
giving birth to infants with NTDs than those who did not
(84–87). Only 1 prospective cohort study was conducted
at this time, and the results also supported a strong
protective effect of periconceptual folate supplementation
(88). Observational studies examining blood folate concen-
trations (89) and randomized trials of folate supplementa-
tion (90, 91) confirmed this association. Calls began for
government action with commentators proposing several
strategies including the promotion of increased fruit and
vegetable consumption, recommendation of supplementa-
tion to reproductive-aged women, and fortification (92–
95). In 1996, the FDA authorized the enrichment of grain
products with folate at the rate of 0.14 mg per 100-g flour,
with mandatory compliance by 1998. Fortification had a
dramatic effect, leading to a 19% reduction in incident
NTDs in just 5 y (96).
Numerous reports have linked SSBs, which include soda,
sports drinks, and sweetened juices, with obesity (97, 98),
type 2 diabetes (99), and heart disease (100). In addition,
2 large and rigorously conducted RCTs provided convincing
evidence that decreasing consumption of SSBs substantially
reduces excess weight gain and obesity in children and ado-
lescents (101, 102). Calls have been made for policies to re-
duce consumption of SSBs. In the United States, one
popular proposal has been an excise tax on SSBs. Brownell
and colleagues (103) estimate that an increase of 1 cent
per ounce would lead to a minimum intake reduction of
10%. Such a tax would not only discourage unhealthy diet,
it would also generate revenue and offset health care costs
incurred by chronic diseases associated with refined sugar
intake (104). In 2013 Mexico approved a 1 peso per liter
tax on SSBs (105), and sales volumes for SSBs fell by 5%
in early 2014 (106). That same year, Mayor Michael Bloom-
berg led efforts to instate a size limit of 16 oz. on soft drinks
sold in New York City. The proposal was passed by the city
but was later struck down by the state supreme court (107).
Other cities such as San Francisco have proposed excise taxes
on SSBs, but opposition from soda and sugar lobbyists re-
mains stiff. Nevertheless, certain developments, such as
the removal of SSBs from most schools in the United States
(108) and a ban on their sale in all public buildings in Bos-
ton (109), reflect major steps in reducing consumption of
SSBs.
A highly successful example of nutritional epidemiology
affecting policy is that of trans FAs (TFAs). TFAs were first
developed to stabilize vegetable fat at room temperature
and quickly became popular in food manufacturing pro-
cesses in the early 20th century. Ancel Keys speculated that
TFAs were associated with heart disease in the 1950s (110,
111), but it wasn’t until the 1990s that experimental evi-
dence suggested that TFAs both increase LDL cholesterol
and decrease HDL cholesterol (112). Subsequent epidemio-
logic evidence from the Nurses’ Health Study corroborated
this link (113). As more evidence mounted, scientists called
for a reduction of TFAs in foods (114), and in 2003, the FDA
approved a proposal for manufacturers to list TFAs in the
nutrition facts label of foods (115). In 2006 a meta-analysis
of observational studies estimated that replacing 2% of en-
ergy from carbohydrates with the same amount of energy
from TFAs would result in a 29% (95% CI: 11%, 49%)
Understanding nutritional epidemiology 13
a
t F
O
R
T
V
A
L
L
E
Y
S
T
A
T
E
U
N
IV
E
R
S
IT
Y
o
n
Ja
n
u
a
ry 9
, 2
0
1
8
a
d
va
n
ce
s.n
u
tritio
n
.o
rg
D
o
w
n
lo
a
d
e
d
fro
m
http://advances.nutrition.org/
increase in IHD risk (116). A follow-up review combined
both observational and experimental findings and provided
convincing evidence of a causal link between TFAs and IHD
(38). New York City and other city and state governments
have banned use of trans fats in restaurants and schools
(117). It is now estimated that ~72% of trans fats have
been removed from the US food supply (118), and as ex-
pected, blood lipids have improved in both children and
adults (119). In a recent analysis within New York State,
rates of IHD declined faster in municipalities that banned
trans fat than in those that did not, and it is estimated
that this prevented between 518 and 1037 deaths from
IHD per year in New York State (120). It is estimated that
a nationwide trans fat ban, by removing the remaining par-
tially hydrogenated fats, would prevent between 6480 and
12,960 deaths from IHD annually in the United States
(120). In 2013 the FDA took preliminary steps to phase
out TFAs altogether by deeming them as not generally rec-
ognized as safe (121).
These 3 examples recount changes in public policies in
the face of mounting evidence from multiple lines of re-
search, and well-conducted observational studies have
played a major role in shaping the policies. However, re-
search is a slow and evolving process, and consensus is
hard to achieve within a short timeframe. For substances
that have shown potential harmful effects, even in the ab-
sence of conclusive evidence, public health experts have
sometimes appealed to the precautionary principle to ad-
dress the concern. The principle states that when only lim-
ited evidence is available, a substance is presumed to be
harmful and the burden of proof falls upon the scientific
community or the industry to demonstrate that the sub-
stance is safe. Observational data are especially important
in this regard because they often present the first reports
of negative health outcomes associated with certain dietary
or other environmental exposures. They are also usually
the first to show lack of hypothesized harm, e.g., in the cases
of total fat in the diet and v-6 FA intake, and thus can play a
key role in resolving ongoing controversies (45, 122).
Conclusions
Nutritional epidemiology is far from being a perfect science,
but with a thorough understanding of the discipline, valuable
insights on diet and health outcomes can be obtained from
free-living populations. Use of repeated measures and vali-
dated FFQs is critical for the assessment of long-term dietary
intake. Although measurement error is a key problem, careful
study design and meticulously developed dietary assessment
tools coupled with specific biomarkers and informed statisti-
cal analysis can reduce its impact. Well-conducted RCTs can
eliminate confounding and selection bias at baseline and are
hence considered the highest level of evidence to infer causal-
ity; however, the linear drug trial paradigm cannot be directly
translated into nutritional research, in which change in one
dietary component is typically accompanied by compensatory
change in another component, and good compliance is often
difficult to achieve in long-term studies. Thus, prospective co-
hort studies, which are considered the strongest observational
study design when well designed, are an irreplaceable compo-
nent of nutritional research. Evidence from several types of
studies, in particular prospective cohort studies of hard clin-
ical endpoints and intervention trials of intermediate out-
comes, in totality can be used to infer causality and inform
policy. Summarizing this evidence in systematic reviews and
meta-analyses can be especially helpful in understanding
a vast evidence base and informing policy. However, meta-
analyses and systematic reviews should be conducted with
caution and interpreted in light of the broader context of
the field.
Although the future of nutritional epidemiology is bright,
with large ongoing international cohorts around the world
[e.g., EPIC (123) and UK Biobank (124)] collecting detailed
FIGURE 2 A future direction in
nutritional epidemiologic research: a
systems epidemiology approach to the
discovery of interactions between the
exposome (all nongenetic elements to
which we are exposed) and the
quantifiable elements of the human
physiome [Reproduced with permission
from Franks et al. (130)].
14 Satija et al.
a
t F
O
R
T
V
A
L
L
E
Y
S
T
A
T
E
U
N
IV
E
R
S
IT
Y
o
n
Ja
n
u
a
ry 9
, 2
0
1
8
a
d
va
n
ce
s.n
u
tritio
n
.o
rg
D
o
w
n
lo
a
d
e
d
fro
m
http://advances.nutrition.org/
data on diet and lifestyle, which will help advance nutritional
epidemiologic methods and contribute to the understanding
of diet and disease relations, it also faces many challenges.
The scientific community must consider several emerging is-
sues. First, diets are evolving, and researchers will have to
adapt to the changing food, societal, and cultural landscapes
by developing new approaches to assessing dietary changes in
large and diverse populations. There is an increasing need to
adopt the socioecologic model to address the widening food
quality gap between the rich and the poor and to reduce
health disparities that are associated with obesity and poor
diet quality (125, 126). Second, the globalization of the
food systems and chronic diseases signifies the need for
greater focus on low and middle income countries, where
nutrition and epidemiologic transitions are occurring at an
unprecedented pace, in parallel with rapid economic devel-
opment and urbanization. Third, the environmental impact
of food consumption and production should be considered
when formulating dietary guidelines and agricultural poli-
cies. Fourth, there is a need to incorporate a life course ap-
proach into nutritional epidemiology (127), studying the
effects of nutrition over the entire lifecycle, from gestation
to adult life, which would go beyond the prevailing practice
of initiating studies in midlife and carrying out randomized
trials for extremely short durations.
Lastly, nutritional epidemiology can benefit considerably
from the incorporation of recent developments in “omics”
technology, which although having its own challenges, holds
promise for advancing the field (128–130). “Omics” tech-
nology refers to a collection of high-throughput methods
for assessing a large number of genomic, epigenomic, tran-
scriptomic, proteomic, and metabolomic traits from biolog-
ical specimens. The integration of such technology into
traditional nutritional epidemiology, or adopting a “systems
epidemiology” approach (see Figure 2), can strengthen
study designs and provide additional insights on mechanis-
tic pathways, which the traditional epidemiologic approach
is often unable to do. All of these areas require an interdis-
ciplinary approach in which nutritional epidemiologic stud-
ies will continue to play an indispensable role.
Acknowledgments
All authors read and approved the final manuscript.
References
1. Taubes G. Epidemiology faces its limits. Science
1995;269:164–9.
2. Ioannidis JP. Implausible results in human nutrition research.
BMJ
2013;347:f6698.
3. Archer E, Hand GA, Blair SN. Validity of U.S. nutritional
surveillance:
National Health and Nutrition Examination Survey caloric
energy in-
take data, 1971–2010. PLoS ONE 2013;8:e76632.
4. Flegal KM, Kit BK, Orpana H, Graubard BI. Association of
all-cause
mortality with overweight and obesity using standard body mass
index
categories: a systematic review and meta-analysis. JAMA
2013;309:71–82.
5. Chowdhury R, Warnakula S, Kunutsor S, Crowe F, Ward HA,
Johnson
L, Franco OH, Butterworth AS, Forouhi NG, Thompson SG, et
al. As-
sociation of dietary, circulating, and supplement fatty acids
with cor-
onary risk: a systematic review and meta-analysis. Ann Intern
Med
2014;160:398–406.
6. Bittman M. Butter is back. The New York Times 2014 March
25.
7. Willett W. Nutritional epidemiology. 3rd ed. New York:
Oxford Uni-
versity Press; 2013.
8. Moshfegh AJ, Rhodes DG, Baer DJ, Murayi T, Clemens JC,
Rumpler
WV, Paul DR, Sebastian RS, Kuczynski KJ, Ingwersen LA, et
al. The
U.S. Department of Agriculture Automated Multiple-Pass
Method re-
duces bias in the collection of energy intakes. Am J Clin Nutr
2008;88:
324–32.
9. Bingham SACA, Cole TJ, Welch A, Runswick SA, Black AE,
Thurnham
D, Bates C, Khaw KT, Key TJ, Day NE. Methods for data
collection at an
individual level. In: Cameron M, Staverene WV, editors.
Manual on
methodology for food consumption studies. New York: Oxford
Univer-
sity Press; 1988. p. 53–106.
10. Pekkarinen M. Methodology in the collection of food
consumption
data. World Rev Nutr Diet 1970;12:145–71.
11. Hebert JR, Hurley TG, Chiriboga DE, Barone J. A
comparison of se-
lected nutrient intakes derived from three diet assessment
methods
used in a low-fat maintenance trial. Public Health Nutr
1998;1:207–
14.
12. De Keyzer W, Huybrechts I, De Vriendt V, Vandevijvere S,
Slimani N,
Van Oyen H, De Henauw S. Repeated 24-hour recalls versus
dietary
records for estimating nutrient intakes in a national food
consump-
tion survey. Food Nutr Res 2011;55:doi:
10.3402/fnr.v55i0.7307.
13. Hébert JR, Hurley TG, Steck SE, Miller DR, Tabung FK,
Peterson KE,
Kushi LH, Frongillo EA. Considering the value of dietary
assessment
data in informing nutrition-related health policy. Adv Nutr
2014;5:
447–55.
14. Guolo A. Robust techniques for measurement error
correction: a re-
view. Stat Methods Med Res 2008;17:555–80.
15. Hebert JR, Clemow L, Pbert L, Ockene IS, Ockene JK.
Social desirabil-
ity bias in dietary self-report may compromise the validity of
dietary
intake measures. Int J Epidemiol 1995;24:389–98.
16. Hebert JR, Ma Y, Clemow L, Ockene IS, Saperia G, Stanek
EJ 3rd,
Merriam PA, Ockene JK. Gender differences in social
desirability
and social approval bias in dietary self-report. Am J Epidemiol
1997;146:1046–55.
17. Hebert JR, Ebbeling CB, Matthews CE, Hurley TG, Ma Y,
Druker S,
Clemow L. Systematic errors in middle-aged women’s estimates
of en-
ergy intake: comparing three self-report measures to total
energy ex-
penditure from doubly labeled water. Ann Epidemiol
2002;12:577–86.
18. Preis SR, Spiegelman D, Zhao BB, Moshfegh A, Baer DJ,
Willett WC.
Application of a repeat-measure biomarker measurement error
model
to 2 validation studies: examination of the effect of within-
person var-
iation in biomarker measurements. Am J Epidemiol
2011;173:683–94.
19. Rosner B, Spiegelman D, Willett WC. Correction of logistic
regression
relative risk estimates and confidence intervals for measurement
error:
the case of multiple covariates measured with error. Am J
Epidemiol
1990;132:734–45.
20. Spiegelman D, Zhao B, Kim J. Correlated errors in biased
surrogates:
study designs and methods for measurement error correction.
Stat
Med 2005;24:1657–82.
21. Willett WC, Stampfer MJ, Underwood BA, Speizer FE,
Rosner B,
Hennekens CH. Validation of a dietary questionnaire with
plasma ca-
rotenoid and alpha-tocopherol levels. Am J Clin Nutr
1983;38:631–9.
22. Ascherio A, Stampfer MJ, Colditz GA, Rimm EB, Litin L,
Willett WC.
Correlations of vitamin A and E intakes with the plasma
concentra-
tions of carotenoids and tocopherols among American men and
women. J Nutr 1992;122:1792–801.
23. Conway JM, Ingwersen LA, Moshfegh AJ. Accuracy of
dietary recall
using the USDA five-step multiple-pass method in men: an
observa-
tional validation study. J Am Diet Assoc 2004;104:595–603.
24. Ferrari P, Friedenreich C, Matthews CE. The role of
measurement er-
ror in estimating levels of physical activity. Am J Epidemiol
2007;166:
832–40.
25. Adams SA, Matthews CE, Ebbeling CB, Moore CG,
Cunningham JE,
Fulton J, Hebert JR. The effect of social desirability and social
ap-
proval on self-reports of physical activity. Am J Epidemiol
2005;161:
389–98.
Understanding nutritional epidemiology 15
a
t F
O
R
T
V
A
L
L
E
Y
S
T
A
T
E
U
N
IV
E
R
S
IT
Y
o
n
Ja
n
u
a
ry 9
, 2
0
1
8
a
d
va
n
ce
s.n
u
tritio
n
.o
rg
D
o
w
n
lo
a
d
e
d
fro
m
http://advances.nutrition.org/
26. Archer E, Hand GA, Hebert JR, Lau EY, Wang X, Shook
RP, Fayad R,
Lavie CJ, Blair SN. Validation of a novel protocol for
calculating esti-
mated energy requirements and average daily physical activity
ratio
for the US population: 2005–2006. Mayo Clin Proc
2013;88:1398–407.
27. Archer E, Shook RP, Thomas DM, Church TS, Katzmarzyk
PT, Hebert
JR, McIver KL, Hand GA, Lavie CJ, Blair SN. 45-Year trends
in
women’s use of time and household management energy
expenditure.
PLoS ONE 2013;8:e56620.
28. Wang DD, Leung CW, Li Y, Ding EL, Chiuve SE, Hu FB,
Willett WC.
Trends in dietary quality among adults in the United States,
1999
through 2010. JAMA Intern Med 2014;174:1587–95.
29. Cade J, Thompson R, Burley V, Warm D. Development,
validation
and utilisation of food-frequency questionnaires—a review.
Public
Health Nutr 2002;5:567–87.
30. Subar AF, Thompson FE, Kipnis V, Midthune D, Hurwitz P,
McNutt
S, McIntosh A, Rosenfeld S. Comparative validation of the
Block,
Willett, and National Cancer Institute food frequency
questionnaires:
the Eating at America’s Table Study. Am J Epidemiol
2001;154:1089–99.
31. Kaaks RJ. Biochemical markers as additional measurements
in studies
of the accuracy of dietary questionnaire measurements:
conceptual is-
sues. Am J Clin Nutr 1997;65(Suppl 4):1232S–9S.
32. Giovannucci E, Goldin B. The role of fat, fatty acids, and
total energy
intake in the etiology of human colon cancer. Am J Clin Nutr
1997;66
(Suppl 6):1564S–71S.
33. Giovannucci E, Stampfer MJ, Colditz GA, Manson JE,
Rosner BA,
Longnecker M, Speizer FE, Willett WC. A comparison of
prospective
and retrospective assessments of diet in the study of breast
cancer. Am
J Epidemiol 1993;137:502–11.
34. Hernán MA, Robins JM. Estimating causal effects from
epidemiolog-
ical data. J Epidemiol Community Health 2006;60:578–86.
35. Hill AB. The environment and disease: association or
causation? Proc
R Soc Med 1965;58:295–300.
36. Malik VS, Hu FB. Sweeteners and risk of obesity and type 2
diabetes:
the role of sugar-sweetened beverages. Curr Diab Rep
2012;12:195–
203.
37. Jacobs DR, Jr., Gallaher DD. Whole grain intake and
cardiovascular
disease: a review. Curr Atheroscler Rep 2004;6:415–23.
38. Mozaffarian D, Aro A, Willett WC. Health effects of trans-
fatty acids:
experimental and observational evidence. Eur J Clin Nutr
2009;63
(Suppl 2):S5–21.
39. Jacobs DR, Jr., Gross MD, Tapsell LC. Food synergy: an
operational
concept for understanding nutrition. Am J Clin Nutr 2009;89:
1543S–8S.
40. Jacobs DR, Jr. What comes first: the food or the nutrient?
Executive
summary of a symposium. J Nutr 2014;144(Suppl 4):543S–6S.
41. Sofi F, Abbate R, Gensini GF, Casini A. Accruing evidence
on benefits
of adherence to the Mediterranean diet on health: an updated
system-
atic review and meta-analysis. Am J Clin Nutr 2010;92:1189–
96.
42. Hu FB, Stampfer MJ. Nut consumption and risk of coronary
heart
disease: a review of epidemiologic evidence. Curr Atheroscler
Rep
1999;1:204–9.
43. Katan MB, Zock PL, Mensink RP. Dietary oils, serum
lipoproteins,
and coronary heart disease. Am J Clin Nutr 1995;61(Suppl 6):
1368S–73S.
44. Dauchet L, Amouyel P, Hercberg S, Dallongeville J. Fruit
and vegetable
consumption and risk of coronary heart disease: a meta-analysis
of co-
hort studies. J Nutr 2006;136:2588–93.
45. Hu FB, Manson JE, Willett WC. Types of dietary fat and
risk of cor-
onary heart disease: a critical review. J Am Coll Nutr
2001;20:5–19.
46. Quiñones M, Miguel M, Aleixandre A. Beneficial effects of
polyphe-
nols on cardiovascular disease. Pharmacol Res 2013;68:125–31.
47. Bredsdorff L, Obel T, Dethlefsen C, Tjonneland A, Schmidt
EB,
Rasmussen SE, Overvad K. Urinary flavonoid excretion and risk
of
acute coronary syndrome in a nested case-control study. Am J
Clin
Nutr 2013;98:209–16.
48. Joensen AM, Overvad K, Dethlefsen C, Johnsen SP,
Tjonneland A,
Rasmussen LH, Schmidt EB. Marine n-3 polyunsaturated fatty
acids
in adipose tissue and the risk of acute coronary syndrome.
Circulation
2011;124:1232–8.
49. Mozaffarian D, Clarke R. Quantitative effects on
cardiovascular risk
factors and coronary heart disease risk of replacing partially
hydroge-
nated vegetable oils with other fats and oils. Eur J Clin Nutr
2009;63
(Suppl 2):S22–33.
50. Dansinger ML, Gleason JA, Griffith JL, Selker HP, Schaefer
EJ. Com-
parison of the Atkins, Ornish, Weight Watchers, and Zone diets
for
weight loss and heart disease risk reduction: a randomized trial.
JAMA 2005;293:43–53.
51. Stern L, Iqbal N, Seshadri P, Chicano KL, Daily DA,
McGrory J,
Williams M, Gracely EJ, Samaha FF. The effects of low-
carbohydrate
versus conventional weight loss diets in severely obese adults:
one-
year follow-up of a randomized trial. Ann Intern Med
2004;140:778–85.
52. Rubin DB. Inference and missing data. Biometrika
1976;63:581–92.
53. Willett WC. The WHI joins MRFIT: a revealing look
beneath the
covers. Am J Clin Nutr 2010;91:829–30.
54. Willett WC, Stampfer MJ. Dietary fat and cancer: another
view. Can-
cer Causes Control 1990;1:103–9.
55. Hu FB, Willett WC. Optimal diets for prevention of
coronary heart
disease. JAMA 2002;288:2569–78.
56. Blumberg J, Heaney RP, Huncharek M, Scholl T, Stampfer
M, Vieth R,
Weaver CM, Zeisel SH. Evidence-based criteria in the
nutritional con-
text. Nutr Rev 2010;68:478–84.
57. Steinhubl SR. Why have antioxidants failed in clinical
trials? Am J
Cardiol 2008;101:14D–9D.
58. Wiseman MJ, Jackson AA. Interpreting nutrition research –
more
complex than apparent plausibility. Electronic response to
Ioannidis
JP, Implausible results in human nutrition research. BMJ
2013;347:
f6698.
59. Anglemyer A, Horvath HT, Bero L. Healthcare outcomes
assessed
with observational study designs compared with those assessed
in ran-
domized trials. Cochrane Database Syst Rev 2014;4:MR000034.
60. Estruch R, Ros E, Salas-Salvado J, Covas MI, Corella D,
Aros F, Go-
mez-Gracia E, Ruiz-Gutierrez V, Fiol M, Lapetra J, et al.
Primary pre-
vention of cardiovascular disease with a Mediterranean diet. N
Engl J
Med 2013;368:1279–90.
61. Fardet A, Rock E. Toward a new philosophy of preventive
nutrition:
from a reductionist to a holistic paradigm to improve nutritional
rec-
ommendations. Adv Nutr 2014;5:430–46.
62. Rose G, Hamilton PJ. A randomised controlled trial of the
effect on
middle-aged men of advice to stop smoking. J Epidemiol
Community
Health 1978;32:275–81.
63. Greenhalgh T. Getting your bearings: what is this paper
about? How
to read a paper: the basics of evidence-based medicine. London:
BMJ Books; 2014. p. 41.
64. Guyatt GH, Sackett DL, Sinclair JC, Hayward R, Cook DJ,
Cook RJ.
Users’ guides to the medical literature. IX. A method for
grading
health care recommendations. Evidence-Based Medicine
Working
Group. JAMA 1995;274:1800–4.
65. Egger M, Davey Smith G, Schneider M, Minder C. Bias in
meta-analysis
detected by a simple, graphical test. BMJ 1997;315:629–34.
66. Duval S, Tweedie R. Trim and fill: a simple funnel-plot-
based method
of testing and adjusting for publication bias in meta-analysis.
Biomet-
rics 2000;56:455–63.
67. Cooper HM, Hedges LV, Valentine JC editors. The
handbook of re-
search synthesis and meta-analysis. 2nd ed. New York: Russell
Sage
Foundation; 2009.
68. Andres R, Muller DC, Sorkin JD. Long-term effects of
change in body
weight on all-cause mortality. A review. Ann Intern Med
1993;119:
737–43.
69. Lee IM, Paffenbarger RS, Jr. Is weight loss hazardous? Nutr
Rev 1996;
54:S116–24.
70. Berrington de Gonzalez A, Hartge P, Cerhan JR, Flint AJ,
Hannan L,
MacInnis RJ, Moore SC, Tobias GS, Anton-Culver H, Freeman
LB,
et al. Body-mass index and mortality among 1.46 million white
adults.
N Engl J Med 2010;363:2211–9.
16 Satija et al.
a
t F
O
R
T
V
A
L
L
E
Y
S
T
A
T
E
U
N
IV
E
R
S
IT
Y
o
n
Ja
n
u
a
ry 9
, 2
0
1
8
a
d
va
n
ce
s.n
u
tritio
n
.o
rg
D
o
w
n
lo
a
d
e
d
fro
m
http://advances.nutrition.org/
71. Whitlock G, Lewington S, Sherliker P, Clarke R, Emberson
J, Halsey J,
Qizilbash N, Collins R, Peto R. Body-mass index and cause-
specific
mortality in 900,000 adults: collaborative analyses of 57
prospective
studies. Lancet 2009;373:1083–96.
72. Manson JE, Stampfer MJ, Hennekens CH, Willett WC. Body
weight
and longevity. A reassessment. JAMA 1987;257:353–8.
73. Manson JE, Willett WC, Stampfer MJ, Colditz GA, Hunter
DJ,
Hankinson SE, Hennekens CH, Speizer FE. Body weight and
mor-
tality among women. N Engl J Med 1995;333:677–85.
74. Austin GL, Ogden LG, Hill JO. Trends in carbohydrate, fat,
and pro-
tein intakes and association with energy intake in normal-
weight,
overweight, and obese individuals: 1971–2006. Am J Clin Nutr
2011;93:836–43.
75. Vergnaud AC, Norat T, Mouw T, Romaguera D, May AM,
Bueno-
de-Mesquita HB, van der AD, Agudo A, Wareham N, Khaw KT,
et al.
Macronutrient composition of the diet and prospective weight
change
in participants of the EPIC-PANACEA study. PLoS ONE
2013;8:
e57300.
76. Hu FB, Stampfer MJ, Manson JE, Rimm E, Colditz GA,
Rosner BA,
Hennekens CH, Willett WC. Dietary fat intake and the risk of
coro-
nary heart disease in women. N Engl J Med 1997;337:1491–9.
77. Hu FB. Are refined carbohydrates worse than saturated fat?
Am J Clin
Nutr 2010;91:1541–2.
78. Introduction. Diabetes Care 2008;31(Suppl 1):S1–2.
79. Silber S. A new and rapid scoring system to assess the
scientific evi-
dence from clinical trials. J Interv Cardiol 2006;19:485–92.
80. U.S. Preventive Services Task Force [Internet]. Grade
definitions
[cited 2014 Aug 30]. Available from:
http://www.uspreventiveservices-
taskforce.org/uspstf/grades.htm#post.
81. U.S. FDA [Internet]. Guidance for industry: evidence-based
review
system for the scientific evaluation of health claims—final
[updated
2014 Jul 9; cited 2014 Aug 30]. Available from: http://www.fda.
gov/Food/GuidanceRegulation/GuidanceDocumentsRegulatoryIn
-
formation/ucm073332.htm#system.
82. Spahn JM, Lyon JM, Altman JM, Blum-Kemelor DM, Essery
EV,
Fungwe TV, Macneil PC, McGrane MM, Obbagy JE, Wong YP.
The
systematic review methodology used to support the 2010
Dietary
Guidelines Advisory Committee. J Am Diet Assoc
2011;111:520–3.
83. Smithells RW, Sheppard S, Schorah CJ, Seller MJ, Nevin
NC, Harris R,
Read AP, Fielding DW. Possible prevention of neural-tube
defects by
periconceptional vitamin supplementation. Lancet 1980;1:339–
40.
84. Bower C, Stanley FJ. Dietary folate as a risk factor for
neural-tube de-
fects: evidence from a case-control study in Western Australia.
Med J
Aust 1989;150:613–9.
85. Mulinare J, Cordero JF, Erickson JD, Berry RJ.
Periconceptional use of
multivitamins and the occurrence of neural tube defects. JAMA
1988;
260:3141–5.
86. Shaw GM, Schaffer D, Velie EM, Morland K, Harris JA.
Periconcep-
tional vitamin use, dietary folate, and the occurrence of neural
tube
defects. Epidemiology 1995;6:219–26.
87. Werler MM, Shapiro S, Mitchell AA. Periconceptional folic
acid expo-
sure and risk of occurrent neural tube defects. JAMA
1993;269:1257–
61.
88. Milunsky A, Jick H, Jick SS, Bruell CL, MacLaughlin DS,
Rothman KJ,
Willett W. Multivitamin/folic acid supplementation in early
pregnancy
reduces the prevalence of neural tube defects. JAMA
1989;262:2847–
52.
89. Wald NJ, Hackshaw AD, Stone R, Sourial NA. Blood folic
acid and vi-
tamin B12 in relation to neural tube defects. Br J Obstet
Gynaecol
1996;103:319–24.
90. MRC Vitamin Study Research Group. Prevention of neural
tube de-
fects: results of the Medical Research Council Vitamin Study.
Lancet
1991;338:131–7.
91. Czeizel AE, Dudas I. Prevention of the first occurrence of
neural-tube
defects by periconceptional vitamin supplementation. N Engl J
Med
1992;327:1832–5.
92. Beresford SA. How do we get enough folic acid to prevent
some neu-
ral tube defects? Am J Public Health 1994;84:348–50.
93. Rayburn WF, Stanley JR, Garrett ME. Periconceptional
folate intake
and neural tube defects. J Am Coll Nutr 1996;15:121–5.
94. Wald NJ. Folic acid and neural tube defects: the current
evidence and
implications for prevention. Ciba Found Symp 1994;181:192–
208.
95. Willett WC. Folic acid and neural tube defect: can’t we
come to clo-
sure? Am J Public Health 1992;82:666–8.
96. Honein MA, Paulozzi LJ, Mathews TJ, Erickson JD, Wong
LY. Impact
of folic acid fortification of the US food supply on the
occurrence of
neural tube defects. JAMA 2001;285:2981–6.
97. Malik VS, Schulze MB, Hu FB. Intake of sugar-sweetened
beverages
and weight gain: a systematic review. Am J Clin Nutr
2006;84:274–88.
98. Vartanian LR, Schwartz MB, Brownell KD. Effects of soft
drink con-
sumption on nutrition and health: a systematic review and meta-
analysis.
Am J Public Health 2007;97:667–75.
99. Malik VS, Popkin BM, Bray GA, Despres JP, Willett WC,
Hu FB.
Sugar-sweetened beverages and risk of metabolic syndrome and
type 2 diabetes: a meta-analysis. Diabetes Care 2010;33:2477–
83.
100. Huang C, Huang J, Tian Y, Yang X, Gu D. Sugar
sweetened beverages
consumption and risk of coronary heart disease: a meta-analysis
of
prospective studies. Atherosclerosis 2014;234:11–6.
101. Ebbeling CB, Feldman HA, Chomitz VR, Antonelli TA,
Gortmaker SL,
Osganian SK, Ludwig DS. A randomized trial of sugar-
sweetened bev-
erages and adolescent body weight. N Engl J Med
2012;367:1407–16.
102. de Ruyter JC, Olthof MR, Seidell JC, Katan MB. A trial of
sugar-free or
sugar-sweetened beverages and body weight in children. N Engl
J Med
2012;367:1397–406.
103. Brownell KD, Farley T, Willett WC, Popkin BM,
Chaloupka FJ,
Thompson JW, Ludwig DS. The public health and economic
benefits
of taxing sugar-sweetened beverages. N Engl J Med
2009;361:1599–605.
104. Brownell KD, Frieden TR. Ounces of prevention—the
public policy
case for taxes on sugared beverages. N Engl J Med
2009;360:1805–8.
105. University of North Carolina at Chapel Hill Food Research
Program
[Internet]. Evaluation of 2014 SSB & non-essential foods taxes
in
Mexico [cited 2014 Aug 30]. Available from:
http://uncfoodresearch-
program.web.unc.edu/projects/mexico-tax-eval/.
106. Guthrie A. Mexico soda tax dents Coke bottler’s sales. The
Wall Street
Journal 2014 Feb 26.
107. Bloomberg [Internet]. New York soda size limit statute
barred by state
judge [updated 2013 Mar 11; cited 2014 Aug 30]. Available
from: http:
//www.bloomberg.com/news/2013-03-11/new-york-city-soda-
size-
limitations-barred-by-state-court-judge.html.
108. CDC. Competitive foods and beverages in U.S. schools: a
state policy
analysis. Atlanta, GA: U.S. Department of Health and Human
Ser-
vices; 2012.
109. CityofBoston.gov [Internet press release]. Mayor Menino
issues order
to end sugary drink sales on city property [updated 2011 Apr 7;
cited
2014 Aug 30]. Available from: http://www.cityofboston.gov/
news/default.aspx?id=5051.
110. Anderson JT, Grande F, Keys A. Essential fatty acids,
degree of unsa-
turation, and effect of corn (maize) oil on the serum-cholesterol
level
in man. Lancet 1957;272:66–8.
111. Keys A, Anderson JT, Grande F. Prediction of serum-
cholesterol re-
sponses of man to changes in fats in the diet. Lancet
1957;273:959–66.
112. Mensink RP, Katan MB. Effect of dietary trans fatty acids
on high-
density and low-density lipoprotein cholesterol levels in healthy
sub-
jects. N Engl J Med 1990;323:439–45.
113. Willett WC, Stampfer MJ, Manson JE, Colditz GA, Speizer
FE, Rosner
BA, Sampson LA, Hennekens CH. Intake of trans fatty acids
and risk
of coronary heart disease among women. Lancet 1993;341:581–
5.
114. Willett WC, Ascherio A. Trans fatty acids: are the effects
only margi-
nal? Am J Public Health 1994;84:722–4.
115. U.S. FDA [Internet]. Trans fat now listed with saturated fat
and cho-
lesterol [updated 2013 Dec 17; cited 2014 Aug 30]. Available
from:
http://www.fda.gov/food/ingredientspackaginglabeling/labeling
nutrition/
ucm274590.htm.
116. Mozaffarian D, Katan MB, Ascherio A, Stampfer MJ,
Willett WC.
Trans fatty acids and cardiovascular disease. N Engl J Med
2006;
354:1601–13.
Understanding nutritional epidemiology 17
a
t F
O
R
T
V
A
L
L
E
Y
S
T
A
T
E
U
N
IV
E
R
S
IT
Y
o
n
Ja
n
u
a
ry 9
, 2
0
1
8
a
d
va
n
ce
s.n
u
tritio
n
.o
rg
D
o
w
n
lo
a
d
e
d
fro
m
http://advances.nutrition.org/
117. Mello MM. New York City’s war on fat. N Engl J Med
2009;360:2015–20.
118. Dietz WH, Scanlon KS. Eliminating the use of partially
hydrogenated
oil in food production and preparation. JAMA 2012;308:143–4.
119. Carroll MD, Kit BK, Lacher DA, Shero ST, Mussolino ME.
Trends in lipids
and lipoproteins in US adults, 1988–2010. JAMA
2012;308:1545–54.
120. Restrepo B, Rieger M. Trans fat and cardiovascular disease
mortality:
evidence from bans in restaurants in New York. Italy: European
Uni-
versity Institute, Max Weber Programme; 2014.
121. Federal Register [Internet]. Washington (DC): National
Archives and Records
Administration; 2013 [2014 Aug 19]. Available from:
https://www.
federalregister.gov/articles/2013/11/08/2013-26854/tentative-
determination-
regarding-partially-hydrogenated-oils-request-for-comments-
and-for.
122. Harris WS, Mozaffarian D, Rimm E, Kris-Etherton P,
Rudel LL, Appel
LJ, Engler MM, Engler MB, Sacks F. Omega-6 fatty acids and
risk for
cardiovascular disease: a science advisory from the American
Heart As-
sociation Nutrition Subcommittee of the Council on Nutrition,
Physical
Activity, and Metabolism; Council on Cardiovascular Nursing;
and
Council on Epidemiology and Prevention. Circulation
2009;119:902–7.
123. International Agency for Research on Cancer [Internet].
EPIC Study
[cited 2014 Aug 29]. Available from: http://epic.iarc.fr/.
124. UK Biobank [Internet] [cited 2014 Aug 29]. Available
from: http:
//www.ukbiobank.ac.uk/.
125. Sallis JF, Owen N, Fisher EB. Ecological models of health
behavior. In:
Glanz K, Rimer BK, Viswanath K, editors. Health behavior and
health
education: theory, research, and practice. San Francisco, CA:
Jossey-
Bass; 2008. p. 465–86.
126. Brug J, Oenema A, Ferreira I. Theory, evidence and
intervention map-
ping to improve behavior nutrition and physical activity
interventions.
Int J Behav Nutr Phys Act 2005;2:2.
127. Ben-Shlomo Y, Kuh D. A life course approach to chronic
disease ep-
idemiology: conceptual models, empirical challenges and
interdiscipli-
nary perspectives. Int J Epidemiol 2002;31:285–93.
128. Hu FB. Metabolic profiling of diabetes: from black-box
epidemiology
to systems epidemiology. Clin Chem 2011;57:1224–6.
129. Cornelis MC, Hu FB. Systems epidemiology: a new
direction in
nutrition and metabolic disease research. Curr Nutr Rep 2013;2:
225–35.
130. Franks PW, Pearson E, Florez JC. Gene-environment and
gene-treatment
interactions in type 2 diabetes: progress, pitfalls, and prospects.
Diabetes
Care 2013;36:1413–21.
18 Satija et al.
a
t F
O
R
T
V
A
L
L
E
Y
S
T
A
T
E
U
N
IV
E
R
S
IT
Y
o
n
Ja
n
u
a
ry 9
, 2
0
1
8
a
d
va
n
ce
s.n
u
tritio
n
.o
rg
D
o
w
n
lo
a
d
e
d
fro
m
http://advances.nutrition.org/
PERSPECTIVEUnderstanding Nutritional Epidemiology and Its.docx

More Related Content

Similar to PERSPECTIVEUnderstanding Nutritional Epidemiology and Its.docx

Malnutrition in the hospital
Malnutrition in the hospitalMalnutrition in the hospital
Malnutrition in the hospitalCorrie T
 
Malnutrition in the hospital
Malnutrition in the hospitalMalnutrition in the hospital
Malnutrition in the hospitalCorrie T
 
10.11648.j.ijnfs.20150405.12
10.11648.j.ijnfs.20150405.1210.11648.j.ijnfs.20150405.12
10.11648.j.ijnfs.20150405.12Ayalew Aklilu
 
A Practical Approach To The Management Of Micronutrients And Other Nutrients ...
A Practical Approach To The Management Of Micronutrients And Other Nutrients ...A Practical Approach To The Management Of Micronutrients And Other Nutrients ...
A Practical Approach To The Management Of Micronutrients And Other Nutrients ...Joe Andelija
 
Weight_loss_strategies_that_really_work_2.pdf
Weight_loss_strategies_that_really_work_2.pdfWeight_loss_strategies_that_really_work_2.pdf
Weight_loss_strategies_that_really_work_2.pdfMdShahidulIslam34943
 
The American Journal of Clinical Nutrition - ¿Sabemos todo sobre las bebidas ...
The American Journal of Clinical Nutrition - ¿Sabemos todo sobre las bebidas ...The American Journal of Clinical Nutrition - ¿Sabemos todo sobre las bebidas ...
The American Journal of Clinical Nutrition - ¿Sabemos todo sobre las bebidas ...claudiadelbosque
 
Malnutrition among Egyptian population
Malnutrition among Egyptian populationMalnutrition among Egyptian population
Malnutrition among Egyptian populationManar Mohamed Rashad
 
The Effect of Community Risk Perception on Type-2 Diabetes Mellitus Screening...
The Effect of Community Risk Perception on Type-2 Diabetes Mellitus Screening...The Effect of Community Risk Perception on Type-2 Diabetes Mellitus Screening...
The Effect of Community Risk Perception on Type-2 Diabetes Mellitus Screening...Carly Freeman
 
Nutrition therapy for eating disorder
Nutrition therapy for eating disorderNutrition therapy for eating disorder
Nutrition therapy for eating disorderNutrigenomicboy
 
THE ROLE OF PEDIATRICIAN IN PRIMARY PREVENTION OF OBISITY
THE ROLE OF PEDIATRICIAN IN PRIMARY PREVENTION OF OBISITYTHE ROLE OF PEDIATRICIAN IN PRIMARY PREVENTION OF OBISITY
THE ROLE OF PEDIATRICIAN IN PRIMARY PREVENTION OF OBISITYmandar haval
 
How Major Restaurant Chains Plan Their Menus
How Major Restaurant Chains Plan Their MenusHow Major Restaurant Chains Plan Their Menus
How Major Restaurant Chains Plan Their MenusMark Lyons
 
Crimson Publishers-Dietary Lifestyle, Way of Life Practices and Corpulence: ...
Crimson Publishers-Dietary Lifestyle, Way of Life Practices and  Corpulence: ...Crimson Publishers-Dietary Lifestyle, Way of Life Practices and  Corpulence: ...
Crimson Publishers-Dietary Lifestyle, Way of Life Practices and Corpulence: ...Crimsonpublishers-Rehabilitation
 
Running head NUTRITION1NUTRITION 8Nutriti.docx
Running head NUTRITION1NUTRITION 8Nutriti.docxRunning head NUTRITION1NUTRITION 8Nutriti.docx
Running head NUTRITION1NUTRITION 8Nutriti.docxtodd581
 
Running head NUTRITION1NUTRITION 8Nutriti.docx
Running head NUTRITION1NUTRITION 8Nutriti.docxRunning head NUTRITION1NUTRITION 8Nutriti.docx
Running head NUTRITION1NUTRITION 8Nutriti.docxglendar3
 

Similar to PERSPECTIVEUnderstanding Nutritional Epidemiology and Its.docx (20)

2914.docx
2914.docx2914.docx
2914.docx
 
Malnutrition in the hospital
Malnutrition in the hospitalMalnutrition in the hospital
Malnutrition in the hospital
 
Malnutrition in the hospital
Malnutrition in the hospitalMalnutrition in the hospital
Malnutrition in the hospital
 
10.11648.j.ijnfs.20150405.12
10.11648.j.ijnfs.20150405.1210.11648.j.ijnfs.20150405.12
10.11648.j.ijnfs.20150405.12
 
A Practical Approach To The Management Of Micronutrients And Other Nutrients ...
A Practical Approach To The Management Of Micronutrients And Other Nutrients ...A Practical Approach To The Management Of Micronutrients And Other Nutrients ...
A Practical Approach To The Management Of Micronutrients And Other Nutrients ...
 
Order 325914012 2
Order 325914012 2Order 325914012 2
Order 325914012 2
 
What Is Front Of Pack Labelling_2013
What Is Front Of Pack Labelling_2013What Is Front Of Pack Labelling_2013
What Is Front Of Pack Labelling_2013
 
Weight_loss_strategies_that_really_work_2.pdf
Weight_loss_strategies_that_really_work_2.pdfWeight_loss_strategies_that_really_work_2.pdf
Weight_loss_strategies_that_really_work_2.pdf
 
The American Journal of Clinical Nutrition - ¿Sabemos todo sobre las bebidas ...
The American Journal of Clinical Nutrition - ¿Sabemos todo sobre las bebidas ...The American Journal of Clinical Nutrition - ¿Sabemos todo sobre las bebidas ...
The American Journal of Clinical Nutrition - ¿Sabemos todo sobre las bebidas ...
 
Marinchick Research Paper
Marinchick Research PaperMarinchick Research Paper
Marinchick Research Paper
 
Malnutrition among Egyptian population
Malnutrition among Egyptian populationMalnutrition among Egyptian population
Malnutrition among Egyptian population
 
Amo el igado
Amo el igadoAmo el igado
Amo el igado
 
The Effect of Community Risk Perception on Type-2 Diabetes Mellitus Screening...
The Effect of Community Risk Perception on Type-2 Diabetes Mellitus Screening...The Effect of Community Risk Perception on Type-2 Diabetes Mellitus Screening...
The Effect of Community Risk Perception on Type-2 Diabetes Mellitus Screening...
 
Nutrition therapy for eating disorder
Nutrition therapy for eating disorderNutrition therapy for eating disorder
Nutrition therapy for eating disorder
 
THE ROLE OF PEDIATRICIAN IN PRIMARY PREVENTION OF OBISITY
THE ROLE OF PEDIATRICIAN IN PRIMARY PREVENTION OF OBISITYTHE ROLE OF PEDIATRICIAN IN PRIMARY PREVENTION OF OBISITY
THE ROLE OF PEDIATRICIAN IN PRIMARY PREVENTION OF OBISITY
 
How Major Restaurant Chains Plan Their Menus
How Major Restaurant Chains Plan Their MenusHow Major Restaurant Chains Plan Their Menus
How Major Restaurant Chains Plan Their Menus
 
Malnutrition and hd
Malnutrition and hdMalnutrition and hd
Malnutrition and hd
 
Crimson Publishers-Dietary Lifestyle, Way of Life Practices and Corpulence: ...
Crimson Publishers-Dietary Lifestyle, Way of Life Practices and  Corpulence: ...Crimson Publishers-Dietary Lifestyle, Way of Life Practices and  Corpulence: ...
Crimson Publishers-Dietary Lifestyle, Way of Life Practices and Corpulence: ...
 
Running head NUTRITION1NUTRITION 8Nutriti.docx
Running head NUTRITION1NUTRITION 8Nutriti.docxRunning head NUTRITION1NUTRITION 8Nutriti.docx
Running head NUTRITION1NUTRITION 8Nutriti.docx
 
Running head NUTRITION1NUTRITION 8Nutriti.docx
Running head NUTRITION1NUTRITION 8Nutriti.docxRunning head NUTRITION1NUTRITION 8Nutriti.docx
Running head NUTRITION1NUTRITION 8Nutriti.docx
 

More from mattjtoni51554

you will evaluate the history of cryptography from its origins.  Ana.docx
you will evaluate the history of cryptography from its origins.  Ana.docxyou will evaluate the history of cryptography from its origins.  Ana.docx
you will evaluate the history of cryptography from its origins.  Ana.docxmattjtoni51554
 
You will do this project in a group of 5 or less. Each group or in.docx
You will do this project in a group of 5 or less. Each group or in.docxYou will do this project in a group of 5 or less. Each group or in.docx
You will do this project in a group of 5 or less. Each group or in.docxmattjtoni51554
 
you will discuss the use of a tool for manual examination of a .docx
you will discuss the use of a tool for manual examination of a .docxyou will discuss the use of a tool for manual examination of a .docx
you will discuss the use of a tool for manual examination of a .docxmattjtoni51554
 
you will discuss sexuality, popular culture and the media.  What is .docx
you will discuss sexuality, popular culture and the media.  What is .docxyou will discuss sexuality, popular culture and the media.  What is .docx
you will discuss sexuality, popular culture and the media.  What is .docxmattjtoni51554
 
You will discuss assigned questions for the ModuleWeek. · Answe.docx
You will discuss assigned questions for the ModuleWeek. · Answe.docxYou will discuss assigned questions for the ModuleWeek. · Answe.docx
You will discuss assigned questions for the ModuleWeek. · Answe.docxmattjtoni51554
 
You will develop a proposed public health nursing intervention to me.docx
You will develop a proposed public health nursing intervention to me.docxYou will develop a proposed public health nursing intervention to me.docx
You will develop a proposed public health nursing intervention to me.docxmattjtoni51554
 
You will develop a comprehensive literature search strategy. After r.docx
You will develop a comprehensive literature search strategy. After r.docxYou will develop a comprehensive literature search strategy. After r.docx
You will develop a comprehensive literature search strategy. After r.docxmattjtoni51554
 
You will develop a formal information paper that addresses the l.docx
You will develop a formal information paper that addresses the l.docxYou will develop a formal information paper that addresses the l.docx
You will develop a formal information paper that addresses the l.docxmattjtoni51554
 
You will design a patient education tool that can be used by nurses .docx
You will design a patient education tool that can be used by nurses .docxYou will design a patient education tool that can be used by nurses .docx
You will design a patient education tool that can be used by nurses .docxmattjtoni51554
 
You will design a patient education tool that can be used by nur.docx
You will design a patient education tool that can be used by nur.docxYou will design a patient education tool that can be used by nur.docx
You will design a patient education tool that can be used by nur.docxmattjtoni51554
 
You will create an entire Transformational Change Management Plan fo.docx
You will create an entire Transformational Change Management Plan fo.docxYou will create an entire Transformational Change Management Plan fo.docx
You will create an entire Transformational Change Management Plan fo.docxmattjtoni51554
 
You will create an Access School Management System Database that can.docx
You will create an Access School Management System Database that can.docxYou will create an Access School Management System Database that can.docx
You will create an Access School Management System Database that can.docxmattjtoni51554
 
You will create a 13 slide powerpoint presentation (including your r.docx
You will create a 13 slide powerpoint presentation (including your r.docxYou will create a 13 slide powerpoint presentation (including your r.docx
You will create a 13 slide powerpoint presentation (including your r.docxmattjtoni51554
 
You will create a 10 minute virtual tour of a cultural museum” that.docx
You will create a 10 minute virtual tour of a cultural museum” that.docxYou will create a 10 minute virtual tour of a cultural museum” that.docx
You will create a 10 minute virtual tour of a cultural museum” that.docxmattjtoni51554
 
You will continue the previous discussion by considering the sacred.docx
You will continue the previous discussion by considering the sacred.docxYou will continue the previous discussion by considering the sacred.docx
You will continue the previous discussion by considering the sacred.docxmattjtoni51554
 
You will craft individual essays in response to the provided prompts.docx
You will craft individual essays in response to the provided prompts.docxYou will craft individual essays in response to the provided prompts.docx
You will craft individual essays in response to the provided prompts.docxmattjtoni51554
 
You will complete the Aquifer case,Internal Medicine 14 18-year.docx
You will complete the Aquifer case,Internal Medicine 14 18-year.docxYou will complete the Aquifer case,Internal Medicine 14 18-year.docx
You will complete the Aquifer case,Internal Medicine 14 18-year.docxmattjtoni51554
 
You will complete the Aquifer case,Internal Medicine 14 18-.docx
You will complete the Aquifer case,Internal Medicine 14 18-.docxYou will complete the Aquifer case,Internal Medicine 14 18-.docx
You will complete the Aquifer case,Internal Medicine 14 18-.docxmattjtoni51554
 
You will complete several steps for this assignment.Step 1 Yo.docx
You will complete several steps for this assignment.Step 1 Yo.docxYou will complete several steps for this assignment.Step 1 Yo.docx
You will complete several steps for this assignment.Step 1 Yo.docxmattjtoni51554
 
You will compile a series of critical analyses of how does divorce .docx
You will compile a series of critical analyses of how does divorce .docxYou will compile a series of critical analyses of how does divorce .docx
You will compile a series of critical analyses of how does divorce .docxmattjtoni51554
 

More from mattjtoni51554 (20)

you will evaluate the history of cryptography from its origins.  Ana.docx
you will evaluate the history of cryptography from its origins.  Ana.docxyou will evaluate the history of cryptography from its origins.  Ana.docx
you will evaluate the history of cryptography from its origins.  Ana.docx
 
You will do this project in a group of 5 or less. Each group or in.docx
You will do this project in a group of 5 or less. Each group or in.docxYou will do this project in a group of 5 or less. Each group or in.docx
You will do this project in a group of 5 or less. Each group or in.docx
 
you will discuss the use of a tool for manual examination of a .docx
you will discuss the use of a tool for manual examination of a .docxyou will discuss the use of a tool for manual examination of a .docx
you will discuss the use of a tool for manual examination of a .docx
 
you will discuss sexuality, popular culture and the media.  What is .docx
you will discuss sexuality, popular culture and the media.  What is .docxyou will discuss sexuality, popular culture and the media.  What is .docx
you will discuss sexuality, popular culture and the media.  What is .docx
 
You will discuss assigned questions for the ModuleWeek. · Answe.docx
You will discuss assigned questions for the ModuleWeek. · Answe.docxYou will discuss assigned questions for the ModuleWeek. · Answe.docx
You will discuss assigned questions for the ModuleWeek. · Answe.docx
 
You will develop a proposed public health nursing intervention to me.docx
You will develop a proposed public health nursing intervention to me.docxYou will develop a proposed public health nursing intervention to me.docx
You will develop a proposed public health nursing intervention to me.docx
 
You will develop a comprehensive literature search strategy. After r.docx
You will develop a comprehensive literature search strategy. After r.docxYou will develop a comprehensive literature search strategy. After r.docx
You will develop a comprehensive literature search strategy. After r.docx
 
You will develop a formal information paper that addresses the l.docx
You will develop a formal information paper that addresses the l.docxYou will develop a formal information paper that addresses the l.docx
You will develop a formal information paper that addresses the l.docx
 
You will design a patient education tool that can be used by nurses .docx
You will design a patient education tool that can be used by nurses .docxYou will design a patient education tool that can be used by nurses .docx
You will design a patient education tool that can be used by nurses .docx
 
You will design a patient education tool that can be used by nur.docx
You will design a patient education tool that can be used by nur.docxYou will design a patient education tool that can be used by nur.docx
You will design a patient education tool that can be used by nur.docx
 
You will create an entire Transformational Change Management Plan fo.docx
You will create an entire Transformational Change Management Plan fo.docxYou will create an entire Transformational Change Management Plan fo.docx
You will create an entire Transformational Change Management Plan fo.docx
 
You will create an Access School Management System Database that can.docx
You will create an Access School Management System Database that can.docxYou will create an Access School Management System Database that can.docx
You will create an Access School Management System Database that can.docx
 
You will create a 13 slide powerpoint presentation (including your r.docx
You will create a 13 slide powerpoint presentation (including your r.docxYou will create a 13 slide powerpoint presentation (including your r.docx
You will create a 13 slide powerpoint presentation (including your r.docx
 
You will create a 10 minute virtual tour of a cultural museum” that.docx
You will create a 10 minute virtual tour of a cultural museum” that.docxYou will create a 10 minute virtual tour of a cultural museum” that.docx
You will create a 10 minute virtual tour of a cultural museum” that.docx
 
You will continue the previous discussion by considering the sacred.docx
You will continue the previous discussion by considering the sacred.docxYou will continue the previous discussion by considering the sacred.docx
You will continue the previous discussion by considering the sacred.docx
 
You will craft individual essays in response to the provided prompts.docx
You will craft individual essays in response to the provided prompts.docxYou will craft individual essays in response to the provided prompts.docx
You will craft individual essays in response to the provided prompts.docx
 
You will complete the Aquifer case,Internal Medicine 14 18-year.docx
You will complete the Aquifer case,Internal Medicine 14 18-year.docxYou will complete the Aquifer case,Internal Medicine 14 18-year.docx
You will complete the Aquifer case,Internal Medicine 14 18-year.docx
 
You will complete the Aquifer case,Internal Medicine 14 18-.docx
You will complete the Aquifer case,Internal Medicine 14 18-.docxYou will complete the Aquifer case,Internal Medicine 14 18-.docx
You will complete the Aquifer case,Internal Medicine 14 18-.docx
 
You will complete several steps for this assignment.Step 1 Yo.docx
You will complete several steps for this assignment.Step 1 Yo.docxYou will complete several steps for this assignment.Step 1 Yo.docx
You will complete several steps for this assignment.Step 1 Yo.docx
 
You will compile a series of critical analyses of how does divorce .docx
You will compile a series of critical analyses of how does divorce .docxYou will compile a series of critical analyses of how does divorce .docx
You will compile a series of critical analyses of how does divorce .docx
 

Recently uploaded

What is Model Inheritance in Odoo 17 ERP
What is Model Inheritance in Odoo 17 ERPWhat is Model Inheritance in Odoo 17 ERP
What is Model Inheritance in Odoo 17 ERPCeline George
 
Meghan Sutherland In Media Res Media Component
Meghan Sutherland In Media Res Media ComponentMeghan Sutherland In Media Res Media Component
Meghan Sutherland In Media Res Media ComponentInMediaRes1
 
EPANDING THE CONTENT OF AN OUTLINE using notes.pptx
EPANDING THE CONTENT OF AN OUTLINE using notes.pptxEPANDING THE CONTENT OF AN OUTLINE using notes.pptx
EPANDING THE CONTENT OF AN OUTLINE using notes.pptxRaymartEstabillo3
 
AmericanHighSchoolsprezentacijaoskolama.
AmericanHighSchoolsprezentacijaoskolama.AmericanHighSchoolsprezentacijaoskolama.
AmericanHighSchoolsprezentacijaoskolama.arsicmarija21
 
Introduction to AI in Higher Education_draft.pptx
Introduction to AI in Higher Education_draft.pptxIntroduction to AI in Higher Education_draft.pptx
Introduction to AI in Higher Education_draft.pptxpboyjonauth
 
Employee wellbeing at the workplace.pptx
Employee wellbeing at the workplace.pptxEmployee wellbeing at the workplace.pptx
Employee wellbeing at the workplace.pptxNirmalaLoungPoorunde1
 
Computed Fields and api Depends in the Odoo 17
Computed Fields and api Depends in the Odoo 17Computed Fields and api Depends in the Odoo 17
Computed Fields and api Depends in the Odoo 17Celine George
 
ECONOMIC CONTEXT - LONG FORM TV DRAMA - PPT
ECONOMIC CONTEXT - LONG FORM TV DRAMA - PPTECONOMIC CONTEXT - LONG FORM TV DRAMA - PPT
ECONOMIC CONTEXT - LONG FORM TV DRAMA - PPTiammrhaywood
 
Gas measurement O2,Co2,& ph) 04/2024.pptx
Gas measurement O2,Co2,& ph) 04/2024.pptxGas measurement O2,Co2,& ph) 04/2024.pptx
Gas measurement O2,Co2,& ph) 04/2024.pptxDr.Ibrahim Hassaan
 
CELL CYCLE Division Science 8 quarter IV.pptx
CELL CYCLE Division Science 8 quarter IV.pptxCELL CYCLE Division Science 8 quarter IV.pptx
CELL CYCLE Division Science 8 quarter IV.pptxJiesonDelaCerna
 
18-04-UA_REPORT_MEDIALITERAСY_INDEX-DM_23-1-final-eng.pdf
18-04-UA_REPORT_MEDIALITERAСY_INDEX-DM_23-1-final-eng.pdf18-04-UA_REPORT_MEDIALITERAСY_INDEX-DM_23-1-final-eng.pdf
18-04-UA_REPORT_MEDIALITERAСY_INDEX-DM_23-1-final-eng.pdfssuser54595a
 
ECONOMIC CONTEXT - PAPER 1 Q3: NEWSPAPERS.pptx
ECONOMIC CONTEXT - PAPER 1 Q3: NEWSPAPERS.pptxECONOMIC CONTEXT - PAPER 1 Q3: NEWSPAPERS.pptx
ECONOMIC CONTEXT - PAPER 1 Q3: NEWSPAPERS.pptxiammrhaywood
 
Blooming Together_ Growing a Community Garden Worksheet.docx
Blooming Together_ Growing a Community Garden Worksheet.docxBlooming Together_ Growing a Community Garden Worksheet.docx
Blooming Together_ Growing a Community Garden Worksheet.docxUnboundStockton
 
Pharmacognosy Flower 3. Compositae 2023.pdf
Pharmacognosy Flower 3. Compositae 2023.pdfPharmacognosy Flower 3. Compositae 2023.pdf
Pharmacognosy Flower 3. Compositae 2023.pdfMahmoud M. Sallam
 
Organic Name Reactions for the students and aspirants of Chemistry12th.pptx
Organic Name Reactions  for the students and aspirants of Chemistry12th.pptxOrganic Name Reactions  for the students and aspirants of Chemistry12th.pptx
Organic Name Reactions for the students and aspirants of Chemistry12th.pptxVS Mahajan Coaching Centre
 
Earth Day Presentation wow hello nice great
Earth Day Presentation wow hello nice greatEarth Day Presentation wow hello nice great
Earth Day Presentation wow hello nice greatYousafMalik24
 
Historical philosophical, theoretical, and legal foundations of special and i...
Historical philosophical, theoretical, and legal foundations of special and i...Historical philosophical, theoretical, and legal foundations of special and i...
Historical philosophical, theoretical, and legal foundations of special and i...jaredbarbolino94
 
MARGINALIZATION (Different learners in Marginalized Group
MARGINALIZATION (Different learners in Marginalized GroupMARGINALIZATION (Different learners in Marginalized Group
MARGINALIZATION (Different learners in Marginalized GroupJonathanParaisoCruz
 
How to Make a Pirate ship Primary Education.pptx
How to Make a Pirate ship Primary Education.pptxHow to Make a Pirate ship Primary Education.pptx
How to Make a Pirate ship Primary Education.pptxmanuelaromero2013
 

Recently uploaded (20)

What is Model Inheritance in Odoo 17 ERP
What is Model Inheritance in Odoo 17 ERPWhat is Model Inheritance in Odoo 17 ERP
What is Model Inheritance in Odoo 17 ERP
 
Meghan Sutherland In Media Res Media Component
Meghan Sutherland In Media Res Media ComponentMeghan Sutherland In Media Res Media Component
Meghan Sutherland In Media Res Media Component
 
EPANDING THE CONTENT OF AN OUTLINE using notes.pptx
EPANDING THE CONTENT OF AN OUTLINE using notes.pptxEPANDING THE CONTENT OF AN OUTLINE using notes.pptx
EPANDING THE CONTENT OF AN OUTLINE using notes.pptx
 
AmericanHighSchoolsprezentacijaoskolama.
AmericanHighSchoolsprezentacijaoskolama.AmericanHighSchoolsprezentacijaoskolama.
AmericanHighSchoolsprezentacijaoskolama.
 
Introduction to AI in Higher Education_draft.pptx
Introduction to AI in Higher Education_draft.pptxIntroduction to AI in Higher Education_draft.pptx
Introduction to AI in Higher Education_draft.pptx
 
Employee wellbeing at the workplace.pptx
Employee wellbeing at the workplace.pptxEmployee wellbeing at the workplace.pptx
Employee wellbeing at the workplace.pptx
 
Computed Fields and api Depends in the Odoo 17
Computed Fields and api Depends in the Odoo 17Computed Fields and api Depends in the Odoo 17
Computed Fields and api Depends in the Odoo 17
 
ECONOMIC CONTEXT - LONG FORM TV DRAMA - PPT
ECONOMIC CONTEXT - LONG FORM TV DRAMA - PPTECONOMIC CONTEXT - LONG FORM TV DRAMA - PPT
ECONOMIC CONTEXT - LONG FORM TV DRAMA - PPT
 
Gas measurement O2,Co2,& ph) 04/2024.pptx
Gas measurement O2,Co2,& ph) 04/2024.pptxGas measurement O2,Co2,& ph) 04/2024.pptx
Gas measurement O2,Co2,& ph) 04/2024.pptx
 
CELL CYCLE Division Science 8 quarter IV.pptx
CELL CYCLE Division Science 8 quarter IV.pptxCELL CYCLE Division Science 8 quarter IV.pptx
CELL CYCLE Division Science 8 quarter IV.pptx
 
ESSENTIAL of (CS/IT/IS) class 06 (database)
ESSENTIAL of (CS/IT/IS) class 06 (database)ESSENTIAL of (CS/IT/IS) class 06 (database)
ESSENTIAL of (CS/IT/IS) class 06 (database)
 
18-04-UA_REPORT_MEDIALITERAСY_INDEX-DM_23-1-final-eng.pdf
18-04-UA_REPORT_MEDIALITERAСY_INDEX-DM_23-1-final-eng.pdf18-04-UA_REPORT_MEDIALITERAСY_INDEX-DM_23-1-final-eng.pdf
18-04-UA_REPORT_MEDIALITERAСY_INDEX-DM_23-1-final-eng.pdf
 
ECONOMIC CONTEXT - PAPER 1 Q3: NEWSPAPERS.pptx
ECONOMIC CONTEXT - PAPER 1 Q3: NEWSPAPERS.pptxECONOMIC CONTEXT - PAPER 1 Q3: NEWSPAPERS.pptx
ECONOMIC CONTEXT - PAPER 1 Q3: NEWSPAPERS.pptx
 
Blooming Together_ Growing a Community Garden Worksheet.docx
Blooming Together_ Growing a Community Garden Worksheet.docxBlooming Together_ Growing a Community Garden Worksheet.docx
Blooming Together_ Growing a Community Garden Worksheet.docx
 
Pharmacognosy Flower 3. Compositae 2023.pdf
Pharmacognosy Flower 3. Compositae 2023.pdfPharmacognosy Flower 3. Compositae 2023.pdf
Pharmacognosy Flower 3. Compositae 2023.pdf
 
Organic Name Reactions for the students and aspirants of Chemistry12th.pptx
Organic Name Reactions  for the students and aspirants of Chemistry12th.pptxOrganic Name Reactions  for the students and aspirants of Chemistry12th.pptx
Organic Name Reactions for the students and aspirants of Chemistry12th.pptx
 
Earth Day Presentation wow hello nice great
Earth Day Presentation wow hello nice greatEarth Day Presentation wow hello nice great
Earth Day Presentation wow hello nice great
 
Historical philosophical, theoretical, and legal foundations of special and i...
Historical philosophical, theoretical, and legal foundations of special and i...Historical philosophical, theoretical, and legal foundations of special and i...
Historical philosophical, theoretical, and legal foundations of special and i...
 
MARGINALIZATION (Different learners in Marginalized Group
MARGINALIZATION (Different learners in Marginalized GroupMARGINALIZATION (Different learners in Marginalized Group
MARGINALIZATION (Different learners in Marginalized Group
 
How to Make a Pirate ship Primary Education.pptx
How to Make a Pirate ship Primary Education.pptxHow to Make a Pirate ship Primary Education.pptx
How to Make a Pirate ship Primary Education.pptx
 

PERSPECTIVEUnderstanding Nutritional Epidemiology and Its.docx

  • 1. PERSPECTIVE Understanding Nutritional Epidemiology and Its Role in Policy1,2 Ambika Satija,3,4 Edward Yu,3 Walter C Willett,3–5 and Frank B Hu3–5* 3Department of Nutrition and 4Department of Epidemiology, Harvard School of Public Health, Boston, MA; and 5Channing Division of Network Medicine, Brigham and Women’s Hospital, Boston, MA ABSTRACT Nutritional epidemiology has recently been criticized on several fronts, including the inability to measure diet accurately, and for its reliance on observational studies to address etiologic questions. In addition, several recent meta-analyses with serious methodologic flaws have arrived at erroneous or misleading conclusions, reigniting controversy over formerly settled debates. All of this has raised questions regarding the ability of nutritional epidemiologic studies to inform policy. These criticisms, to a large degree, stem from a misunderstanding of the methodologic issues of the field and the inappropriate use of the drug trial paradigm in nutrition research. The exposure of
  • 2. interest in nutritional epidemiology is human diet, which is a complex system of interacting components that cumulatively affect health. Consequently, nutritional epidemiology constantly faces a unique set of challenges and continually develops specific methodologies to address these. Misunderstanding these issues can lead to the nonconstructive and sometimes naive criticisms we see today. This article aims to clarify common misunderstandings of nutritional epidemiology, address challenges to the field, and discuss the utility of nutritional science in guiding policy by focusing on 5 broad questions commonly asked of the field. Adv Nutr 2015;6:5–18. Keywords: dietary assessment, food policy, meta-analysis, nutritional epidemiology, randomized controlled trials, prospective cohort studies Introduction Epidemiology has long had its share of skeptics, with Taubes’ 1995 article being the most well-known (1). However, more recent commentaries have attacked nutritional epidemiol- ogy on several fronts. Ioannidis (2) criticizes the observa- tional nature of epidemiologic studies and small trials, stating that “definitive solutions won’t come from another million observational papers or small randomized trials.” He refers to an article by Archer et al. (3), which calls into question the validity of data from the NHANES and suggests that “the ability to estimate population trends in caloric
  • 3. intake and generate empirically supported public policy rel- evant to diet-health relations from US nutritional sur- veillance is extremely limited.” Furthermore, questionably designed and executed meta-analyses have disseminated conflicting messages about nutrition and health, such as the conclusion that being overweight lowers the risk of all- cause mortality (4) and that replacing saturated fat with polyunsaturated fats has no substantial impact on cardiovas- cular risk (5). Such conclusions are not only confusing but also dangerous because they can be perceived as misleading messages, or can lead to the communication of misleading messages to the public by popular media and the consequent adoption of unhealthy practices by the population at large. For instance, after the publication of the latter meta-analysis, New York Times columnist Mark Bittman told his readers that they “can go back to eating butter” (6). Many authors have suggested that large randomized con- trolled trials (RCTs)6 are the only solution to circumventing the problems in observational research. In reality, RCTs are far from being the panacea in the study of diet and chronic disease, and the results of such trials can be misleading. A key reason is that the exposure of interest in nutritional epidemiology—dietary intake—is complex, with interac- tions and synergies across different dietary components, which can be difficult to study with use of a linear drug trial approach. A complex behavioral exposure such as diet also makes other aspects important in pharmacologic RCTs, such as high compliance and blinding, difficult and infea- sible in most dietary intervention trials. Consequently, 1 Supported by NIH grants HL60712, DK58845, P30 DK46200, and U54CA155626.
  • 4. 2 Author disclosures: A Satija, E Yu, WC Willett, and FB Hu, no conflicts of interest. * To whom correspondence should be addressed. E-mail: [email protected] 6 Abbreviations used: CVD, cardiovascular disease; DLW, doubly labeled water; IHD, ischemic heart disease; NTD, neural tube defect; RCT, randomized controlled trial; SSB, sugar-sweetened beverage; TFA, trans FA; WHI, Women’s Health Initiative. ã2015 American Society for Nutrition. Adv. Nutr. 6: 5–18, 2015; doi:10.3945/an.114.007492. 5 a t F O R T V A L L E Y S T
  • 6. ce s.n u tritio n .o rg D o w n lo a d e d fro m http://advances.nutrition.org/ nutritional epidemiology has design and analysis issues unique to the field, and understanding the details of nutri- tional epidemiologic studies requires a deep knowledge of nutritional science and its methodologic background. The purpose of this article is to clarify common misun-
  • 7. derstandings of nutritional epidemiology, address the chal- lenges to the field, and discuss the utility of nutritional science in guiding policy. In particular, we address 5 broad questions that have been commonly raised about nutritional epidemiologic studies. Can We Reliably Measure Dietary Intakes in Individuals and Populations? Measuring diet in free-living populations is challenging be- cause individual diets are complex exposures with innumer- able and sometimes poorly characterized components that are consumed in varying amounts and combinations by dif- ferent individuals. Dietary variables are rarely dichotomous; often, but not always, the entire population is “exposed” to some degree. Diet is also a time-varying exposure, with in- dividual dietary habits and food composition changing over time. It is not surprising, then, that most dietary assess- ment methods have a component of error, which could be random day-to-day, diurnal, and seasonal variation in an in- dividual’s diet over time, or because of systematic mecha- nisms, such as omission of foods when collecting data. Nonetheless, several techniques have been developed to as- certain dietary intake from free-living populations, and these methods have shown good validity with use of multi- ple criteria. Although each assessment method comes with its own set of limitations, strengths unique to each method make it appropriate for use in specific applications (7–10). Multiple-week diet records, which require participants to record everything they eat or drink over the course of several weeks, are regarded as the gold standard for ascertaining di- etary information because, unlike other methods, they do not rely on memory. The high participant burden and cost of keeping diet records has limited their use in large-scale epidemiologic studies; however, their ability to accurately ascertain detailed dietary information makes them useful
  • 8. in validation studies of other diet assessment methods, and in monitoring compliance in trials. Another limitation of diet records is that the process of recording can change an individual’s diet, rendering the data atypical of usual in- take, although estimated intakes from diet records have been found to correlate reasonably well with those from multiple 24-h recalls (11). Repeated 24-h recalls involve a respondent reporting all foods consumed in the previous 24 h or calen- dar day to a trained interviewer in person or over the phone. Although reliance on the participant’s memory leaves room for measurement error, a skilled interviewer can produce highly detailed and useful nutritional data comparable to a diet record (11, 12). This method has been widely employed in dietary intervention trials. It is also used in national sur- veys to monitor trends in nutritional intake. A potential source of error common to these methods is in the estimation of nutrients with use of food composition tables. The nutrient content of a food varies with season, lo- cation of production, growing conditions, storage, process- ing, and cooking techniques, and many of these factors are unaccounted for in food composition tables. The degree to which this is problematic differs from nutrient to nutrient. Although for some nutrients, such as dietary FAs, it is rea- sonable to assume that these variations do not substantially affect calculated intakes, for others, such as selenium, the variation can result in calculated intakes that are substan- tially different from true intakes (7). In general, however, this source of error does not substantially compromise the ability to rank individuals with respect to nutrient intake so as to evaluate associations with health outcomes (7, 13). Nevertheless, estimating nutrient composition from food intake data is a challenge, especially given the changing food landscape, and it is crucial that we continue to improve the accuracy of food composition databases.
  • 9. When participants provide biological specimens, re- searchers can additionally measure intake by assaying bio- markers. Examples of biomarkers include doubly labeled water (DLW) (for total energy intake), urinary nitrogen (for protein intake), 24-h urinary sodium and potassium, blood lipid profiles, serum and plasma folate, and selenium and other trace minerals in toenails. Biomarkers allow for objective measurement of intake without any bias because of self-reporting. The limitations of biomarkers, however, have prevented their wider use. In particular, many foods and nutrients lack sensitive or specific biomarkers, their assessment always includes error from multiple sources, they may not be indicators of individual long-term intake, and obtaining and testing for biomarkers is expensive and burdensome. Thus, use of biomarkers to investigate nutrient- disease relations has been mostly confined to nested case- control studies and small trials. Biomarkers are also useful in assessing the validity of less-expensive, self-reported as- sessments of diet, such as FFQs. An FFQ consists of a structured food list and a frequency response section on which the participant indicates his/her usual frequency of intake of each food over a certain period of time in the past, usually 1 y. This is the most common choice for measuring intake in large observational studies owing to its ease of use, low participant burden, and ability to capture usual long-term dietary intake. These features make possible repeated assessments over time, which is im- portant to capture longer term variation in diets. Table 1 presents a comparative summary of the advantages, disad- vantages, and applications of these dietary assessment methods. Thus, a collection of diverse diet assessment methods is available; their appropriate application, alone or in combi-
  • 10. nation, allows for a reasonably comprehensive assessment of the diet of free-living populations. Nevertheless, recent critiques of these dietary assessment methods have called into question their utility in examining diet-disease relations and informing policy. A recent example is the article by Ar- cher et al. (3), which criticizes the use of 24-h dietary recall data periodically collected in the NHANES. Archer et al. 6 Satija et al. a t F O R T V A L L E Y S T A T E U N
  • 12. rg D o w n lo a d e d fro m http://advances.nutrition.org/ compared reported energy intake as assessed by the 24-h re- calls with expected basal metabolic rate and concluded that recalled energy intake data were implausibly low and recom- mended that NHANES data be eliminated in considering public policy. This finding represents the danger of misun- derstanding methodologic issues and making inferences with use of faulty logic. A recent article by Hébert et al. (13) comprehensively refutes the conclusions drawn from this study. The following section discusses key points from this article while providing an overview of measurement er- ror assessment and correction in nutritional epidemiology. Nutritional epidemiology has advanced considerably over the last 50 y with respect to understanding types and sources
  • 13. of measurement error in dietary intake data (7, 14). An insufficient appreciation of this can lead to erroneous con- clusions like those of Archer et al. (3). Because of the con- siderable day-to-day variation in dietary intake among individuals, a single recall, as was used by Archer et al. in their analysis, will tend to capture extremes of dietary intake as opposed to usual current intake, increasing the likelihood that any individual’s single recall will be implausibly high or low. This random variation adds noise to the data, overesti- mating the variance, and flattening the distribution, thereby increasing the numbers of individuals in the extremes of the distribution. Thus, repeated 24-h recalls on nonconsecutive days are recommended to reduce within-person error. More epidemiologic studies that use 24-h recalls to assess diet now obtain multiple replicate measures on each participant, and starting in 2002, a second 24-h recall was introduced in the NHANES to address some of these issues (8). However, as noted earlier, error in diet assessment need not be completely random. Systematic sources of variation include omission of foods consumed by individuals, errors in estimating portion sizes, and over- or under-reporting TABLE 1 Comparison of diet assessment methods Several day/week diet records Multiple 24-h recalls A single 24-h recall Validated FFQ Biomarkers Advantages Provides accurate, de- tailed, open-ended data on dietary in- take, with no reliance on memory, and di- rect computation of
  • 14. portion sizes. Provides fairly accurate, detailed, open- ended data on die- tary intake, without reliance on long- term memory. Provides detailed, open-ended data on dietary intake, with- out reliance on long- term memory. Provides time-inte- grated data that rep- resents usual long- term intake. Can as- sess past dietary intake. Provides an objective assessment of intake. Represents bioavail- able dose, which is relevant when it is used in etiologic analyses. Errors from omission, portion size estima- tion, and recall are least likely. Has lower respondent
  • 15. burden and is less expensive than diet records, and works well in low-literacy contexts. Has lower respondent burden and is less expensive than diet records and multiple recalls; works in low- literacy contexts. The least expensive and most easily adminis- tered diet assess- ment method, with the lowest respon- dent burden. May be available in ret- rospect (analysis of stored specimens). Disadvantages Needs literate, moti- vated participants; participant burden is very high when done over several days. Could also alter usual eating habits. There is scope for short- term recall error, omissions, and errors in portion size
  • 16. estimation. There is scope for short- term recall error, omissions, and errors in portion size esti- mation. Has high random within-per- son error. There is scope for long- term recall error. Omissions possible because of fixed- food list. FFQs need to be cul- ture- and population- specific. Biomarker may not be sensitive to intake, may have low speci- ficity, may not be time-integrated, may not represent usual long-term intake, and is subject to labora- tory errors and other sources of bias. Expensive and re- source-intensive diet assessment method. Potential for errors in nutrient estimation
  • 17. from food composi- tion tables. Has high interviewer burden and is more expensive than a single recall and FFQs. Potential for errors in nutrient estimation from food composi- tion tables. Has high interviewer burden and is more expensive than FFQs. Potential for errors in nutrient estimation from food composi- tion tables. Semi-quantitative. Potential for errors in nutrient estimation from food composi- tion tables. Expensive and more in- vasive. Biomarkers are not available for many nutrients. Applications Validation of other diet assessment methods.
  • 18. Validation of other diet assessment methods. National surveillance of mean population intake. Association analyses in large epidemiologic studies. Validation of other diet assessment methods. Monitoring compliance in dietary interven- tion trials. Monitoring compliance in dietary interven- tion trials. Assessment of trends in dietary intake (current NHANES). Assessment of trends in dietary intake (earlier NHANES). Assessing past dietary intake. Association analyses in epidemiologic stud- ies and monitoring
  • 19. compliance in inter- vention trials Understanding nutritional epidemiology 7 a t F O R T V A L L E Y S T A T E U N IV E R S
  • 21. w n lo a d e d fro m http://advances.nutrition.org/ because of social approval (respond in certain ways to get so- cial praise) or social desirability (respond in certain ways avoid social criticism) (15–17). All of these could have led to the under-reporting of energy intake observed by Archer et al. The underestimation of energy intake from self- reported data has long been known to nutrition researchers, and many strides in methodology have been made to reduce this source of measurement error (7, 18–22). Under-reporting because of omission or portion size estimation errors is un- likely to be differential with respect to determinants of the outcome of interest. In addition, there have been improve- ments in 24-h recall methodology that reduce these sources of error, such as the USDA 5-pass method (8), which is structured to minimize omission of foods and to help partic- ipants report accurate portion sizes by using visual aids. This 5-pass method, which was introduced into the NHANES starting in 2002, was found to agree reasonably well with ac- tual intake assessed by direct observation (r = 0.57, P < 0.05) (23), as well as with energy intake as assessed by the DLW
  • 22. technique (r = 0.32 for males; r = 0.25 for females), which is considered the gold standard for energy intake assessment (provided body compartment masses such as fat mass and water mass are stable over time because DLW is a measure of energy expenditure), although the DLW technique has er- rors of its own (8). Another solution is to use an isocaloric statistical model in analysis, i.e., adjust for total energy in- take. In analytic epidemiology we are generally less inter- ested in the association of absolute energy/macronutrient intake with health outcomes, and more with how dietary composition relates to risk of disease because this is what is most modifiable by individuals or populations. Hence, ad- justing for energy intake is standard practice in nutritional epidemiology. Adjusting for energy intake also diminishes extraneous sources of variation in dietary intake, and to some extent also reduces systematic sources of under- and over-reporting (7, 21, 22). Issues related to measurement error are not isolated to dietary assessment methods, but extend to assessment of most behavioral exposures and bio- markers, including physical activity (24, 25), with which Ar- cher and colleagues, having worked considerably in the area of physical activity epidemiology, are familiar (26, 27). Hence, although there is no perfect method, there is am- ple evidence that dietary measurements in national surveys have reasonably good reliability and validity. The conclusion of Archer et al. that dietary data with use of these methods cannot support public policy is misleading. National survey data such as the NHANES represent a small fraction of the totality of evidence on the basis of which national guidelines and public policy are made. A main purpose of using na- tional survey data is to assess average population intakes and trends. For example, we recently examined trends in di- etary quality from 1999 to 2010 in the US adult population among a nationally representative sample of 29,124 adults aged 20–85 y with use of the NHANES data (28). We found
  • 23. that better dietary quality, measured by the Alternate Healthy Eating Index, was associated with higher socioeco- nomic status, and the gap between the rich and the poor widened with time. These data underscore the importance of developing nutritional policies to improve diet quality and reduce health disparities. Because of its low cost and low participant burden, self- administered computer-processed FFQs are the only option in most large cohort studies to assess usual dietary intakes. FFQs usually have lower random within-person variation than other dietary assessment methods because they are de- signed to assess average usual intake over the past year. For this reason, they are better equipped to assess long-term di- etary intake, the exposure of etiologic interest for most dis- eases (7). Because of their reliance on memory, FFQs may suffer from greater measurement error relative to recalls and records if these methods are used for many days to re- flect longer-term intakes (for certain nutrients, just a few days of diet records or recalls might be enough, provided the days are spread out over the entire reference period of the FFQ). Nevertheless, FFQs have been shown to have ac- ceptable validity when compared to reference measures (29, 30), with typical correlation coefficients for individual nutrients or foods ranging from 0.4 to 0.7 (7). Adjustment for total energy intake, along with use of repeated FFQs in long-term prospective cohort studies, further improves these validity coefficients. Although extended dietary rec- ords are the most popular reference method, when bio- markers are available, triangulation methods can be used to obtain improved estimates of correlations of FFQ intake with true intake (31). These validity coefficients can be used to correct for measurement error in epidemiologic analyses, and the application of these measurement error correction methods is increasingly being extended to more
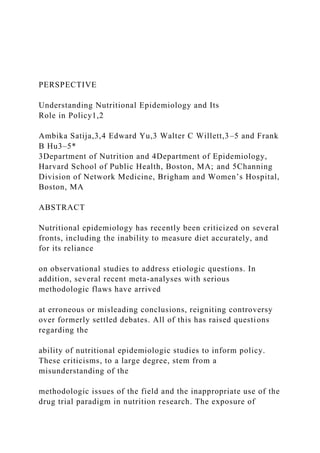
  • 24. complicated analyses (18–20). These techniques have al- lowed for valid inferences to be drawn from large cohort studies with use of FFQ data. Despite these developments in reducing measurement er- ror in dietary intake data, continued improvements in dietary assessment methodology and measurement error correction are needed to advance the field. Nevertheless, the consider- able progress made over the past few decades, especially the use of repeated measures of diet over time, has enabled nu- tritional epidemiologists to reliably collect and use dietary in- formation in both individuals and populations. What Is the Role of Nutritional Epidemiology in Inferring Causality? One of the main criticisms leveled against nutritional epide- miology is that it relies predominantly on observational data, which is deemed to be inferior to experimental data in determining causality. Figure 1 illustrates the typical hier- archy of evidence from various study designs. While ran- domized trials with hard endpoints occupy the highest position in this hierarchy, they are usually not the most ap- propriate or feasible study design to answer nutritional epi- demiologic questions regarding long-term effects of specific foods or nutrients (unless they can be packaged in a pill). In the absence of evidence from large RCTs on hard endpoints, nutritional epidemiologists typically rely on 8 Satija et al. a t F O R
  • 27. m http://advances.nutrition.org/ prospective cohort studies, the strongest observational study design in terms of minimizing bias and inferring causality. Being prospective in nature, they are less affected by several biases, such as reverse causation, recall bias, and selection bias, which commonly plague retrospective or cross- sectional study designs. Reverse causation describes the sit- uation in which the outcome affects the exposure, rather than the other way around. This is a common concern with cross-sectional studies and retrospective case-control studies because they assess exposure and outcome at the same time. Prospective cohort studies can minimize the pos- sibility of reverse causation by apparent disease because par- ticipants are followed forward in time, and these studies can examine the extent of reverse causation from subclinical dis- ease by lagged analyses. They are superior to retrospective case-control studies because the issues of selection bias (con- trols not being representative of the underlying population that gave rise to cases) and recall bias (knowledge of disease status affecting recall of diet) can be largely minimized be- cause prospective cohort studies begin with a disease-free population at baseline that is followed up to ascertain inci- dent cases that develop over time. This is evident from the fact that spurious links between total energy intake and co- lon cancer (32), and fats and breast cancer (33), which were reported in case-control studies, have not been replicated in large prospective cohort studies. A major challenge when working with any kind of obser- vational data is confounding. A confounder is a variable that
  • 28. is associated with both the exposure and outcome but is not caused by either, and when unaccounted for, introduces bias into the exposure-disease relation. The main reason why randomized trials are considered superior in inferring cau- sality is that randomly assigning participants to treatment groups nullifies all sources of measured and unmeasured confounding, provided the sample size is large enough. To account for this type of bias in an observational study design such as a prospective cohort study, researchers must rely on their content knowledge to identify and adjust for all rele- vant confounders. Once data have been collected on these variables, the investigator can statistically adjust for con- founders in a regression model or restrict the data to a specific subgroup to minimize residual confounding. A well-conducted cohort study can simulate a randomized trial when the most relevant confounders are accounted for (34). Sensitivity analysis further strengthens results by delineating the magnitude of unmeasured confounding needed to com- pletely neutralize an effect. Moreover, a prospective design al- lows for up-to-date tracking of confounders and diminishes the threat of residual confounding because updated informa- tion may reduce measurement error in assessment of con- founders, and additional information on confounders can be collected when needed. Although there are several ways in which confounding can be accounted for in prospective cohort studies, the crit- ical assumption of “no unmeasured or residual confound- ing” that is needed to infer causality cannot be empirically verified in observational epidemiology (34). For this reason, prospective cohort studies are often seen as providing sta- tistical associations but not causations. This can be a dangerous premise to blindly adhere to, especially when ran- domized trials of hard endpoints are not feasible and policy decisions have to be made based on existing evidence. In this
  • 29. scenario, the Hill criteria, published in 1965 by Sir Austin Bradford Hill, are useful in inferring causality from observa- tional data and making timely policy decisions that could avert preventable morbidity and mortality in the population (35). In his classic paper, Hill outlined a checklist of several key conditions for establishing causality: strength, consis- tency, temporality, biological gradient (dose-response), plausibility, coherence, and experimental evidence. These criteria have been satisfied in several exposure-disease rela- tions such as sugar-sweetened beverages (SSBs) and diabetes (36), whole grains and cardiovascular disease (CVD) (37), and trans fats and CVD (38), which has resulted in timely public health action to reduce the burden of these diseases in the United States. Given the complex nature of the human diet, another way of inferring causality is to consider different types of ex- posure (i.e., dietary patterns, foods, nutrients, and bio- markers) simultaneously (39, 40). For example, adherence to the Mediterranean-style diet has been known to confer a cardioprotective effect in observational studies and RCTs (41). Staples of the Mediterranean-style diet such as fish, nuts, olive oil, fruits, and vegetables have been individually linked to lower risk of heart disease (42–44). Reviews of ma- jor nutrients abundant in these foods, such as unsaturated fats and polyphenols, have confirmed this finding as well (45, 46), as have studies of related biomarkers (47, 48). Such a convergence among studies provides convincing sup- port for adoption of the Mediterranean-style diet in preven- tion of CVD. In the study of nutrition and health, prospective cohort studies aren’t the only sources of data used when considering causality. Evidence from animal studies, mechanistic studies in humans, prospective cohort studies of hard endpoints, and randomized trials of intermediate outcomes are taken
  • 30. FIGURE 1 Hierarchy of study designs in nutritional epidemiology. RCT, randomized controlled trial. Understanding nutritional epidemiology 9 a t F O R T V A L L E Y S T A T E U N IV E R
  • 32. o w n lo a d e d fro m http://advances.nutrition.org/ together to arrive at a consensus. The inference of causal- ity is strengthened when these different types of studies provide consistent evidence. For example, a meta-analysis of randomized trials of trans fat intake has shown harm- ful effects of higher intake on intermediate endpoints, such as increased LDL cholesterol and reduced HDL cho- lesterol (49). Based on observational studies, there is a significant and robust association between higher intake of trans fat and increased risk of ischemic heart disease (IHD) (49). Taken together, these studies forge a strong case for the harmful effects of trans fat consumption on heart disease. The most important aspect of this approach is that it discourages viewing individual studies and mea- sures of association in isolation and encourages interpret- ing them in context of the larger evidence base. Well-conducted prospective cohort studies thus can be used to infer causality with a high degree of certainty
  • 33. when randomized trials of hard endpoints are impractical. Researchers can minimize bias from confounding and other sources of bias by relying on high-quality study design, care- ful statistical analysis and interpretation, and replications of the findings across different populations. The Hill criteria are a useful tool for establishing causality in the absence of large RCTs on hard endpoints, and corroborating data from multiple study types and populations can enhance the weight of evidence. Is the Drug Trial Paradigm Relevant in Investigating Diet and Disease Relationships? Some researchers consider RCTs as the be-all and end-all of causal inference (2). This sentiment may be appropriate in the pharmaceutical industry, but the drug trial paradigm cannot be readily translated for use in the nutritional sci- ences. Table 2 summarizes the differences between observa- tional prospective cohort studies and RCTs, and Table 3 outlines the differences between RCTs in pharmaceutical and nutritional research. Unlike classic drug trials, RCTs of dietary interventions typically cannot be blinded, leading to the possibility that the effect of the intervention is due to knowledge of treatment assignment as opposed to the di- etary component of the intervention. Dropout rates also tend to be higher in RCTs of nutritional interventions relative to those in drug trials, especially if the intervention is implemented for long periods or is very demanding or both. Dietary interventions to promote weight loss routinely have dropout rates of 30–40% even after just 1 y of follow- up (50, 51). Such dropout, when substantial, will reduce an- alytical power in the presence of random loss to follow-up. However, it can also introduce systematic bias in the effect estimate, usually in unpredictable directions, if the dropout is differential with respect to treatment and outcome (52). Another problem faced to a greater extent in nutritional
  • 34. RCTs relative to drug trials is noncompliance, i.e., insuffi- cient adherence by participants to their assigned interven- tion. Such noncompliance may become severe in trials of longer duration. For example, over 8 y of follow-up in the Women’s Health Initiative (WHI), the most expensive hu- man study ever conducted, most of the participants ran- domly assigned to the low-fat group were unable to achieve their fat reduction target of 20% (53). Moreover, during the trial, there were no differences between the low-fat and control groups in plasma concentrations of HDL cholesterol and triglycerides, which are known to change on low-fat diets (53). The WHI, hence, failed to test its original hypothesis, and its null findings were largely uninformative with respect to the causal effect of a low-fat dietary intervention. A similar fate afflicted the earlier Mul- tiple Risk Factor Intervention Trial, in which reduction of serum cholesterol by dietary means failed to produce a sub- stantial contrast between intervention and control groups and thus no significant difference in CVD was seen (54). Randomized trials of nutritional interventions, although free from confounding and selection bias at baseline, can suffer from similar biases postbaseline that we often observe in observational studies, especially when they are of long du- ration, complicating their interpretation and diminishing their utility above prospective cohort studies. An additional issue with trials that last for extended periods of time is that they risk becoming obsolete. During the early 1990s, the WHI was set up to test the prevailing theory that reduced fat intake would decrease breast cancer and CVD risk. How- ever, during the course of the trial, clinical and epidemio- logic evidence that had accumulated to support greater importance of types of fat over total fat substantially TABLE 2 Prospective cohort studies vs. RCTs of foods and nutrients1
  • 35. Design criterion Prospective cohort study RCT Study characteristics Size Variable, usually fairly large Usually small Follow-up time Years and decades Weeks, months, a couple of years Dietary exposure Naturally occurring distributions Specific predefined intervention and control Endpoint Mortality, incident disease, intermediate outcomes Disease prognosis and management, intermediate outcomes Sources of bias Confounding Residual and/or unmeasured confounding possible No confounding if groups are balanced Selection bias Possible because of differential dropout Possible because of differential dropout Measurement error Possible because of error in diet assessment methods Possible because of incomplete compliance Generalizability Potential for high generalizability Usually fairly limited Feasibility Usually more feasible Feasibility limited by costs and ethical constraints 1 RCT, randomized controlled trial. 10 Satija et al. a t F O R T V
  • 38. http://advances.nutrition.org/ weakened the original rationale, especially with respect to CVD (55). The choice of a control group can also be more compli- cated in nutritional intervention trials relative to drug trials because the latter are usually placebo-controlled, which is rarely a possibility in the former because of ethical consider- ations. Thus, the intervention and control groups are differ- entiated in terms of the dose of a nutrient (“high” vs. “low”), and the definition of these doses is also usually determined by ethical constraints. For instance, it may not be ethically feasible to give a very low dose to, or introduce deficiency in, the control group. One way of circumventing this is to conduct a trial in a naturally deficient population by provid- ing supplementation to the intervention group. Even in this instance, it is not ethically feasible to provide the control group with just a placebo, and a minimum level of supple- mentation in the control group is usually necessary. This could result in too narrow a contrast in nutrient intake be- tween the control and intervention groups, undermining the trial’s ability to identify a true effect of the nutrient. Another factor further complicating the choice of a con- trol group is that nutrients and foods are not consumed in isolation, and decreasing the intake of one nutrient/food usually entails increasing the intake of another nutrient/ food to make up the reduction in calories in isocaloric trials (e.g., a reduction in dietary fat is often accompanied by a compensatory increase in carbohydrate intake or vice versa). Thus, the choice of comparison group can influence the ef- fect observed of a dietary intervention, further complicating the interpretation of dietary intervention trials.
  • 39. The utility of the drug trial paradigm in nutritional epi- demiology is further diminished by the fact that the human diet is a complex system, not amenable to the reductionist approach of isolating individual nutrients or compounds (56). Although drugs usually target a single system/pathway in the pathology of disease, nutrients are usually pan-systemic, influencing multiple systems and affecting disease risk through multiple pathways. Unlike drugs, which are de- signed to have large and targeted effects on individual path- ways that play out in relatively short periods of time, individual nutrients usually have modest effects that interact with and aggregate across multiple nutrients and systems over long periods of time to cumulatively affect disease risk. In drug trials, other drugs with known interactions are excluded or controlled for in some manner; in nutri- tional intervention trials, synergies and antagonisms with other nutrients and drugs are usually not given adequate consideration. High-dose vitamin and antioxidant trials mimic drug trials that examine the effect of isolated com- pounds, but these findings have been largely negative (57), which could be explained in part by the inappropriate use of the linear drug trial paradigm, which fails to take into ac- count the complex, interconnected nature of the dietary “ex- posome” (58). Well-conducted RCTs and observational studies that an- swer similar questions tend to find consistent results (59). However, when RCTs contradict the findings of observa- tional studies, there is a tendency for the academic commu- nity to believe that RCTs conclusively refute the hypotheses generated by such observational studies. Although this is a possibility, an equally, and sometimes more likely, possibility is that the RCTand observational studies are answering very different questions. For example, an observational study might answer the question “are some persons in a popula-
  • 40. tion at increased risk because of low intake of nutrient X?,” whereas an RCT might answer the question “does add- ing more nutrient X to the whole population reduce risk?” In this example, the latter would not necessarily refute the former. In fields like nutritional and chronic disease epide- miology, RCTs typically cannot answer the questions that observational cohorts do answer. RCTs tend to have several exclusion criteria, and with diseases like CVD as the out- come, tend to be carried out in high-risk populations. Ob- servational studies tend to be more inclusive and hence more representative of the general population. Additionally, although observational studies can evaluate any exposure contrast that is observed, RCTs usually examine a narrow ex- posure distribution that is feasible within ethical and practi- cal constraints. Owing to these limitations, most randomized trials are small (<200 subjects) and test for intermediate endpoints. One exception is Prevención con Dieta Mediterránea (60). In this landmark trial, the investigators tested for primary CVD events in 7447 men and women. After a median fol- low-up of 4.8 y, a Mediterranean diet was superior to a low-fat diet in reducing CVD incidence. It should be noted that the Prevención con Dieta Mediterránea was built on prior observational evidence from both ecologic and pro- spective cohort data that supported the benefits of the Med- iterranean diet. Furthermore, the investigators provided free foods to its participants to ensure high compliance, a crea- tive but often infeasible strategy in large nutritional inter- vention trials. Thus, it is important to remember that although large, well-designed RCTs are desirable when TABLE 3 RCTs of nutrients or foods vs. drugs1 Design criterion RCTs of nutrients or foods RCTs of drugs
  • 41. Exposure Complex, interacting network of foods/nutrients Individual, isolated chemical compounds Choice of control Variable, dependent on prior studies, feasibility, and ethicality Placebo Endpoint Disease prognosis and management, intermediate outcomes Clinical events, adverse events Dropout rate Moderate to high depending on length and type of intervention Low to moderate Blinding Not possible with foods and dietary patterns Easy Compliance Often decreases substantially over long period of follow-up High to moderate over follow-up 1 RCT, randomized controlled trial. Understanding nutritional epidemiology 11 a t F O R T V A L L E Y S T A T
  • 43. u tritio n .o rg D o w n lo a d e d fro m http://advances.nutrition.org/ feasible, the field of nutritional epidemiology cannot solely depend on them, especially when testing individual compo- nents of a dietary pattern. A large dietary intervention study, carried out with use of considerable funds, and over many years, tends to address only one question and only one expo- sure contrast within that question. Hence, the question that it answers needs to be carefully thought through because not examining the most etiologically relevant range of the expo- sure distribution will lead to potentially misleading results.
  • 44. Arriving at the right question to pose with use of an RCT needs valid observational data. The two, thus, go hand-in- hand, with their strengths and limitations complementing each other. For these reasons, the drug trial paradigm is usually not appropriate for investigating diet and disease relations and, when attempted, can lead to misleading results. Instead, a holistic research approach is likely to be more informative (61). A reductionist view that one compound brings about one physiologic effect ignores the intricacies of physiologic interactions. Foods cannot be treated as drugs, and a broader biological perspective will be necessary to effectively address nutritional questions in the future. Finally, nutritional epi- demiology is not the only field where RCTs can be mislead- ing. Although few would now question the benefits of smoking cessation, RCTs examining this issue have found no effect on mortality, probably because of recidivism and insufficient follow-up time (62). This is sobering consider- ing that smoking is one of the most powerful risk factors known, and diet and other behaviorally related risk factors such as physical activity tend to have more subtle effects on disease outcomes. Can We Trust the Findings from Meta-Analyses and Systematic Reviews of Nutritional Epidemiologic Studies? Systematic reviews and meta-analyses have been instrumen- tal in advancing the field and informing policy. Because meta-analyses and systematic reviews synthesize aggregate data, they are regarded by some to be the most authoritative form of available evidence (63, 64). Although they can be ex- tremely useful in summarizing relevant literature, they are not immune to limitations. Publication bias, the tendency for null findings to remain unpublished, is a common diffi- culty in such analyses, although Egger’s test (65) and trim-
  • 45. and-fill techniques (66) can be used to detect and correct for bias. Substantial between-study heterogeneity (e.g., dif- ferent exposures, outcomes, study populations, etc.) pre- sents another major obstacle to pooling and interpreting effect estimates, although the presence of statistical hetero- geneity does not necessarily invalidate the pooled results. Several methods have been devised to deal with this prob- lem. First, if heterogeneity (e.g., varying methods for out- come ascertainment across studies) is so severe such that a statistical synthesis of effect estimates is meaningless, then a systematic review and qualitative description of study re- sults is more appropriate. Second, one may choose to subset studies by specific characteristics (e.g., cohorts consisting only of women and only of men) to explore sources of het- erogeneity. Third, one can use a random-effects model rather than a fixed-effects model, which assumes that re- ported effect estimates do not converge on the same value (67). However, this solution introduces another complica- tion. Random-effects models tend to give more weight to and thus exaggerate the importance of smaller studies, lead- ing to potentially distorted pooled-effect estimates and wider CIs. Lastly, a meta-analysis is only as good as the stud- ies it pools together. If the methodologic quality of included studies is low, the meta-analysis can result in a misleading pooled effect estimate. Thus, it is important to give adequate consideration to the quality of included studies and either exclude lower-quality studies from the analysis or report pooled effects separately for higher-quality studies, and dis- cuss the impact of study quality on the pooled results. One must exercise care when interpreting a systematic re- view or meta-analysis in nutritional epidemiology. The number of systematic reviews and meta-analyses has ex- ploded in recent years. A search on PubMed for “systematic review” and “meta-analysis” retrieves 4374 hits published
  • 46. from 2000 to 2004, 11,597 hits from 2005 to 2009, and 21,420 hits from 2010 to 2014. The rush to fill in gaps in the literature has also led to sloppy reviews that would ben- efit from a more thorough evaluation. Furthermore, because a review does not require original data, anyone could poten- tially write one; unlike the conduct of original studies, for which the qualifications of the investigators and the research plan are carefully vetted in the funding process. Too often, articles appear to have been pushed to publication by authors who do not fully appreciate the complexity of the subject. Lack of content knowledge and insufficient under- standing of underlying biological mechanisms can lead to incomplete literature searches, flawed analytic methods, and misleading conclusions. Some of the methodologic problems were evident in a re- cent meta-analysis of BMI and mortality, which concluded that being overweight lowers the risk of all-cause mortality than being normal weight (4). However, this finding is at least partly explained by reverse causation because individ- uals with existing or even preclinical chronic diseases such as cancer and neurodegenerative diseases often experience weight loss long before death (68, 69). Excluding sick indi- viduals (70) or deaths from the first several years of follow- up (71) yields reasonably unbiased estimates that confirm a BMI range of 22–24.9 kg/m2 as having the lowest rates of all- cause mortality. The BMI-mortality analyses were also se- verely distorted by smoking, which is strongly associated with death but lower body weight (72), and restriction of analysis to never-smokers shifts the point of lowest mortality to the normal weight range (73). Another example is a recent meta-analysis that concluded that types of fat including saturated or polyunsaturated fats have no substantial impact on heart disease, a conclusion stemming in part from an inadequate understanding of nu-
  • 47. tritional epidemiologic methods (5). It has been long known in clinical nutrition and nutritional epidemiology that, when 12 Satija et al. a t F O R T V A L L E Y S T A T E U N IV E R S
  • 49. w n lo a d e d fro m http://advances.nutrition.org/ examining the effects of macronutrients in an isocaloric manner, one must be cognizant of which other macronutri- ent is replacing the one in question. In the example of satu- rated fat, assuming diets are isocaloric, a diet high in saturated fats must be replacing another nutrient to main- tain the same energy intake. At the population level, most of an individual’s energy is derived from carbohydrates (74, 75), which implies that those who consume high amounts of saturated fats are most likely replacing carbohy- drates. Substituting carbohydrates for saturated fats, how- ever, does not substantially alter the risk of heart disease (76). Refined carbohydrates, in particular, may be more harmful than saturated fats in terms of metabolic effects (77). However, substituting polyunsaturated fats for satu- rated fats substantially decreases the incidence of heart dis- ease (76). The conclusion, therefore, should not be that saturated fat has no impact on heart disease, but that satu- rated fat is not substantially better or worse than carbohy- drates at reducing heart disease.
  • 50. Thus, although systematic reviews and meta-analyses are useful tools for summarizing a large body of evidence, it is important to recognize their limitations, give adequate con- sideration to sources of heterogeneity or bias, and consider their conclusions in the context of other relevant literature. What Is the Role of Nutritional Epidemiologic Studies in Developing Policies? In quality rating the strength of evidence, national organiza- tions such as the American Diabetes Association, AHA, American College of Cardiology, US Preventive Services Task Force, and FDA have used well-defined grading systems to assign the weight of evidence to particular study types (78–81). Properly conducted RCTs with disease endpoints occupy the top tier of evidence in most scales, and prospec- tive cohort studies reside one level below RCTs. In the ab- sence of large RCTs with disease endpoints, evidence from prospective cohort studies in conjunction with smaller RCTs with intermediate endpoints is often considered in substantiating nutritional claims or establishing policies. For instance, the USDA/US Department of Health and Hu- man Services Dietary Guideline Advisory Committee has used evidence from prospective cohort studies extensively, in addition to evidence from RCTs, to evaluate the relations between specific dietary factors and chronic disease risk (82), which forms one of the foundations for making dietary recommendations for the US population. Three examples of epidemiologic data affecting policy change are discussed below. Folate was first identified as an important nutrient in pre- venting neural tube defects (NTDs), such as anencephaly and spina bifida, based on observational data from the United Kingdom in the 1970s (83). Subsequent case-control studies in the 1980s suggested that women who supple-
  • 51. mented with folate before pregnancy had a reduced risk of giving birth to infants with NTDs than those who did not (84–87). Only 1 prospective cohort study was conducted at this time, and the results also supported a strong protective effect of periconceptual folate supplementation (88). Observational studies examining blood folate concen- trations (89) and randomized trials of folate supplementa- tion (90, 91) confirmed this association. Calls began for government action with commentators proposing several strategies including the promotion of increased fruit and vegetable consumption, recommendation of supplementa- tion to reproductive-aged women, and fortification (92– 95). In 1996, the FDA authorized the enrichment of grain products with folate at the rate of 0.14 mg per 100-g flour, with mandatory compliance by 1998. Fortification had a dramatic effect, leading to a 19% reduction in incident NTDs in just 5 y (96). Numerous reports have linked SSBs, which include soda, sports drinks, and sweetened juices, with obesity (97, 98), type 2 diabetes (99), and heart disease (100). In addition, 2 large and rigorously conducted RCTs provided convincing evidence that decreasing consumption of SSBs substantially reduces excess weight gain and obesity in children and ado- lescents (101, 102). Calls have been made for policies to re- duce consumption of SSBs. In the United States, one popular proposal has been an excise tax on SSBs. Brownell and colleagues (103) estimate that an increase of 1 cent per ounce would lead to a minimum intake reduction of 10%. Such a tax would not only discourage unhealthy diet, it would also generate revenue and offset health care costs incurred by chronic diseases associated with refined sugar intake (104). In 2013 Mexico approved a 1 peso per liter tax on SSBs (105), and sales volumes for SSBs fell by 5% in early 2014 (106). That same year, Mayor Michael Bloom-
  • 52. berg led efforts to instate a size limit of 16 oz. on soft drinks sold in New York City. The proposal was passed by the city but was later struck down by the state supreme court (107). Other cities such as San Francisco have proposed excise taxes on SSBs, but opposition from soda and sugar lobbyists re- mains stiff. Nevertheless, certain developments, such as the removal of SSBs from most schools in the United States (108) and a ban on their sale in all public buildings in Bos- ton (109), reflect major steps in reducing consumption of SSBs. A highly successful example of nutritional epidemiology affecting policy is that of trans FAs (TFAs). TFAs were first developed to stabilize vegetable fat at room temperature and quickly became popular in food manufacturing pro- cesses in the early 20th century. Ancel Keys speculated that TFAs were associated with heart disease in the 1950s (110, 111), but it wasn’t until the 1990s that experimental evi- dence suggested that TFAs both increase LDL cholesterol and decrease HDL cholesterol (112). Subsequent epidemio- logic evidence from the Nurses’ Health Study corroborated this link (113). As more evidence mounted, scientists called for a reduction of TFAs in foods (114), and in 2003, the FDA approved a proposal for manufacturers to list TFAs in the nutrition facts label of foods (115). In 2006 a meta-analysis of observational studies estimated that replacing 2% of en- ergy from carbohydrates with the same amount of energy from TFAs would result in a 29% (95% CI: 11%, 49%) Understanding nutritional epidemiology 13 a t F O R
  • 55. m http://advances.nutrition.org/ increase in IHD risk (116). A follow-up review combined both observational and experimental findings and provided convincing evidence of a causal link between TFAs and IHD (38). New York City and other city and state governments have banned use of trans fats in restaurants and schools (117). It is now estimated that ~72% of trans fats have been removed from the US food supply (118), and as ex- pected, blood lipids have improved in both children and adults (119). In a recent analysis within New York State, rates of IHD declined faster in municipalities that banned trans fat than in those that did not, and it is estimated that this prevented between 518 and 1037 deaths from IHD per year in New York State (120). It is estimated that a nationwide trans fat ban, by removing the remaining par- tially hydrogenated fats, would prevent between 6480 and 12,960 deaths from IHD annually in the United States (120). In 2013 the FDA took preliminary steps to phase out TFAs altogether by deeming them as not generally rec- ognized as safe (121). These 3 examples recount changes in public policies in the face of mounting evidence from multiple lines of re- search, and well-conducted observational studies have played a major role in shaping the policies. However, re- search is a slow and evolving process, and consensus is hard to achieve within a short timeframe. For substances that have shown potential harmful effects, even in the ab- sence of conclusive evidence, public health experts have sometimes appealed to the precautionary principle to ad-
  • 56. dress the concern. The principle states that when only lim- ited evidence is available, a substance is presumed to be harmful and the burden of proof falls upon the scientific community or the industry to demonstrate that the sub- stance is safe. Observational data are especially important in this regard because they often present the first reports of negative health outcomes associated with certain dietary or other environmental exposures. They are also usually the first to show lack of hypothesized harm, e.g., in the cases of total fat in the diet and v-6 FA intake, and thus can play a key role in resolving ongoing controversies (45, 122). Conclusions Nutritional epidemiology is far from being a perfect science, but with a thorough understanding of the discipline, valuable insights on diet and health outcomes can be obtained from free-living populations. Use of repeated measures and vali- dated FFQs is critical for the assessment of long-term dietary intake. Although measurement error is a key problem, careful study design and meticulously developed dietary assessment tools coupled with specific biomarkers and informed statisti- cal analysis can reduce its impact. Well-conducted RCTs can eliminate confounding and selection bias at baseline and are hence considered the highest level of evidence to infer causal- ity; however, the linear drug trial paradigm cannot be directly translated into nutritional research, in which change in one dietary component is typically accompanied by compensatory change in another component, and good compliance is often difficult to achieve in long-term studies. Thus, prospective co- hort studies, which are considered the strongest observational study design when well designed, are an irreplaceable compo- nent of nutritional research. Evidence from several types of studies, in particular prospective cohort studies of hard clin- ical endpoints and intervention trials of intermediate out- comes, in totality can be used to infer causality and inform
  • 57. policy. Summarizing this evidence in systematic reviews and meta-analyses can be especially helpful in understanding a vast evidence base and informing policy. However, meta- analyses and systematic reviews should be conducted with caution and interpreted in light of the broader context of the field. Although the future of nutritional epidemiology is bright, with large ongoing international cohorts around the world [e.g., EPIC (123) and UK Biobank (124)] collecting detailed FIGURE 2 A future direction in nutritional epidemiologic research: a systems epidemiology approach to the discovery of interactions between the exposome (all nongenetic elements to which we are exposed) and the quantifiable elements of the human physiome [Reproduced with permission from Franks et al. (130)]. 14 Satija et al. a t F O R T V A L L E
  • 60. epidemiologic methods and contribute to the understanding of diet and disease relations, it also faces many challenges. The scientific community must consider several emerging is- sues. First, diets are evolving, and researchers will have to adapt to the changing food, societal, and cultural landscapes by developing new approaches to assessing dietary changes in large and diverse populations. There is an increasing need to adopt the socioecologic model to address the widening food quality gap between the rich and the poor and to reduce health disparities that are associated with obesity and poor diet quality (125, 126). Second, the globalization of the food systems and chronic diseases signifies the need for greater focus on low and middle income countries, where nutrition and epidemiologic transitions are occurring at an unprecedented pace, in parallel with rapid economic devel- opment and urbanization. Third, the environmental impact of food consumption and production should be considered when formulating dietary guidelines and agricultural poli- cies. Fourth, there is a need to incorporate a life course ap- proach into nutritional epidemiology (127), studying the effects of nutrition over the entire lifecycle, from gestation to adult life, which would go beyond the prevailing practice of initiating studies in midlife and carrying out randomized trials for extremely short durations. Lastly, nutritional epidemiology can benefit considerably from the incorporation of recent developments in “omics” technology, which although having its own challenges, holds promise for advancing the field (128–130). “Omics” tech- nology refers to a collection of high-throughput methods for assessing a large number of genomic, epigenomic, tran- scriptomic, proteomic, and metabolomic traits from biolog- ical specimens. The integration of such technology into traditional nutritional epidemiology, or adopting a “systems epidemiology” approach (see Figure 2), can strengthen study designs and provide additional insights on mechanis-
  • 61. tic pathways, which the traditional epidemiologic approach is often unable to do. All of these areas require an interdis- ciplinary approach in which nutritional epidemiologic stud- ies will continue to play an indispensable role. Acknowledgments All authors read and approved the final manuscript. References 1. Taubes G. Epidemiology faces its limits. Science 1995;269:164–9. 2. Ioannidis JP. Implausible results in human nutrition research. BMJ 2013;347:f6698. 3. Archer E, Hand GA, Blair SN. Validity of U.S. nutritional surveillance: National Health and Nutrition Examination Survey caloric energy in- take data, 1971–2010. PLoS ONE 2013;8:e76632. 4. Flegal KM, Kit BK, Orpana H, Graubard BI. Association of all-cause mortality with overweight and obesity using standard body mass index categories: a systematic review and meta-analysis. JAMA 2013;309:71–82. 5. Chowdhury R, Warnakula S, Kunutsor S, Crowe F, Ward HA, Johnson L, Franco OH, Butterworth AS, Forouhi NG, Thompson SG, et al. As- sociation of dietary, circulating, and supplement fatty acids with cor- onary risk: a systematic review and meta-analysis. Ann Intern
  • 62. Med 2014;160:398–406. 6. Bittman M. Butter is back. The New York Times 2014 March 25. 7. Willett W. Nutritional epidemiology. 3rd ed. New York: Oxford Uni- versity Press; 2013. 8. Moshfegh AJ, Rhodes DG, Baer DJ, Murayi T, Clemens JC, Rumpler WV, Paul DR, Sebastian RS, Kuczynski KJ, Ingwersen LA, et al. The U.S. Department of Agriculture Automated Multiple-Pass Method re- duces bias in the collection of energy intakes. Am J Clin Nutr 2008;88: 324–32. 9. Bingham SACA, Cole TJ, Welch A, Runswick SA, Black AE, Thurnham D, Bates C, Khaw KT, Key TJ, Day NE. Methods for data collection at an individual level. In: Cameron M, Staverene WV, editors. Manual on methodology for food consumption studies. New York: Oxford Univer- sity Press; 1988. p. 53–106. 10. Pekkarinen M. Methodology in the collection of food consumption data. World Rev Nutr Diet 1970;12:145–71. 11. Hebert JR, Hurley TG, Chiriboga DE, Barone J. A comparison of se-
  • 63. lected nutrient intakes derived from three diet assessment methods used in a low-fat maintenance trial. Public Health Nutr 1998;1:207– 14. 12. De Keyzer W, Huybrechts I, De Vriendt V, Vandevijvere S, Slimani N, Van Oyen H, De Henauw S. Repeated 24-hour recalls versus dietary records for estimating nutrient intakes in a national food consump- tion survey. Food Nutr Res 2011;55:doi: 10.3402/fnr.v55i0.7307. 13. Hébert JR, Hurley TG, Steck SE, Miller DR, Tabung FK, Peterson KE, Kushi LH, Frongillo EA. Considering the value of dietary assessment data in informing nutrition-related health policy. Adv Nutr 2014;5: 447–55. 14. Guolo A. Robust techniques for measurement error correction: a re- view. Stat Methods Med Res 2008;17:555–80. 15. Hebert JR, Clemow L, Pbert L, Ockene IS, Ockene JK. Social desirabil- ity bias in dietary self-report may compromise the validity of dietary intake measures. Int J Epidemiol 1995;24:389–98. 16. Hebert JR, Ma Y, Clemow L, Ockene IS, Saperia G, Stanek EJ 3rd, Merriam PA, Ockene JK. Gender differences in social
  • 64. desirability and social approval bias in dietary self-report. Am J Epidemiol 1997;146:1046–55. 17. Hebert JR, Ebbeling CB, Matthews CE, Hurley TG, Ma Y, Druker S, Clemow L. Systematic errors in middle-aged women’s estimates of en- ergy intake: comparing three self-report measures to total energy ex- penditure from doubly labeled water. Ann Epidemiol 2002;12:577–86. 18. Preis SR, Spiegelman D, Zhao BB, Moshfegh A, Baer DJ, Willett WC. Application of a repeat-measure biomarker measurement error model to 2 validation studies: examination of the effect of within- person var- iation in biomarker measurements. Am J Epidemiol 2011;173:683–94. 19. Rosner B, Spiegelman D, Willett WC. Correction of logistic regression relative risk estimates and confidence intervals for measurement error: the case of multiple covariates measured with error. Am J Epidemiol 1990;132:734–45. 20. Spiegelman D, Zhao B, Kim J. Correlated errors in biased surrogates: study designs and methods for measurement error correction. Stat Med 2005;24:1657–82.
  • 65. 21. Willett WC, Stampfer MJ, Underwood BA, Speizer FE, Rosner B, Hennekens CH. Validation of a dietary questionnaire with plasma ca- rotenoid and alpha-tocopherol levels. Am J Clin Nutr 1983;38:631–9. 22. Ascherio A, Stampfer MJ, Colditz GA, Rimm EB, Litin L, Willett WC. Correlations of vitamin A and E intakes with the plasma concentra- tions of carotenoids and tocopherols among American men and women. J Nutr 1992;122:1792–801. 23. Conway JM, Ingwersen LA, Moshfegh AJ. Accuracy of dietary recall using the USDA five-step multiple-pass method in men: an observa- tional validation study. J Am Diet Assoc 2004;104:595–603. 24. Ferrari P, Friedenreich C, Matthews CE. The role of measurement er- ror in estimating levels of physical activity. Am J Epidemiol 2007;166: 832–40. 25. Adams SA, Matthews CE, Ebbeling CB, Moore CG, Cunningham JE, Fulton J, Hebert JR. The effect of social desirability and social ap- proval on self-reports of physical activity. Am J Epidemiol 2005;161: 389–98. Understanding nutritional epidemiology 15
  • 68. a d e d fro m http://advances.nutrition.org/ 26. Archer E, Hand GA, Hebert JR, Lau EY, Wang X, Shook RP, Fayad R, Lavie CJ, Blair SN. Validation of a novel protocol for calculating esti- mated energy requirements and average daily physical activity ratio for the US population: 2005–2006. Mayo Clin Proc 2013;88:1398–407. 27. Archer E, Shook RP, Thomas DM, Church TS, Katzmarzyk PT, Hebert JR, McIver KL, Hand GA, Lavie CJ, Blair SN. 45-Year trends in women’s use of time and household management energy expenditure. PLoS ONE 2013;8:e56620. 28. Wang DD, Leung CW, Li Y, Ding EL, Chiuve SE, Hu FB, Willett WC. Trends in dietary quality among adults in the United States, 1999 through 2010. JAMA Intern Med 2014;174:1587–95. 29. Cade J, Thompson R, Burley V, Warm D. Development,
  • 69. validation and utilisation of food-frequency questionnaires—a review. Public Health Nutr 2002;5:567–87. 30. Subar AF, Thompson FE, Kipnis V, Midthune D, Hurwitz P, McNutt S, McIntosh A, Rosenfeld S. Comparative validation of the Block, Willett, and National Cancer Institute food frequency questionnaires: the Eating at America’s Table Study. Am J Epidemiol 2001;154:1089–99. 31. Kaaks RJ. Biochemical markers as additional measurements in studies of the accuracy of dietary questionnaire measurements: conceptual is- sues. Am J Clin Nutr 1997;65(Suppl 4):1232S–9S. 32. Giovannucci E, Goldin B. The role of fat, fatty acids, and total energy intake in the etiology of human colon cancer. Am J Clin Nutr 1997;66 (Suppl 6):1564S–71S. 33. Giovannucci E, Stampfer MJ, Colditz GA, Manson JE, Rosner BA, Longnecker M, Speizer FE, Willett WC. A comparison of prospective and retrospective assessments of diet in the study of breast cancer. Am J Epidemiol 1993;137:502–11. 34. Hernán MA, Robins JM. Estimating causal effects from epidemiolog-
  • 70. ical data. J Epidemiol Community Health 2006;60:578–86. 35. Hill AB. The environment and disease: association or causation? Proc R Soc Med 1965;58:295–300. 36. Malik VS, Hu FB. Sweeteners and risk of obesity and type 2 diabetes: the role of sugar-sweetened beverages. Curr Diab Rep 2012;12:195– 203. 37. Jacobs DR, Jr., Gallaher DD. Whole grain intake and cardiovascular disease: a review. Curr Atheroscler Rep 2004;6:415–23. 38. Mozaffarian D, Aro A, Willett WC. Health effects of trans- fatty acids: experimental and observational evidence. Eur J Clin Nutr 2009;63 (Suppl 2):S5–21. 39. Jacobs DR, Jr., Gross MD, Tapsell LC. Food synergy: an operational concept for understanding nutrition. Am J Clin Nutr 2009;89: 1543S–8S. 40. Jacobs DR, Jr. What comes first: the food or the nutrient? Executive summary of a symposium. J Nutr 2014;144(Suppl 4):543S–6S. 41. Sofi F, Abbate R, Gensini GF, Casini A. Accruing evidence on benefits of adherence to the Mediterranean diet on health: an updated system- atic review and meta-analysis. Am J Clin Nutr 2010;92:1189–
  • 71. 96. 42. Hu FB, Stampfer MJ. Nut consumption and risk of coronary heart disease: a review of epidemiologic evidence. Curr Atheroscler Rep 1999;1:204–9. 43. Katan MB, Zock PL, Mensink RP. Dietary oils, serum lipoproteins, and coronary heart disease. Am J Clin Nutr 1995;61(Suppl 6): 1368S–73S. 44. Dauchet L, Amouyel P, Hercberg S, Dallongeville J. Fruit and vegetable consumption and risk of coronary heart disease: a meta-analysis of co- hort studies. J Nutr 2006;136:2588–93. 45. Hu FB, Manson JE, Willett WC. Types of dietary fat and risk of cor- onary heart disease: a critical review. J Am Coll Nutr 2001;20:5–19. 46. Quiñones M, Miguel M, Aleixandre A. Beneficial effects of polyphe- nols on cardiovascular disease. Pharmacol Res 2013;68:125–31. 47. Bredsdorff L, Obel T, Dethlefsen C, Tjonneland A, Schmidt EB, Rasmussen SE, Overvad K. Urinary flavonoid excretion and risk of acute coronary syndrome in a nested case-control study. Am J Clin Nutr 2013;98:209–16.
  • 72. 48. Joensen AM, Overvad K, Dethlefsen C, Johnsen SP, Tjonneland A, Rasmussen LH, Schmidt EB. Marine n-3 polyunsaturated fatty acids in adipose tissue and the risk of acute coronary syndrome. Circulation 2011;124:1232–8. 49. Mozaffarian D, Clarke R. Quantitative effects on cardiovascular risk factors and coronary heart disease risk of replacing partially hydroge- nated vegetable oils with other fats and oils. Eur J Clin Nutr 2009;63 (Suppl 2):S22–33. 50. Dansinger ML, Gleason JA, Griffith JL, Selker HP, Schaefer EJ. Com- parison of the Atkins, Ornish, Weight Watchers, and Zone diets for weight loss and heart disease risk reduction: a randomized trial. JAMA 2005;293:43–53. 51. Stern L, Iqbal N, Seshadri P, Chicano KL, Daily DA, McGrory J, Williams M, Gracely EJ, Samaha FF. The effects of low- carbohydrate versus conventional weight loss diets in severely obese adults: one- year follow-up of a randomized trial. Ann Intern Med 2004;140:778–85. 52. Rubin DB. Inference and missing data. Biometrika 1976;63:581–92. 53. Willett WC. The WHI joins MRFIT: a revealing look
  • 73. beneath the covers. Am J Clin Nutr 2010;91:829–30. 54. Willett WC, Stampfer MJ. Dietary fat and cancer: another view. Can- cer Causes Control 1990;1:103–9. 55. Hu FB, Willett WC. Optimal diets for prevention of coronary heart disease. JAMA 2002;288:2569–78. 56. Blumberg J, Heaney RP, Huncharek M, Scholl T, Stampfer M, Vieth R, Weaver CM, Zeisel SH. Evidence-based criteria in the nutritional con- text. Nutr Rev 2010;68:478–84. 57. Steinhubl SR. Why have antioxidants failed in clinical trials? Am J Cardiol 2008;101:14D–9D. 58. Wiseman MJ, Jackson AA. Interpreting nutrition research – more complex than apparent plausibility. Electronic response to Ioannidis JP, Implausible results in human nutrition research. BMJ 2013;347: f6698. 59. Anglemyer A, Horvath HT, Bero L. Healthcare outcomes assessed with observational study designs compared with those assessed in ran- domized trials. Cochrane Database Syst Rev 2014;4:MR000034.
  • 74. 60. Estruch R, Ros E, Salas-Salvado J, Covas MI, Corella D, Aros F, Go- mez-Gracia E, Ruiz-Gutierrez V, Fiol M, Lapetra J, et al. Primary pre- vention of cardiovascular disease with a Mediterranean diet. N Engl J Med 2013;368:1279–90. 61. Fardet A, Rock E. Toward a new philosophy of preventive nutrition: from a reductionist to a holistic paradigm to improve nutritional rec- ommendations. Adv Nutr 2014;5:430–46. 62. Rose G, Hamilton PJ. A randomised controlled trial of the effect on middle-aged men of advice to stop smoking. J Epidemiol Community Health 1978;32:275–81. 63. Greenhalgh T. Getting your bearings: what is this paper about? How to read a paper: the basics of evidence-based medicine. London: BMJ Books; 2014. p. 41. 64. Guyatt GH, Sackett DL, Sinclair JC, Hayward R, Cook DJ, Cook RJ. Users’ guides to the medical literature. IX. A method for grading health care recommendations. Evidence-Based Medicine Working Group. JAMA 1995;274:1800–4. 65. Egger M, Davey Smith G, Schneider M, Minder C. Bias in meta-analysis detected by a simple, graphical test. BMJ 1997;315:629–34.
  • 75. 66. Duval S, Tweedie R. Trim and fill: a simple funnel-plot- based method of testing and adjusting for publication bias in meta-analysis. Biomet- rics 2000;56:455–63. 67. Cooper HM, Hedges LV, Valentine JC editors. The handbook of re- search synthesis and meta-analysis. 2nd ed. New York: Russell Sage Foundation; 2009. 68. Andres R, Muller DC, Sorkin JD. Long-term effects of change in body weight on all-cause mortality. A review. Ann Intern Med 1993;119: 737–43. 69. Lee IM, Paffenbarger RS, Jr. Is weight loss hazardous? Nutr Rev 1996; 54:S116–24. 70. Berrington de Gonzalez A, Hartge P, Cerhan JR, Flint AJ, Hannan L, MacInnis RJ, Moore SC, Tobias GS, Anton-Culver H, Freeman LB, et al. Body-mass index and mortality among 1.46 million white adults. N Engl J Med 2010;363:2211–9. 16 Satija et al. a t F
  • 78. d fro m http://advances.nutrition.org/ 71. Whitlock G, Lewington S, Sherliker P, Clarke R, Emberson J, Halsey J, Qizilbash N, Collins R, Peto R. Body-mass index and cause- specific mortality in 900,000 adults: collaborative analyses of 57 prospective studies. Lancet 2009;373:1083–96. 72. Manson JE, Stampfer MJ, Hennekens CH, Willett WC. Body weight and longevity. A reassessment. JAMA 1987;257:353–8. 73. Manson JE, Willett WC, Stampfer MJ, Colditz GA, Hunter DJ, Hankinson SE, Hennekens CH, Speizer FE. Body weight and mor- tality among women. N Engl J Med 1995;333:677–85. 74. Austin GL, Ogden LG, Hill JO. Trends in carbohydrate, fat, and pro- tein intakes and association with energy intake in normal- weight, overweight, and obese individuals: 1971–2006. Am J Clin Nutr 2011;93:836–43. 75. Vergnaud AC, Norat T, Mouw T, Romaguera D, May AM, Bueno-
  • 79. de-Mesquita HB, van der AD, Agudo A, Wareham N, Khaw KT, et al. Macronutrient composition of the diet and prospective weight change in participants of the EPIC-PANACEA study. PLoS ONE 2013;8: e57300. 76. Hu FB, Stampfer MJ, Manson JE, Rimm E, Colditz GA, Rosner BA, Hennekens CH, Willett WC. Dietary fat intake and the risk of coro- nary heart disease in women. N Engl J Med 1997;337:1491–9. 77. Hu FB. Are refined carbohydrates worse than saturated fat? Am J Clin Nutr 2010;91:1541–2. 78. Introduction. Diabetes Care 2008;31(Suppl 1):S1–2. 79. Silber S. A new and rapid scoring system to assess the scientific evi- dence from clinical trials. J Interv Cardiol 2006;19:485–92. 80. U.S. Preventive Services Task Force [Internet]. Grade definitions [cited 2014 Aug 30]. Available from: http://www.uspreventiveservices- taskforce.org/uspstf/grades.htm#post. 81. U.S. FDA [Internet]. Guidance for industry: evidence-based review system for the scientific evaluation of health claims—final [updated 2014 Jul 9; cited 2014 Aug 30]. Available from: http://www.fda. gov/Food/GuidanceRegulation/GuidanceDocumentsRegulatoryIn
  • 80. - formation/ucm073332.htm#system. 82. Spahn JM, Lyon JM, Altman JM, Blum-Kemelor DM, Essery EV, Fungwe TV, Macneil PC, McGrane MM, Obbagy JE, Wong YP. The systematic review methodology used to support the 2010 Dietary Guidelines Advisory Committee. J Am Diet Assoc 2011;111:520–3. 83. Smithells RW, Sheppard S, Schorah CJ, Seller MJ, Nevin NC, Harris R, Read AP, Fielding DW. Possible prevention of neural-tube defects by periconceptional vitamin supplementation. Lancet 1980;1:339– 40. 84. Bower C, Stanley FJ. Dietary folate as a risk factor for neural-tube de- fects: evidence from a case-control study in Western Australia. Med J Aust 1989;150:613–9. 85. Mulinare J, Cordero JF, Erickson JD, Berry RJ. Periconceptional use of multivitamins and the occurrence of neural tube defects. JAMA 1988; 260:3141–5. 86. Shaw GM, Schaffer D, Velie EM, Morland K, Harris JA. Periconcep- tional vitamin use, dietary folate, and the occurrence of neural tube defects. Epidemiology 1995;6:219–26.
  • 81. 87. Werler MM, Shapiro S, Mitchell AA. Periconceptional folic acid expo- sure and risk of occurrent neural tube defects. JAMA 1993;269:1257– 61. 88. Milunsky A, Jick H, Jick SS, Bruell CL, MacLaughlin DS, Rothman KJ, Willett W. Multivitamin/folic acid supplementation in early pregnancy reduces the prevalence of neural tube defects. JAMA 1989;262:2847– 52. 89. Wald NJ, Hackshaw AD, Stone R, Sourial NA. Blood folic acid and vi- tamin B12 in relation to neural tube defects. Br J Obstet Gynaecol 1996;103:319–24. 90. MRC Vitamin Study Research Group. Prevention of neural tube de- fects: results of the Medical Research Council Vitamin Study. Lancet 1991;338:131–7. 91. Czeizel AE, Dudas I. Prevention of the first occurrence of neural-tube defects by periconceptional vitamin supplementation. N Engl J Med 1992;327:1832–5. 92. Beresford SA. How do we get enough folic acid to prevent some neu- ral tube defects? Am J Public Health 1994;84:348–50.
  • 82. 93. Rayburn WF, Stanley JR, Garrett ME. Periconceptional folate intake and neural tube defects. J Am Coll Nutr 1996;15:121–5. 94. Wald NJ. Folic acid and neural tube defects: the current evidence and implications for prevention. Ciba Found Symp 1994;181:192– 208. 95. Willett WC. Folic acid and neural tube defect: can’t we come to clo- sure? Am J Public Health 1992;82:666–8. 96. Honein MA, Paulozzi LJ, Mathews TJ, Erickson JD, Wong LY. Impact of folic acid fortification of the US food supply on the occurrence of neural tube defects. JAMA 2001;285:2981–6. 97. Malik VS, Schulze MB, Hu FB. Intake of sugar-sweetened beverages and weight gain: a systematic review. Am J Clin Nutr 2006;84:274–88. 98. Vartanian LR, Schwartz MB, Brownell KD. Effects of soft drink con- sumption on nutrition and health: a systematic review and meta- analysis. Am J Public Health 2007;97:667–75. 99. Malik VS, Popkin BM, Bray GA, Despres JP, Willett WC, Hu FB. Sugar-sweetened beverages and risk of metabolic syndrome and type 2 diabetes: a meta-analysis. Diabetes Care 2010;33:2477– 83.
  • 83. 100. Huang C, Huang J, Tian Y, Yang X, Gu D. Sugar sweetened beverages consumption and risk of coronary heart disease: a meta-analysis of prospective studies. Atherosclerosis 2014;234:11–6. 101. Ebbeling CB, Feldman HA, Chomitz VR, Antonelli TA, Gortmaker SL, Osganian SK, Ludwig DS. A randomized trial of sugar- sweetened bev- erages and adolescent body weight. N Engl J Med 2012;367:1407–16. 102. de Ruyter JC, Olthof MR, Seidell JC, Katan MB. A trial of sugar-free or sugar-sweetened beverages and body weight in children. N Engl J Med 2012;367:1397–406. 103. Brownell KD, Farley T, Willett WC, Popkin BM, Chaloupka FJ, Thompson JW, Ludwig DS. The public health and economic benefits of taxing sugar-sweetened beverages. N Engl J Med 2009;361:1599–605. 104. Brownell KD, Frieden TR. Ounces of prevention—the public policy case for taxes on sugared beverages. N Engl J Med 2009;360:1805–8. 105. University of North Carolina at Chapel Hill Food Research Program [Internet]. Evaluation of 2014 SSB & non-essential foods taxes in
  • 84. Mexico [cited 2014 Aug 30]. Available from: http://uncfoodresearch- program.web.unc.edu/projects/mexico-tax-eval/. 106. Guthrie A. Mexico soda tax dents Coke bottler’s sales. The Wall Street Journal 2014 Feb 26. 107. Bloomberg [Internet]. New York soda size limit statute barred by state judge [updated 2013 Mar 11; cited 2014 Aug 30]. Available from: http: //www.bloomberg.com/news/2013-03-11/new-york-city-soda- size- limitations-barred-by-state-court-judge.html. 108. CDC. Competitive foods and beverages in U.S. schools: a state policy analysis. Atlanta, GA: U.S. Department of Health and Human Ser- vices; 2012. 109. CityofBoston.gov [Internet press release]. Mayor Menino issues order to end sugary drink sales on city property [updated 2011 Apr 7; cited 2014 Aug 30]. Available from: http://www.cityofboston.gov/ news/default.aspx?id=5051. 110. Anderson JT, Grande F, Keys A. Essential fatty acids, degree of unsa- turation, and effect of corn (maize) oil on the serum-cholesterol level in man. Lancet 1957;272:66–8. 111. Keys A, Anderson JT, Grande F. Prediction of serum-
  • 85. cholesterol re- sponses of man to changes in fats in the diet. Lancet 1957;273:959–66. 112. Mensink RP, Katan MB. Effect of dietary trans fatty acids on high- density and low-density lipoprotein cholesterol levels in healthy sub- jects. N Engl J Med 1990;323:439–45. 113. Willett WC, Stampfer MJ, Manson JE, Colditz GA, Speizer FE, Rosner BA, Sampson LA, Hennekens CH. Intake of trans fatty acids and risk of coronary heart disease among women. Lancet 1993;341:581– 5. 114. Willett WC, Ascherio A. Trans fatty acids: are the effects only margi- nal? Am J Public Health 1994;84:722–4. 115. U.S. FDA [Internet]. Trans fat now listed with saturated fat and cho- lesterol [updated 2013 Dec 17; cited 2014 Aug 30]. Available from: http://www.fda.gov/food/ingredientspackaginglabeling/labeling nutrition/ ucm274590.htm. 116. Mozaffarian D, Katan MB, Ascherio A, Stampfer MJ, Willett WC. Trans fatty acids and cardiovascular disease. N Engl J Med 2006; 354:1601–13. Understanding nutritional epidemiology 17
  • 88. a d e d fro m http://advances.nutrition.org/ 117. Mello MM. New York City’s war on fat. N Engl J Med 2009;360:2015–20. 118. Dietz WH, Scanlon KS. Eliminating the use of partially hydrogenated oil in food production and preparation. JAMA 2012;308:143–4. 119. Carroll MD, Kit BK, Lacher DA, Shero ST, Mussolino ME. Trends in lipids and lipoproteins in US adults, 1988–2010. JAMA 2012;308:1545–54. 120. Restrepo B, Rieger M. Trans fat and cardiovascular disease mortality: evidence from bans in restaurants in New York. Italy: European Uni- versity Institute, Max Weber Programme; 2014. 121. Federal Register [Internet]. Washington (DC): National Archives and Records Administration; 2013 [2014 Aug 19]. Available from: https://www. federalregister.gov/articles/2013/11/08/2013-26854/tentative-
  • 89. determination- regarding-partially-hydrogenated-oils-request-for-comments- and-for. 122. Harris WS, Mozaffarian D, Rimm E, Kris-Etherton P, Rudel LL, Appel LJ, Engler MM, Engler MB, Sacks F. Omega-6 fatty acids and risk for cardiovascular disease: a science advisory from the American Heart As- sociation Nutrition Subcommittee of the Council on Nutrition, Physical Activity, and Metabolism; Council on Cardiovascular Nursing; and Council on Epidemiology and Prevention. Circulation 2009;119:902–7. 123. International Agency for Research on Cancer [Internet]. EPIC Study [cited 2014 Aug 29]. Available from: http://epic.iarc.fr/. 124. UK Biobank [Internet] [cited 2014 Aug 29]. Available from: http: //www.ukbiobank.ac.uk/. 125. Sallis JF, Owen N, Fisher EB. Ecological models of health behavior. In: Glanz K, Rimer BK, Viswanath K, editors. Health behavior and health education: theory, research, and practice. San Francisco, CA: Jossey- Bass; 2008. p. 465–86. 126. Brug J, Oenema A, Ferreira I. Theory, evidence and intervention map- ping to improve behavior nutrition and physical activity
  • 90. interventions. Int J Behav Nutr Phys Act 2005;2:2. 127. Ben-Shlomo Y, Kuh D. A life course approach to chronic disease ep- idemiology: conceptual models, empirical challenges and interdiscipli- nary perspectives. Int J Epidemiol 2002;31:285–93. 128. Hu FB. Metabolic profiling of diabetes: from black-box epidemiology to systems epidemiology. Clin Chem 2011;57:1224–6. 129. Cornelis MC, Hu FB. Systems epidemiology: a new direction in nutrition and metabolic disease research. Curr Nutr Rep 2013;2: 225–35. 130. Franks PW, Pearson E, Florez JC. Gene-environment and gene-treatment interactions in type 2 diabetes: progress, pitfalls, and prospects. Diabetes Care 2013;36:1413–21. 18 Satija et al. a t F O R T V A