myDIALS Sales Analysis Module Data Sheet
•
0 likes•208 views

myDIALS Sales Analysis Module Data Sheet
Recommended

Recommended
More Related Content
What's hot
What's hot (17)
Similar to myDIALS Sales Analysis Module Data Sheet
Similar to myDIALS Sales Analysis Module Data Sheet (20)
Recently uploaded
Recently uploaded (20)
myDIALS Sales Analysis Module Data Sheet
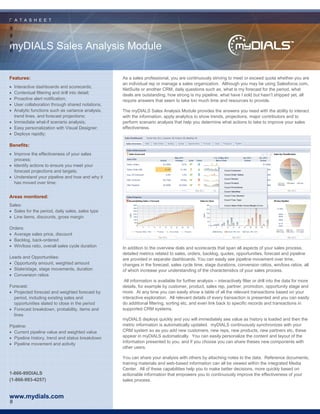
- 1. D A T A S H E E T myDIALS Sales Analysis Module Features: As a sales professional, you are continuously striving to meet or exceed quota whether you are an individual rep or manage a sales organization. Although you may be using Salesforce.com, • Interactive dashboards and scorecards; NetSuite or another CRM, daily questions such as, what is my forecast for the period, what • Contextual filtering and drill into detail; deals are outstanding, how strong is my pipeline, what have I sold but hasn’t shipped yet, all • Proactive alert notification; require answers that seem to take too much time and resources to provide. • User collaboration through shared notations; • Analytic functions such as variance analysis, The myDIALS Sales Analysis Module provides the answers you need with the ability to interact trend lines, and forecast projections; with the information, apply analytics to show trends, projections, major contributors and to • Immediate what-if scenario analysis; perform scenario analysis that help you determine what actions to take to improve your sales • Easy personalization with Visual Designer; effectiveness. • Deploys rapidly; Benefits: • Improve the effectiveness of your sales process; • Identify actions to ensure you meet your forecast projections and targets; • Understand your pipeline and how and why it has moved over time; Areas monitored: Sales: • Sales for the period, daily sales, sales type • Line items, discounts, gross margin Orders: • Average sales price, discount • Backlog, back-ordered • Win/loss ratio, overall sales cycle duration In addition to the overview dials and scorecards that span all aspects of your sales process, detailed metrics related to sales, orders, backlog, quotes, opportunities, forecast and pipeline Leads and Opportunities: are provided in separate dashboards. You can easily see pipeline movement over time, • Opportunity amount, weighted amount changes in the forecast, sales cycle time, stage durations, conversion ratios, win/loss ratios, all • State/stage, stage movements, duration of which increase your understanding of the characteristics of your sales process. • Conversion ratios All information is available for further analysis – interactively filter or drill into the data for more Forecast: details, for example by customer, product, sales rep, partner, promotion, opportunity stage and • Projected forecast and weighted forecast by more. At any time you can easily show a table of all the relevant transactions based on your period, including existing sales and interactive exploration. All relevant details of every transaction is presented and you can easily opportunities slated to close in the period do additional filtering, sorting etc, and even link back to specific records and transactions in • Forecast breakdown, probability, items and supported CRM systems. lines myDIALS deploys quickly and you will immediately see value as history is loaded and then the Pipeline: metric information is automatically updated. myDIALS continuously synchronizes with your • Current pipeline value and weighted value CRM system so as you add new customers, new reps, new products, new partners etc, these • Pipeline history, trend and status breakdown appear in myDIALS automatically. You can easily personalize the content and layout of the • Pipeline movement and activity information presented to you, and if you choose you can share theses new components with other users. You can share your analysis with others by attaching notes to the data. Reference documents, training materials and web-based information can all be viewed within the integrated Media Center. All of these capabilities help you to make better decisions, more quickly based on 1-866-99DIALS actionable information that empowers you to continuously improve the effectiveness of your (1-866-993-4257) sales process. www.mydials.com