Temperature characteristics of fiber optic gyroscope sensing coils
NozzleBurnThrough
1. 0 1 2 3 4 5 6 7 8 9 10 11 12
0
0.1
0.2
0.3
0.4
0.5
0.6
0.7
Distance from the nozzle throat, in
ThicknessofopenGCP,in
CCP
GCP
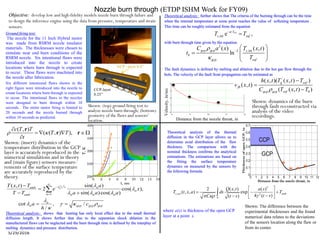
Theoretical analysis: further shows that The criteria of the burning through can be the time
when the internal temperature at some point reaches the value of softening temperature .
This time can be roughly estimated from the equation
with burn through time given by the equation
The fault dynamics is defined by melting and ablation due to the hot gas flow through the
hole. The velocity of the fault front propagation can be estimated as
0 2 4 6 8 10 12 14 16
298
348
398
448
498
t, sec
T,K
5/29/2016
Nozzle burn through (ETDP ISHM Work for FY09)
Ground firing test:
The nozzle for the 11 Inch Hybrid motor
was made from RSRM nozzle insulator
materials. The thicknesses were chosen to
simulate near end burn conditions of the
RSRM nozzle. Six intentional flaws were
introduced into the nozzle to create
locations where burn through is expected
to occur. These flaws were machined into
the nozzle after fabrication.
Six different intentional flaws shown in the
right figure were introduced into the nozzle to
create locations where burn through is expected
to occur. The intentional flaws in the nozzles
were designed to burn through within 10
seconds. The entire motor firing is limited to
20 seconds and the nozzle burned through
within 10 seconds as predicted.
Objective: develop low and high-fidelity models nozzle burn through failure and
to design the inference engine using the data from pressure, temperature and strain
sensors.
Shown: (top) ground firing test to
analyze nozzle burn through; (bottom)
geometry of the flaws and sensors’
location.
CCP-layer
0.25”
GCP –layer 0.4”
( , )
( ( , ) ),
c T T
T T
t
ρ κ
∂
= ∇ ∇ ∈Ω
∂
r
r r
Theoretical analysis: shows that heating has only local effect due to the small thermal
diffusion length. It shows further that due to the separation shock ablation in the
manufactured flaws can be neglected and the burn through time is defined by the interplay of
melting dynamics and pressure distribution.
Shown: (insert) dynamics of the
temperature distribution in the GCP
layer is accurately reproduced in the
numerical simulations and in theory
and (main figure) sensors measure-
rements of the surface temperature
are accurately reproduced by the
theory.
2
,int2
( ) ( , )
ln
gcp gcp s
b
gcp sof
C a x T x t
t
T
ρ
κ
−
=
8 9 10 11 12
0
1
2
3
4
v x( )
x
Velocity,in/sec
Distance from the nozzle throat, in
Shown: dynamics of the burn
through fault reconstructed via
analysis of the video
recordings.
2 2
1
( , ) sin( )
2 cos( ),
sin( )cos( )
cot , /
/
n tamb n
n
namb n n
gcp gc
n
n
n p gcp
T x t T a
a a aT
a
x
c
e
T
h
γλ λ
λ
λ λ λ
λ
λ γ
κ
κ ρ
∞
−
=
−
=
− +
==
∑
/
,int e ,Da L
s sofT T−
=
/
0
( , )( ( , ) )
( , )
( ( , ) )
g sof
fb
gcp gcp sof
h x t T x t T
v x t
C T x t Tρ
−
=
−
Shown: The difference between the
experimental thicknesses and the found
numerical data relates to the deviations
of the sensors location along the flaw or
from its center.
2
, 2
0
2 ( , ) ( )
( , , ) exp
4 ( )( )
t
s ext amb
Q x t a x
T t x a ds T
t sC t s γπ κρ
= − + −−
∫
where a(x) is thickness of the open GCP
layer at a point x.
Theoretical analysis of the thermal
diffusion in the GCP layer allows us to
determine axial distribution of the flaw
thickness. The comparison with the
nominal thickness confirms the analytical
estimations. The estimations are based on
the fitting the surface temperature
dynamics on measured by the sensors by
the following formula
2. 5/29/2016
Nozzle burn through (ETDP ISHM Work for FY09)
Key Accomplishment/Deliverable/Milestone:
•First successful experiment was performed by ATK & MSFC to analyze
nozzle burn through fault. A large number of sensors were tested.
Experimental time-series data were analyzed analytically and accurately
reproduced using high-fidelity simulations.
Significance:
The ISHM algorithm for earlier warning was suggested using strain gauges
situated at the external surface of the nozzle. An optimal placement
configuration was analyzed using analytical estimations and high-fidelity
simulations.
CRACK
LOCATION
0 1 2 3 4 5 6
-100
300
700
1100
1500
Time, sec
Strain,uS
nsh1-4.73in (exp)
nsh2-3.43in (exp)
nsh3-2.13in (exp)
nsa5-4.0in (exp)
nsh1-4.73in (sim)
nsh2-3.43in (sim)
nsh3-2.13in (sim)
nsa5-4.0in (sim)
Comparison with the experimental
time-traces of the strain for 4 sensors
with the results of numerical
simulations shows that the main
contribution to the strain is due to the
thermal expansion of the nozzle walls
subject to the heat flux from the gas
flow. The sudden jumps of the strain
can be qualitatively reproduced in
numerical simulations.
0 50 100 150 200 250 300 350
-40
-20
0
20
40
60
80
100
Angle [deg]
Strain[µS]
1 cm
2 cm
4 cm
8 cm
An approximate angular localization of the strain deviation
for the crack length 1 cm (depth 2.4 mm) is 150 deg
High-fidelity model: build in ABAQUS
accurately predicts distribution of the stress
and temperature in the nozzle. The model takes
into account heat flow and pressure on the
internal nozzle wall. The calculations are
performed consequently: first temperature
distribution due to the heat flow is found, next
stress distribution due to the pressure on the
wall for a given temperature field is
determined.
The origin of the flaw
Shown: 3D distribution of the strain at the
surface of the nozzle at 120° flaw. The
time-traces of the strain were calculated
along the path shown in the top figure by
black line.
The variation of the strain along the path
as a function of time is shown in the
bottom figure for the first 10 sec.
Note that in these simulations the burning
through the nozzle was neglected.
( )
( )( )
( ) ( )
( )
( )( )
( )( )
2 2 2
1* 1* 2* 2 2* 1*( )
2 2 2 2 2
2* 2 1* 1* 2 1* 2*
1* 2*2 2 ( ) 2 2
1* 1 2 1 2 1 1 12 2 2
2* 1* 2 2 1
2 1 1 1
( ) ( , ) ,
1
1 1 1
. ( ) ( ) , ( )
1 1
p
atm
T
R R R
R p x t p
R R E R R E
v v c c
where R R R I R c R c
v v R R R
ϕ
ϕ ϕ
ν ν ν
ε
ν
ε ε
− − + +
−
− − −
+ −
= = + + = +
+ −
( )
( )( ) ( )
( )
( )
( )
( )
( ) ( )
( )
( )
( ) ( )
1
2 22
2* 2* 2 0 2 1* 1 0 1*0 2 2
1 1 22 2 2 2 2 2
2*2* 2 1* 2 1* 2 1*
2 2
2*0 21* 2 1 2
2 1* 1 0 2* 2 022 2
2 2* 2*2* 1*
1
0 1 1 1
1
1 ( )
( ) ,
11
1( )( )
,
1 1
( )
( ) ( ) , (
r
R
T T R T T RI R R
c I R
R R R R R R
I RR R I R
c T T T T
RR R
dT r
I r A r dr I
dr
ν α α
νν
ν
α α
ν ν
− − −
− + −
−+ − − −
+
− − − − − − −−
= ∫ 1
2 0 2 2) ( )
r
R
r r I r dr= ∫
The lateral (hoop) strain of the external nozzle surface induced by the gas
pressure and temperature gradient is equal to where
)()( Tp
ϕϕ εεε +=
The analytical results of allows us to estimate the effect of the residual stress
and to analyze the strain of external surface of the nominal nozzle due to the
action of the gas pressure and the temperature gradient to test the results of the
numerical simulation.
Analysis shows: that observed strain jumps can be explained by the
release of the stress deformation state by the temperature rise inside the
nozzle and sharp decrease of tensile modulus of the GCP material at
T>460F
r
GCP in-plane Shear Modulus
t1
T(r,t)
r
zzσ
t2 >t2
t1
![5/29/2016
Nozzle burn through (ETDP ISHM Work for FY09)
Key Accomplishment/Deliverable/Milestone:
•First successful experiment was performed by ATK & MSFC to analyze
nozzle burn through fault. A large number of sensors were tested.
Experimental time-series data were analyzed analytically and accurately
reproduced using high-fidelity simulations.
Significance:
The ISHM algorithm for earlier warning was suggested using strain gauges
situated at the external surface of the nozzle. An optimal placement
configuration was analyzed using analytical estimations and high-fidelity
simulations.
CRACK
LOCATION
0 1 2 3 4 5 6
-100
300
700
1100
1500
Time, sec
Strain,uS
nsh1-4.73in (exp)
nsh2-3.43in (exp)
nsh3-2.13in (exp)
nsa5-4.0in (exp)
nsh1-4.73in (sim)
nsh2-3.43in (sim)
nsh3-2.13in (sim)
nsa5-4.0in (sim)
Comparison with the experimental
time-traces of the strain for 4 sensors
with the results of numerical
simulations shows that the main
contribution to the strain is due to the
thermal expansion of the nozzle walls
subject to the heat flux from the gas
flow. The sudden jumps of the strain
can be qualitatively reproduced in
numerical simulations.
0 50 100 150 200 250 300 350
-40
-20
0
20
40
60
80
100
Angle [deg]
Strain[µS]
1 cm
2 cm
4 cm
8 cm
An approximate angular localization of the strain deviation
for the crack length 1 cm (depth 2.4 mm) is 150 deg
High-fidelity model: build in ABAQUS
accurately predicts distribution of the stress
and temperature in the nozzle. The model takes
into account heat flow and pressure on the
internal nozzle wall. The calculations are
performed consequently: first temperature
distribution due to the heat flow is found, next
stress distribution due to the pressure on the
wall for a given temperature field is
determined.
The origin of the flaw
Shown: 3D distribution of the strain at the
surface of the nozzle at 120° flaw. The
time-traces of the strain were calculated
along the path shown in the top figure by
black line.
The variation of the strain along the path
as a function of time is shown in the
bottom figure for the first 10 sec.
Note that in these simulations the burning
through the nozzle was neglected.
( )
( )( )
( ) ( )
( )
( )( )
( )( )
2 2 2
1* 1* 2* 2 2* 1*( )
2 2 2 2 2
2* 2 1* 1* 2 1* 2*
1* 2*2 2 ( ) 2 2
1* 1 2 1 2 1 1 12 2 2
2* 1* 2 2 1
2 1 1 1
( ) ( , ) ,
1
1 1 1
. ( ) ( ) , ( )
1 1
p
atm
T
R R R
R p x t p
R R E R R E
v v c c
where R R R I R c R c
v v R R R
ϕ
ϕ ϕ
ν ν ν
ε
ν
ε ε
− − + +
−
− − −
+ −
= = + + = +
+ −
( )
( )( ) ( )
( )
( )
( )
( )
( ) ( )
( )
( )
( ) ( )
1
2 22
2* 2* 2 0 2 1* 1 0 1*0 2 2
1 1 22 2 2 2 2 2
2*2* 2 1* 2 1* 2 1*
2 2
2*0 21* 2 1 2
2 1* 1 0 2* 2 022 2
2 2* 2*2* 1*
1
0 1 1 1
1
1 ( )
( ) ,
11
1( )( )
,
1 1
( )
( ) ( ) , (
r
R
T T R T T RI R R
c I R
R R R R R R
I RR R I R
c T T T T
RR R
dT r
I r A r dr I
dr
ν α α
νν
ν
α α
ν ν
− − −
− + −
−+ − − −
+
− − − − − − −−
= ∫ 1
2 0 2 2) ( )
r
R
r r I r dr= ∫
The lateral (hoop) strain of the external nozzle surface induced by the gas
pressure and temperature gradient is equal to where
)()( Tp
ϕϕ εεε +=
The analytical results of allows us to estimate the effect of the residual stress
and to analyze the strain of external surface of the nominal nozzle due to the
action of the gas pressure and the temperature gradient to test the results of the
numerical simulation.
Analysis shows: that observed strain jumps can be explained by the
release of the stress deformation state by the temperature rise inside the
nozzle and sharp decrease of tensile modulus of the GCP material at
T>460F
r
GCP in-plane Shear Modulus
t1
T(r,t)
r
zzσ
t2 >t2
t1](data:image/gif;base64,R0lGODlhAQABAIAAAAAAAP///yH5BAEAAAAALAAAAAABAAEAAAIBRAA7)