
Recommended
More Related Content
Similar to 2019 10 3 Originality ReportinalityReportultraattemptI.docx
Similar to 2019 10 3 Originality ReportinalityReportultraattemptI.docx (20)
More from lorainedeserre
More from lorainedeserre (20)
Recently uploaded
Recently uploaded (20)
2019 10 3 Originality ReportinalityReportultraattemptI.docx
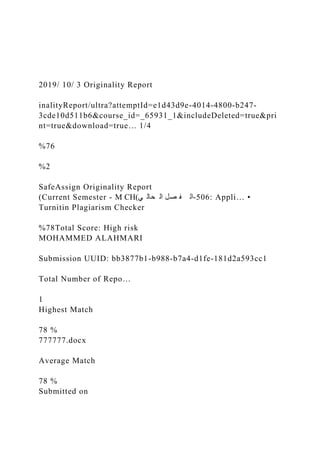
- 1. 2019/ 10/ 3 Originality Report inalityReport/ultra?attemptId=e1d43d9e-4014-4800-b247- 3cde10d511b6&course_id=_65931_1&includeDeleted=true&pri nt=true&download=true… 1/4 %76 %2 SafeAssign Originality Report (Current Semester - M CH)ي حال ال صل ف ال-506: Appli… • Turnitin Plagiarism Checker %78Total Score: High risk MOHAMMED ALAHMARI Submission UUID: bb3877b1-b988-b7a4-d1fe-181d2a593cc1 Total Number of Repo… 1 Highest Match 78 % 777777.docx Average Match 78 % Submitted on
- 2. 10/03/19 04:11 PM GMT+3 Average Word Count 591 Highest: 777777.docx %78Attachment 1 Global database (2) Student paper Student paper Internet (1) biol Top sources (3) Excluded sources (0) View Originality Report - Old Design Word Count: 591 777777.docx 1 2 3 1 Student paper 2 Student paper 3 biol https://lms.seu.edu.sa/webapps/mdb-sa- BBLEARN/originalityReport?attemptId=e1d43d9e-4014-4800- b247-
- 3. 3cde10d511b6&course_id=_65931_1&download=true&includeD eleted=true&print=true&force=true 2019/ 10/ 3 Originality Report inalityReport/ultra?attemptId=e1d43d9e-4014-4800-b247- 3cde10d511b6&course_id=_65931_1&includeDeleted=true&pri nt=true&download=true… 2/4 Source Matches (13) Homework statistics Title: Homework statistics chapter 7 Name: Date: Introduction: The most usual applications of Statistics is describing a set of data descriptive statistics, regression, and hypothesis testing and inferential statistics. The two main branches are descriptive and inferential statistics. People who do not have any formal training in statistics are more familiar with inferential statistics than with descriptive statistics. Descriptive Statistics Definition The descriptive statistics is the type of statistical analysis which helps to describes about the data in some meaningful way. The statistics is used to describe quantitatively about the important features of the data or information. The descriptive statistics gives the summaries of the given sample as well as the observations done. These summaries or descriptions can either be graphical or quantitative. Inferential Statistics Definition
- 4. Inferential statistics is the type of statistics which deals with making conclusions. It inferences about the predictions for the population. It also analyses the sample. Basically, the inferential statistics is the procedure of drawing predictions and conclusions about the given data which is subjected to the random variations. Inferential statistics includes detection and prediction of observational and sampling errors. This type of statistics is being utilized in order to make estimates and test the hypotheses using given data. There are two major divisions of inferential statistics: 1) Confidence Interval: The confidence interval is represented in the form of an interval that provides a range for the parameter of given population. 2) Hypothesis Test: Hypothesis tests are also known as tests of significance which tests some claim for the population by analyzing sample. In this paper we will focus on hypothesis to test the raw and make a logical conclusion for example The Framingham Heart Study dataset provided, using ANOVA multivariable linear regression analysis using BMI as a continuous variable. Before we conduct the regression and ANOVA test I would like to make the hypothesis. Null Hypothesis H0: The BMI is not related to the patient characteristics in the Framingham Heart Study. Alternative Hypothesis H1: The BMI is related to the patient characteristics in the Framingham Heart Study. Level of significance is 0.05 Before using excel I excluded participants with missing data on analysis variables (age, sex, systolic blood pressure, total serum cholesterol, current smoker, and diabetes = cleaning the data). To perform simple linear regression (ANOVA) I assumed BMI as independent variable and independent variables are age, sex, systolic blood pressure, total serum cholesterol, current smoker, and diabetes and SEX is coded
- 5. 1=male and 2=female. The output of the regression: From the regression output we can see that the significance F value is 0.500 which is less than 0.05, we reject Null hypothesis and concluded that the BMI is related to the patient characteristics in the Framingham Heart Study. The R-squared (R2) is a statistical measure that represents the proportion of the variance for a dependent variable that's explained by an independent variable or variables in a regression model. For this model the R square is 0.000 which indicates that there is 0% variance for a dependent variable that's explained by an independent variable or variables in a regression model. The significance of individual variable is given below. The individual variable is significance and concluded that for individual variable The BMI is related to the patient characteristics in the Framingham Heart Study. References Walpole, R. (1982). Introduction to Statistics. (3rd ed.). Prentice Hall Publication. Downie, N. M. & Heath, R. W. (1965). Basic Statistical Methods (2nd ed.). Harper & Row Publisher Reid, H. (2013, August). Introduction to Statistics. SAGE Publication. 1 2 1 2 2
- 6. 3 3 1 1 1 1 2019/ 10/ 3 Originality Report inalityReport/ultra?attemptId=e1d43d9e-4014-4800-b247- 3cde10d511b6&course_id=_65931_1&includeDeleted=true&pri nt=true&download=true… 3/4 Student paper 99% Student paper 100% Student paper 100% Student paper 90% Student paper 100% Student paper 100% Student paper 89%
- 7. biol 100% biol 64% Student paper 100% Student paper 100% 1 Student paper The most usual applications of Statistics is describing a set of data descriptive statistics, regression, and hypothesis testing and inferential statistics. The two main branches are descriptive and inferential statistics. People who do not have any formal training in statistics are more familiar with inferential statistics than with descriptive statistics. Descriptive Statistics Definition Original source
- 8. The most usual applications of Statistics is describing a set of data descriptive statistics hypothesis testing and inferential statistics The two main branches are descriptive and inferential statistics People who do not have any formal training in statistics are more familiar with inferential statistics than with descriptive statistics Descriptive Statistics Definition 1 Student paper The descriptive statistics is the type of statistical analysis which helps to describes about the data in some meaningful way. The statistics is used to describe quantitatively about the important features of the data or information. The descriptive statistics gives the summaries of the given sample as well as the observations done. These summaries or descriptions can either be graphical or quantitative.
- 9. Original source The descriptive statistics is the type of statistical analysis which helps to describes about the data in some meaningful way The statistics is used to describe quantitatively about the important features of the data or information The descriptive statistics gives the summaries of the given sample as well as the observations done These summaries or descriptions can either be graphical or quantitative 1 Student paper Inferential Statistics Definition Original source Inferential Statistics Definition 2 Student paper
- 10. Inferential statistics is the type of statistics which deals with making conclusions. It inferences about the predictions for the population. Original source Inferential statistics Inferential statistics is the type of statistics which deals with making conclusions It inferences about the predictions of the population 1 Student paper It also analyses the sample. Basically, the inferential statistics is the procedure of drawing predictions and conclusions about the given data which is subjected to the random variations. Inferential statistics includes detection and prediction of observational and sampling errors. This type of statistics is being utilized in order to make estimates and test the hypotheses using given
- 11. data. Original source It also analyses the sample Basically, the inferential statistics is the procedure of drawing predictions and conclusions about the given data which is subjected to the random variations Inferential statistics includes detection and prediction of observational and sampling errors This type of statistics is being utilized in order to make estimates and test the hypotheses using given data 2 Student paper There are two major divisions of inferential statistics: Original source There are two major divisions of inferential statistics 2
- 12. Student paper The confidence interval is represented in the form of an interval that provides a range for the parameter of given population. Original source it is represented in the form of an interval that provides a range for the parameter of given population 3 Student paper Null Hypothesis H0: Original source null hypothesis, H0 3 Student paper Alternative Hypothesis H1: Original source — alternative h., H1
- 13. 1 Student paper Introduction to Statistics. Original source Introduction to Statistics 1 Student paper Prentice Hall Publication. Original source Prentice Hall Publication 2019/ 10/ 3 Originality Report inalityReport/ultra?attemptId=e1d43d9e-4014-4800-b247- 3cde10d511b6&course_id=_65931_1&includeDeleted=true&pri nt=true&download=true… 4/4 Student paper 100% Student paper 100% 1
- 14. Student paper Basic Statistical Methods (2nd ed.). Harper & Row Publisher Original source Basic Statistical Methods (2nd ed.) Harper & Row Publisher 1 Student paper Introduction to Statistics. Original source Introduction to Statistics What Is Listening? Listening is the process of hearing someone speak, processing what you’re hearing, and demonstrating that you understand the speaker’s intent. Effective listening has three dimensions: sensing, processing/evaluating, and responding. Sensing involves hearing the words and receiving the nonverbal signals such as body language and facial expressions. Processing/evaluating involves understanding the meaning,
- 15. interpreting the implications, evaluating the nonverbal cues, and remembering the message. Responding involves the listener sending the speaker verbal or nonverbal signals that he or she is being heard. The act of simply “hearing” is a passive activity. The act of listening—truly listening— demands attention, concentration, and effort. There are several different types of listening: Passive listening occurs when you are trying to absorb as much of the information presented as possible. You act as a sponge, taking in the information with no or little attempt to process or enhance the messages being sent by the speaker. Attentive listening occurs when you are genuinely interested in the speaker’s point of view. You are aware something can be learned from the interaction. In attentive listening, you make assumptions about the messages being relayed by the speaker and fill in gaps with assumptions based on what you want to hear rather than on what the speaker is actually saying. At this level of listening, you don’t check to see whether what you heard is what the speaker intended to say. Many barriers and biases can hinder this form of interaction. Active or empathetic listening is the most powerful level of listening and requires the largest amount of work. In active listening, communication is a vibrant, two-way process that involves high levels of attentiveness, clarification, and message processing. In active listening, you not only hear and react to the words being spoken but also paraphrase, clarify, and give feedback to the speaker about the messages being received. Barriers to Effective Listening
- 16. Despite its importance in promoting effective communication, active listening is often neglected. Many factors contribute to difficulties in listening: ■ Physiological limitations. Listening can be fatiguing. We are visual beings—about 80 percent of learning occurs though sight. Because the eye is victorious over the ear in the constant process of providing stimulation to the mind, many people don’t know how to be effective listeners. ■ Speaking/listening gap. The average person speaks at a rate of 120–150 words per minute (wpm), while our brains have the capacity to process information at 275–300 wpm. We can think at up to 500 wpm, which is why it is easy to tune in and out of conversations. Optimal speaking rate is about 275–300 wpm even though the other person’s thinking rate is higher. One strategy to address this is to develop additional presentation techniques to hold the other person’s full attention. ■ Inadequate background information. Most listeners hate to admit when they haven’t heard all of the information necessary to engage in conversation, so they stumble along hoping to catch up. They seldom do. ■ Selective memory. Some employees treasure every accolade and never hear a single criticism. Others hear only the complaints and never the praise. We have a tendency to hear— and remember—what we want. There’s a reason ad agencies run commercials over and over on TV and on the Web. Without reinforcement of key messages, it’s easy to forget entirely or to remember only selectively what a company has paid millions for you to remember. Interestingly, steps taken to increase viewers’ recall, such as adding an attractive spokesperson or using flashy video, result in viewers remembering the attractive person and not the product or what it can do for them!
- 17. ■ Selective expectation. If you expect dishonesty, poor work attitudes, or inattention, you’ll probably get them. This is an example of the “self-fulfilling prophecy.” Many employees expect not to be listened to. So many managers are preoccupied with im- mediate tasks and seldom have the time to devote to individual employee concerns that employees become accustomed to not being heard and understood. Often, they’ll just give up and resign themselves to the short, nonattentive interactions with managers to which they’ve become accustomed, or withhold information, expecting it wouldn’t be attended to anyway. ■ Fear of being influenced or persuaded. Some managers hold certain beliefs so dear to their hearts that they are biased— unable to entertain another’s point of view about a matter. Typically, managers who feel this strongly about an issue have a tendency to turn off speakers who dispute their cherished beliefs even before the position is fully explained. ■ Bias and being judgmental. When you don’t like a person, it’s hard to hear what he or she says. Sometimes this bias is based on wrong or incomplete information, such as “She’s only 17, what could she know?” or “He’s a bigot, so why should I listen to him?” When we make a negative judgment about the speaker, we typically stop or severely curtail our desire to listen to the speaker. ■ Boredom. Thought processes are four to five times the usual speed of speech. When you can guess what an employee is going to say seconds or even minutes before he or she speaks, your thoughts wander. When you return, the speaker may have gone on an unexpected track whose beginnings you lost and whose point you never do understand. ■ Partial listening and distractions. You may hear the literal words, but miss the con- notation, facial expressions, or tone of
- 18. voice. In essence, you get only part of the message. Perhaps you were trying to remember an important point when an employee interrupts to ask if he or she can leave to deal with an emergency at home. Chances are you didn’t give that employee your full attention—even though your empathetic response to the situation would have gone a long way. ■ Rehearsing. Many of us use the time during another’s talking to come up with a bulletproof rebuttal. If you do this, you aren’t really listening. Sometimes we are so intent on winning an argument that the conversation veers in a different direction during our “rehearsal,” resulting in our losing the segue for and impact of our carefully crafted rebuttal. ■ Selective perception. Perception is the process by which you take in and process stim- uli according to your own experiences or attitudes. As such, you create your own real- ity, apart from what may actually be occurring. Since communication has a great deal of room for individual interpretation, from the meaning of words to the interpretation of nonverbal signals, your perception can easily distort the true message or its intent. Perception can be influenced by a number of factors such as your needs, opinions, personality, education, or environment. Selective perception is a process in which you select or pay attention to only that information that adheres to or reinforces your own beliefs, views, or needs, causing severe distortion of messages. ■ Interference from emotions. Communication is susceptible to interference by emotions. Though we use communication to express our emotions, not everyone is able to understand, control, or explain his or her feelings adequately or fully. Emotions are neither right nor wrong, but rather an expression of human reactions. By observing nonverbal cues, you are better able to interpret the true level and type of others’ emotional states. You can then utilize empathy to neutralize emotional
- 19. responses, paving the way to begin work on understanding the content of the communication. The emotional state of both the sender and the receiver must be considered in eliminating problems in the communication process. Nonverbal communication is conveying meaning or expressing feelings consciously or subconsciously through means other than words. Since most of us are visually oriented and live in an environment dominated by visual images, it is not surprising that research indicates that over 55 percent of interpersonal communication is conveyed nonverbally. Nonverbal communication cues fall into two broad classes. Nonverbal visual cues include facial expressions, eye blinks, eye contact, gaze aversion, nodding, smiles, postural shifts, physical positioning, and other bodily behaviors. Paraverbal communication cues include aspects related to speech, such as pitch, pauses, tone of voice, inflection, and voice volume. How often have you experienced talking with someone who says he or she is listening even though the person is watching television or texting? Or having someone say they agree to something while shaking their head in disagreement? Conversely, have you experienced empathy from someone as evidenced by the person nodding in support rather than sharing their agreement with you verbally? We often communicate nonverbally in ways that contradict what we’re saying verbally. Nonverbal messages are often sent sub-consciously, leading others to believe they hold more of the true meaning than the verbal message.
- 20. DECISION MAKING MATRIX Use the following table to choose four mutually exclusive options to pursue in the first year after your graduation from college. In other words, what will you do with your life after you graduate? Step 1. At the bottom of this page, briefly describe each option. Step 2 In the column entitled “Decision Factor,” briefly describe the aspect or criterion that differentiates each choice. For example, one decision factor might be “income in first year.” Another might be “intellectual challenge,” and so on. Bear in mind that each decision factor must be applicable (but not necessarily the best) for each outcome. For example, if one outcome option is to join the army, you cannot use a decision factor like “overcome fear of guns.” If you did, the only possible column that could get the check mark would be the one for “Join the army.” Step 3: Using the criteria in step 2, place an X in the column for each row that will most thoroughly fulfill that criterion/factor. That is, which option is the best for that decision factor? Step 4: Add the number of X’s in each column and record that number at the bottom of the table in each column. I WOULD PREFER some decisions factors would be: Getting a job as international student (going to Optional practical training -OPT) and some others you decide. Options ABCD TOTALS:
- 22. Option A: _____________________________________________________ _________________ Option B: _____________________________________________________ _________________ Option C: _____________________________________________________ _________________ Option D: _____________________________________________________ _________________ Questions to answer also : Based on your work with the decision-making process 1. Did you find it relevant/useful? 2. Would you use it regularly at work or personal? Why or why not?
- 23. Source: This exercise was developed and contributed to this book by Dr. Brian K. Miller, Assistant Professor, Management Program, College of Business, James Madison University, Harrisonburg, Virginia (2004). 2019/ 10/ 3 Originality Report iginalityReport/ultra?attemptId=7a105e6b-80c5-44c6-87ef- 123ca3ec27b1&course_id=_65931_1&includeDeleted=true&prin t=true&download=true… 1/3 %55 %4 SafeAssign Originality Report (Current Semester - M CH)ي حال ال صل ف ال-506: Appli… • Turnitin Plagiarism Checker
- 24. %59Total Score: High risk MOHAMMED ALAHMARI Submission UUID: 5b48c37e-347c-f0be-b568-ccdb58215387 Total Number of Repo… 1 Highest Match 59 % 999999.docx Average Match 59 % Submitted on 10/03/19 04:16 PM GMT+3 Average Word Count 471 Highest: 999999.docx %59Attachment 1 Global database (2) Student paper Student paper Internet (1) slideserve
- 25. Top sources (3) Excluded sources (0) View Originality Report - Old Design Word Count: 471 999999.docx 1 2 3 1 Student paper 3 slideserve 2 Student paper https://lms.seu.edu.sa/webapps/mdb-sa- BBLEARN/originalityReport?attemptId=7a105e6b-80c5-44c6- 87ef- 123ca3ec27b1&course_id=_65931_1&download=true&includeD eleted=true&print=true&force=true 2019/ 10/ 3 Originality Report iginalityReport/ultra?attemptId=7a105e6b-80c5-44c6-87ef- 123ca3ec27b1&course_id=_65931_1&includeDeleted=true&prin t=true&download=true… 2/3 Source Matches (7) Student paper 88% Student paper 100%
- 26. Homework statistics Title: Homework statistics chapter 9 Name: Date: Introduction: The most important application of statistics is describing the data using descriptive and inferential statistics. The two main branches are descriptive and inferential statistics. People who do not have any formal training in statistics are more familiar with inferential statistics than with descriptive statistics. (Walpole, 1982). The descriptive statistics is the type of statistical analysis which helps to describes about the data in some meaningful way. The statistics is used to describe quantitatively about the important features of the data or information. The descriptive statistics gives the summaries of the given sample as well as the observations done. These summaries or descriptions can either be graphical or quantitative. For example the data about Framingham Heart Study dataset provided, using descriptive summary we can make some logical conclusion about the data, The descriptive summary is given below for both male and female. For male data set: For Female data set: In this part using the provided Dataset, I will compare the risk factors in men and women where I will use the following patient characteristics: Age, systolic blood pressure, diastolic blood pressure, use of anti-hypertensive medication, current smoker, total serum cholesterol, mg/dL, body mass index (BMI), and diabetes, The means for each risk factor is given in the above descriptive summary table. 1) Hypothesis Test: Hypothesis tests are also known as tests of significance which tests some claim for the
- 27. population by analyzing sample. In this paper we will focus on hypothesis to test the raw and make a logical conclusion for example The Framingham Heart Study dataset provided, using T statistics. Null Hypothesis: H0 the risk factors for heart disease listed as patient characteristics are not related to if the patient is male or female in the Framingham Heart Study. Alternative Hypothesis: H1 the risk factors for heart disease listed as patient characteristics are related to if the patient is male or female in the Framingham Heart Study. Level of significance is 0.05 SEX is coded 1=male and 2=female. The output of the test is: The null hypothesis is rejected for SYSBP, AGE, DIABP, CURSMOKE and DIABETES For these variables we concluded that the risk factors for heart disease listed as patient characteristics are related to if the patient is male or female in the Framingham Heart Study. The null hypothesis is fail to reject for. TOTCHOL, BMI and CIGPDAY For these variables we concluded that the risk factors for heart disease listed as patient characteristics are not related to if the patient is male or female in the Framingham Heart Study. References Walpole, R. (1982). Introduction to Statistics. (3rd ed.). Prentice Hall Publication. Downie, N. M. & Heath, R. W. (1965). Basic Statistical Methods (2nd ed.). Harper & Row Publisher Reid, H. (2013, August). Introduction to Statistics. SAGE Publication. 1 1
- 28. 2 3 1 1 3 1 Student paper The most important application of statistics is describing the data using descriptive and inferential statistics. The two main branches are descriptive and inferential statistics. People who do not have any formal training in statistics are more familiar with inferential statistics than with descriptive statistics. Original source The most usual applications of Statistics is describing a set of data descriptive statistics hypothesis testing and inferential statistics The two main branches are descriptive and inferential statistics People who do
- 29. not have any formal training in statistics are more familiar with inferential statistics than with descriptive statistics 1 Student paper The descriptive statistics is the type of statistical analysis which helps to describes about the data in some meaningful way. The statistics is used to describe quantitatively about the important features of the data or information. The descriptive statistics gives the summaries of the given sample as well as the observations done. These summaries or descriptions can either be graphical or quantitative. Original source The descriptive statistics is the type of statistical analysis which helps to describes about the data in some meaningful way The statistics is used to describe quantitatively about the
- 30. important features of the data or information The descriptive statistics gives the summaries of the given sample as well as the observations done These summaries or descriptions can either be graphical or quantitative 2019/ 10/ 3 Originality Report iginalityReport/ultra?attemptId=7a105e6b-80c5-44c6-87ef- 123ca3ec27b1&course_id=_65931_1&includeDeleted=true&prin t=true&download=true… 3/3 Student paper 68% slideserve 100% Student paper 100% Student paper 100% slideserve 100% 2 Student paper
- 31. 1) Hypothesis Test: Original source The alternative hypothesis 1 3 Student paper Introduction to Statistics. Original source Introduction To Statistics - 1 Student paper Prentice Hall Publication. Original source Prentice Hall Publication 1 Student paper Basic Statistical Methods (2nd ed.). Harper & Row Publisher
- 32. Original source Basic Statistical Methods (2nd ed.) Harper & Row Publisher 3 Student paper Introduction to Statistics. Original source Introduction To Statistics - Module 9 Critical Thinking Assignment (105 points) Using the Framingham Heart Study Dataset, you will compare the risk factors in men and women where you will use the following patient characteristics: age, systolic blood pressure, diastolic blood pressure, use of anti-hypertensive medication, current smoker, total serum cholesterol, mg/dL, body mass index (BMI), and diabetes, by determining the means for each risk factor. Create a table that summarizes your results. H0 The risk factors for heart disease listed as patient characteristics are not related to if the patient is male or female in the Framingham Heart Study. (Null Hypothesis) H1 The risk factors for heart disease listed as patient characteristics are related to if the patient is male or female in the Framingham Heart Study. (Alternative Hypothesis) Steps of R Studio Analysis shown on page 67 in Introductory Statistics with R.
- 33. > x <- rnorm (50) > sd < (x) > var < (x) > median (x) Steps of Excel Analysis To conduct your analysis of the data, sort the data by the Sex/Gender variable and sort by smallest to largest. Compute the means and standard deviations for continuous variables using AVERAGE(range) and STDEV(range) functions – Compute n(%) for dichotomous variables using COUNT(range) and COUNTIF (range, criteria) functions modifying ranges accordingly. Present your findings by cutting and pasting your results table in a Word document that includes a title page, introduction, a discussion where you interpret the meaning of the table, and a conclusion. Your submission should be 3-4 pages to discuss and display your findings. Provide support for your statements with in-text citations from a minimum of four scholarly, peerreviewed articles. Two of these sources may be from the class readings, textbook, or lectures, but the others must be external. The Saudi Digital Library is a good place to find these sources and should be your primary resource for conducting research. Follow APA and Saudi Electronic University writing standards. Review the grading rubric to see how you will be graded for this assignment. You are strongly encouraged to submit all assignments to the TurnItIn Originality Check prior to submitting them to your instructor for grading. References · Hazra, A., & Gogtay, N. (2016). Biostatistics series module 6: Correlation and linear regression. IndianJournal of Dermatology, 61(6), 593-601. ● Hazra, A., & Gogtay, N. )2017). Biostatistics series module
- 34. 10: Brief overview of multivariate methods. Indian Journal of Dermatology, 62(4), 358-366. ● Johnson, R. E., Kording, K. P., Hargrove, L. J., & Sensinger, J. W. (2017). Adaptation to random and systematic errors: Comparison of amputee and nonamputee control interfaces with varying levels of process noise. PLoS One, 12(3), 1-19. Retrieved from https://doaj.org/article/c81b101b00284f2192fff26ea a6a2142 Critical Thinking Assignment (105 points) Using the Framingham Heart Study dataset provided, perform the ANOVA multivariable linear regression analysis using BMI as a continuous variable. Before conducting the analysis, be sure that all participants have complete data on all analysis variables. If participants are excluded due to missing data, the numbers excluded should be reported. Then describe how each characteristic is related to BMI. Are crude and multivariable effects similar? What might explain or account for any differences? H0 The BMI is not related to the patient characteristics in the Framingham Heart Study. (Null Hypothesis) H1 The BMI is related to the patient characteristics in the Framingham Heart Study. (Alternative Hypothesis) Upload the Framingham Heart Study dataset into R Studio. (Refer to Chapters 7 (pp. 127-141) & 12 (pp. 207-209) in Introductory Statistics with R or pages 111-122 in EXCEL Statistics: A Quick Guide). Excel instructions: Exclude participants with missing data on analysis variables (age, sex, systolic blood pressure, total serum cholesterol, current smoker, and diabetes = cleaning the data). Conduct the simple linear regression (ANOVA) by using the Excel Regression tool in the Data Analysis Toolpak. Remember SEX
- 35. is coded 1=male and 2=female. RStudio instructions: Exclude participants with missing data on analysis variables (age, sex, systolic blood pressure, total serum cholesterol, current smoker, and diabetes = cleaning the data). Conduct the simple linear regression (ANOVA) by using RStudio you will use the t.test () command and the summary () command to get your mean and standard deviation. Present your findings in a Word document by copying and pasting the ANOVA table into the document. Your paper must include a title page, an introduction, a discussion where you interpret the meaning of the ANOVA test, and a conclusion. Your submission should be 3-4 pages to discuss and display your findings. Provide support for your statements with in-text citations from a minimum of four scholarly, peerreviewed articles. Two of these sources may be from the class readings, textbook, or lectures, but the others must be external. The Saudi Digital Library is a good place to find these sources and should be your primary resource for conducting research. Follow APA and Saudi Electronic University writing standards. Review the grading rubric to see how you will be graded for this assignment. You are strongly encouraged to submit all assignments to the TurnItIn Originality Check prior to submitting them to your instructor for grading.
- 36. References · · · · Estabrook, R., Massey, S. H., Clark, C. A., C., Burns, J. L., Mustanski, B. S., & Wakschlag, L. S. (2016). Separating family-level and direct exposure effects of smoking during pregnancy on offspring externalizing symptoms: Bridging the behavior genetic and behavior teratologic divide. Behavior Genetics, 46(3), 389-402. ● Li, R. H., Wacholtz, M. C., Barnes, M., Boggs, L., Callery- D'Amico, S., Davis, A., . . . Bierer, B. E. (2016). Incorporating
- 37. ethical principles into clinical research protocols: A tool for protocol writers and ethics committees. Journal of Medical Ethics, 42(4), 229- 234.