
Recommended
Recommended
More Related Content
Similar to OutlineThesis Statement Due to racism, African Americans are mo
Similar to OutlineThesis Statement Due to racism, African Americans are mo (20)
More from lianaalbee2qly
More from lianaalbee2qly (20)
Recently uploaded
Recently uploaded (20)
OutlineThesis Statement Due to racism, African Americans are mo
- 1. Outline Thesis Statement: Due to racism, African Americans are more likely to face higher sentencing than the average American. Argument #1- Mass Incarceration Argument #2- Effects from Racial Sentencing Argument #3- Community Damage Opposing View Point Body Paragraph #1 Argument#1- Mass Incarceration Example #1- Overcrowded Jails/ Prisons Example #2- Physical/ Mental Health Issues Example #3- History Body Paragraph #2 Argument #2- Effects of Racial Sentencing Example #1- Broken Families Example #2- Suicide / Death Body Paragraph #3 Argument #3- Community Damage Example #1- Employment Example #2- Homelessness Body Paragraph #4 Opposing View Point- How African Americans are sentenced fairly Conclusion Sum up Thesis Statement/ Body Am J Health Behav.™ 2018;42(3):47-55 47 The obesity epidemic has a dominant glob-al and national
- 2. presence. Research shows that 35% of American men and 40.4% of women over the age of 19 years are obese.1 These statistics demonstrate that a high proportion of the population in the United States (US) is impacted directly by the obesity epidemic, which has been proven to be both economically and physiologi- cally taxing. Obesity is defined as the excess accu- mulation of body fat to the point that it can have a negative impact on health. Numerous factors have been identified as obesogenic (those contributing to the development of obesity), including decreased energy expenditure, increased energy intake, and decreased levels of physical activity.2 Concerted ef- forts are being made to understand this epidemic from all possible viewpoints. Insufficient and poor sleep have emerged as obe- sogenic risk factors. Sleep pattern disturbances are associated with impaired cognitive abilities, poor memory, confusion, reduced intellectual capacity, and altered motor function.3 Impaired sleep also can decrease academic performance,4 and increase the incidence of vehicular accidents.5 Furthermore, poor sleep quality and reduced sleep duration may be associated with weight gain.6 College students often report chronic reduced sleep quality and sleep duration.7 The specific causes of poor sleep quality and du- ration are diverse, but the presence of media de- vices within the bedroom, such as smart phones and tablets, is a novel point of discussion in terms of their effect on sleep quality and duration. The effect of cell phone presence in the bedroom on
- 3. sleep has been described in adolescents and adults and implicated as a potential obesogenic factor,8,9 Jonathon Whipps, Doctoral Student, Translational Biomedical Sciences, Ohio University, Athens, OH. Mark Byra, Professor, Division of Kinesiology and Health, University of Wyoming, Laramie, WY. Kenneth G Gerow, Professor, Department of Statistics, University of Wyoming, Laramie, WY. Emily Hill Guseman, Assistant Professor, Diabetes Institute and Department of Family Medicine, Ohio University Heritage College of Osteopathic Medicine, Athens, OH. Correspondence Dr Guseman; [email protected] Evaluation of Nighttime Media Use and Sleep Patterns in First-semester College Students Jonathon Whipps, MS Mark Byra, PhD Kenneth G. Gerow, PhD Emily Hill Guseman, PhD Objective: We evaluated how nighttime media use is associated with sleep behaviors in first- semester college students, and variation by weight status. Methods: In September 2016, first-se- mester college students (N = 114) completed surveys evaluating nighttime media usage (NMU) and sleep behaviors. Height, weight, and waist circumference were measured, and weight status was determined by body mass index. Results: Students reported a mean sleep duration of 7.26 ± 0.93 hours. Only 33% (N = 38) reported sleeping at least 8 hours/night on average. Higher scores on the Pittsburgh Sleep Quality Index were correlated with reports of texting after bed (r = .199,
- 4. p = .04). Total time in bed was correlated with texting in bed (r = .217, p = .026) and device- related sleep interruptions (r = .215, p = .028). Social media usage (r = 0.270, p = .005), mobile gaming (r = .208, p = .033), and texting (r = .293, p = .002) were correlated with sleep interrup- tions. NMU was positively correlated with weight and weight status. Conclusions: These results suggest NMU is associated with reduced sleep quality. Key words: media use; first-semester college students; sleep quality; sleep patterns; weight status; college student health Am J Health Behav.™ 2018;42(3):47-55 DOI: https://doi.org/10.5993/AJHB.42.3.5 Evaluation of Nighttime Media Use and Sleep Patterns in First- semester College Students 48 but has not been well described in young adults (18-24 years old) or college students specifically. Also, research has yet to explore whether a direct relationship exists between nighttime media habits and sleep hygiene. College freshmen prove to be an important group for studying this phenomenon. Young adults mov- ing from the high school to college setting undergo a transition in behaviors as described by Chicker- ing’s Theory of Identity Development.10 Because these individuals are undergoing a change in be- havior and have been raised in a technological envi - ronment, they may provide valuable insight about
- 5. this area. Better understanding of the associations among sleep patterns, nighttime media usage, and weight status can provide novel insight as to how these fac- tors may impact weight. Although some research has explored the relationship that nighttime media use has with sleep habits, most have not described a direct relationship between NMU and sleep, and most have not looked at this relationship in young adults or colleges students. Therefore, the purpose of this study was to determine the association be- tween presence and use of media devices at night- time, such as tablets and smart phones, and sleep patterns of first-semester college students (young adults), and whether these behaviors are associated with weight gain. We hypothesized that first-semes- ter college students who exhibited suboptimal sleep patterns would show increased incidence of sleep disturbance via nighttime media usage and would be associated with weight gain over the course of one semester. METHODS Participants Participants were 18-24-year-old first-semester students at the University of Wyoming. Instructors of 34 first-year seminar (FYS) courses were contact- ed in September of 2016 and 6 instructors invited the researchers to recruit participants from their classrooms. The main investigator (JW) attended each FYS course in September 2016 to explain the study, invite students to participate, and explain the consent form; freedom of consent was stressed during this process. Of 142 potentially-eligible
- 6. students, 128 (90.1%) chose to participate. Sur- veys were completed during the class period with assistance from the main investigator (JW) when necessary (ie, clarifying survey items). For anthro- pometric measures, participants were taken to an adjacent room or area divided by a privacy screen. All members of the study team were trained in hu- man subject research protections, anthropometric measures, and the survey instruments. The main investigator (JW) and/or faculty supervisor (EHG) were present at all data collection sessions. Sleep Quality and Duration We assessed sleep quality and duration using the Pittsburgh Sleep Quality Index (PSQI).11 The PSQI measures 7 variables associated with sleep: sleep quality, sleep duration, habitual sleep effi- ciency, sleep disturbances, use of medications to assist with sleep, and daytime dysfunction.7,11 The combination of scores from the measured sleep vari- ables determines an individual’s global sleep quality score (GSQ). The PSQI scores can range from 0 to 21, with higher scores indicative of lower quality of sleep. Individuals with a GSQ greater than 5 are classified as poor sleepers, whereas those with scores less than 5 are considered to be good sleepers. The survey evaluated the prevalence of the above vari- ables from the last month.7 The PSQI has been vali- dated to assess sleep quality and duration.11 Scoring procedures specific to the PSQI were used to quan- tify survey responses for statistical analysis. Nighttime Media Usage We assessed nighttime media usage (NMU) us-
- 7. ing 7 questions adapted from those used by Ada- chi-Mejia et al.8 Table 1 shows the survey items and coding. In this survey, items 1-6 were scored using 5-point Likert scale responses used to quan- tify responses (1 meaning never to 5 meaning all the time) and were collapsed as necessary. Item 7 was entered as nights per week (up to 7). We used this information to determine the frequency with which nighttime media disturbs sleep, and how fre- quently students access media devices prior to bed. We compared these activities to other variables. Anthropometric Measures We measured height, weight, body mass index (BMI), and waist circumference at baseline and at a follow-up date approximately 10.5 ± 1.02 weeks Whipps et al Am J Health Behav.™ 2018;42(3):47-55 49 DOI: https://doi.org/10.5993/AJHB.42.3.5 later (range = 9.3 to 12.3 weeks). Prior to taking height and weight measurements, we instructed participants to remove their shoes and any bulky articles of clothing. Height was determined using a portable stadiometer and reported in meters. We measured weight using a portable digital scale and we reported it in kilograms (kg). Using the mea- sured heights and weights of the participants, we calculated BMI using the standard BMI equation (BMI = Weight (kg) / Height2 (m2)). We measured
- 8. waist circumference (WC) using a flexible measur- ing tape. We instructed participants to cross their arms across their chest and to place their hands upon their shoulders. Using the right side of the body, a trained research team member located the ileum and marked the site using a non-permanent marker. A cross was made across this mark in line with the mid-axillary line. Once marked, the par- ticipants were instructed to stand up straight with the arms at the side and relaxed, head facing for- ward, and with the feet shoulders distance apart. The measuring tape was wrapped around the par- ticipant’s waist, ensuring the tape was parallel to the floor and was crossing the iliac mark. Once the tape was correctly positioned, a measurement was taken and recorded in centimeters (cm) at the end of a normal exhalation. Data Analysis and Statistics We computed descriptive statistics for physical characteristics and used independent sample t-tests to identify any potential differences between men and women. No statistically significant differences between men and women existed, so analyses of the main outcome variables were not completed separately for each sex. Frequency distributions were calculated for categorical scores from the PSQI and responses to the NMU questionnaire. Pearson correlations were used to determine the ex- tent to which the presence of electronic devices in the bedroom and NMU correlate with categories of sleep latency, sleep duration, sleep quality, and sleep efficiency. A type-I error rate of .05 was used to determine statistical significance. We used the
- 9. IBM Statistical Package for Social Science (SPSS) version 23.0 to conduct statistical analyses. RESULTS Participant Characteristics Table 2 displays participant characteristics. Of 128 students initially surveyed, 114 completed the entire study (retention rate = 89.1%). The partici- pants that did not complete the study (N = 14) were either not present for the follow-up assess- ment period or had incomplete survey responses. Participants who were not present for the follow- up assessment were not contacted to complete the study. Of participants who completed the study, just over half (55%) identified as female (N = 52). The mean age of the students at the initial visit was 18.7 ± 0.4 years. Ninety-three percent (N = 106) of students identified as Caucasian/white, and the other 7% of students (N = 8) reported another ethnicity, not unlike the university overall (10% minority, 53% female). There were no statistically significant differences between sexes in anthropo- metric measures except for height. Table 2 reports differences for participant characteristics. Of the Table 1 Nighttime Media Usage (NMU) Questionnaire Items and Abbreviations NMU1 Do you take your cell phone and/or tablet to bed with you? NMU2 Is your cell phone and/or tablet turned off when you sleep?
- 10. NMU3 Do you use your cell phone and/or tablet as your alarm? NMU4 Do you text or use a messaging app after you go to bed? NMU5 Do you play games on your cell phone and/or tablet after you have gone to bed? NMU6 Do you use social media on your device(s) after you have gone to bed? NMU7 How many nights of the week do you get awakened by a text or other notification from a friend or social media after you go to bed to sleep Evaluation of Nighttime Media Use and Sleep Patterns in First- semester College Students 50 population measured, 2 males (3.8%) and 10 fe- males (16.1%) had elevated waist circumferences after initial measurements. These values did not change significantly between pre- and post-mea- surements. Average student BMI at the initial visit was 24.1 kg/m2, which is slightly below the cutoff for an overweight classification. Of participants, 25.4% (N = 29) were overweight (OW; BMI > 25.0 and < 30.0) and 8.8% were obese (OB; BMI > 30.0). Between initial and final measurements, participants’ mean weight increased 0.6 kg ± 1.92 and BMI increased 0.1 kg/m2 ± 5.74. Mean waist circumference decreased by 1.1 cm ± 5.74, which is approximately equal to the tolerable error limit
- 11. identified in the study protocol (1 cm). Sleep Quantity and Quality Table 3 displays sleep measurements. The most common time (mode) students of both sexes re- ported going to bed was 11:00 PM. The most common rise time was 8:00 AM and the average self-reported sleep duration was 7.26 ± 0.93 hours. The mean time spent in bed was 8.12 ± 0.93 hours, with an average sleep latency (time spent in bed prior to sleep) of 19.6 ± 16.9 minutes. There were Table 3 Average Sleep Characteristics from Pittsburgh Sleep Quality Index (PSQI) Male (N = 52) Female (N = 62) Total (N = 114) Mean Mean Mean Average Bed Time (Mode) 11:30 PM 11:00 PM 11:00 PM Average Rise Time (Mode) 7:15 AM 8:00 AM 8:00 AM Average Sleep Latency (min) 18.3 (15.8) 20.8 (17.8) 19.6 (16.9) Reported Sleep Duration (h) 7.21 (0.81) 7.30 (1.02) 7.26 (0.93) Calculated Time in Bed (h) 8.05 (0.87) 8.18 (0.99) 8.12 (0.93) Sleep Efficiency (%) 90.0 (8.8) 89.4 (9.3) 89.7 (9.0) Average Global PSQI 4.94 (2.15) 5.51 (2.71) 5.25 (2.48) Table 2
- 12. Participant Characteristics Male (N = 52) Female (N = 62) Pre Post Pre Post Age 18.7 (0.5) -- 18.6 (0.3) -- Height (m) 1.80 (0.1) 1.81 (0.1) 1.66 (0.1) 1.66 (0.1) Weight (kg) 79.9 (13.0) 80.7 (13.2) 65.1 (13.0) 65.6 (13.2) WC (cm) 82.8 (11.6) 82.7 (9.1) 78.6 (9.8) 76.6 (9.6) BMI (kg/m2) 24.6 (3.9) 24.8 (4.0) 23.6 (4.5) 23.8 (4.6) OW (%) 30.8 36.5 21.0 24.2 OB (%) 9.6 7.7 8.1 6.5 Note. Values are mean (SD) unless otherwise indicated. WC = waist circumference; BMI = body mass index; OW = overweight; OB = obesity Whipps et al Am J Health Behav.™ 2018;42(3):47-55 51 DOI: https://doi.org/10.5993/AJHB.42.3.5 no statistically significant gender differences. Only one-third of participants (N = 38, 33.33%) re- ported meeting sleep recommendations (sleeping at least 8 hours per night). Of those who slept less
- 13. than 8 hours per night, 25.4% (N = 29) slept 6.5 hours per night or less. Global PSQI Overall sleep quality was assessed using global scores calculated from the PSQI responses. Table 3 reports the average Global PSQI, and Table 4 displays the Global PSQI categories and frequen- cies. Respondents who had a Global PSQI score between 1 and 5 were categorized as optimal sleep- ers (N = 68); scores between 6 and 7 were classi- fied as borderline (N = 26); and poor sleepers were those with scores greater than or equal to 8 (N = 20) based on categories defined within the PSQI scoring guidelines as well as those presented by Lund et al.7 Only 59.6% of respondents were con- sidered optimal sleepers, whereas the other 40.4% were either borderline to poor sleepers. Nighttime Media Usage Questionnaire Figure 1 displays the NMU response frequencies. In some cases, responses were collapsed due to low Table 4 Global PSQI Category Frequencies Male (N = 52) Female (N = 62) Total (N = 114) Frequency Percent Frequency Percent Frequency Percent Optimal (1-5) 34 65.4 34 54.8 68 59.6 Borderline (6-7) 11 21.2 15 24.2 26 22.8 Poor (>8) 7 13.5 13 21.0 20 17.5
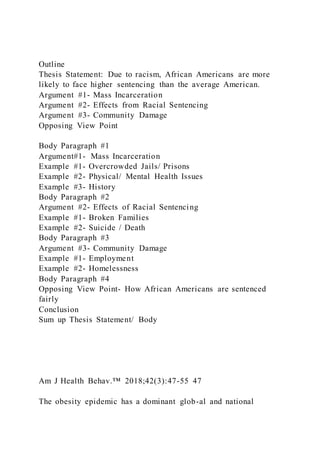
- 14. NMU1 NMU2 NMU3 NMU4 NMU5 NMU6 NMU7 0 20 40 60 80 100 Questionnaire Item Pe rc en t o f T ot al S am pl e Figure 1 NMU Questionnaire Response Frequencies Note.
- 15. Responses to individual NMU question items (Table 1) as a percent. NMU 1-6 are scored using 5-point Likert scale responses used to quantify responses (1 meaning never to 5 meaning all the time) and were collapsed as necessary. NMU 7 is nights per week (up to 7). Evaluation of Nighttime Media Use and Sleep Patterns in First- semester College Students 52 response frequency; this is noted in the figure cap- tion where appropriate. Almost all respondents (N = 105, 92.1%) have their smartphones or tablets in their rooms as they sleep frequently or all the time, and most (N = 108, 94.7%) use their cell phone or tablet as their alarm. Those who did not have their cell phone on and in the bedroom (N = 9) were removed from analyses for NMU questions 4 through 7. Table 5 shows the correlations between anthro- pometric variables and NMU responses. Those who reported playing games in bed frequently were significantly more likely to have a higher initial weight (p = .006), post-weight (p = .006), initial waist circumference (p = .006), post-waist circumference (p = .037), initial BMI (p = .029), and post-BMI (p = .035). None of the other cor- relations were significant. Unsurprisingly, there was Table 5 Correlations between NMU Variables and Anthropometric Characteristics
- 16. NMU1 NMU2 NMU4 NMU5 NMU6 NMU7 r r r r r r Pre Weight -0.083 -0.019 -0.039 0.263 * -0.032 -0.172 Post Weight -0.081 -0.029 -0.043 0.263 * -0.028 -0.174 WC -0.068 0.040 -0.029 0.263 * -0.026 -0.151 Post WC -0.047 -0.012 -0.039 0.201 * -0.014 -0.097 BMI 0.034 0.075 -0.023 0.210 * 0.001 -0.139 Post BMI 0.035 0.062 -0.036 0.203 * -0.004 -0.132 Note. **Correlation is significant at the .01 level (2-tailed) * Correlation is significant at the .05 level (2-tailed) Table 6 Correlations between NMU Variables and Sleep Behaviors Sleep Duration Bed Hours Global PSQI Texting (NMU4)
- 17. Nighttime Gaming (NMU5) Social Media (NMU6) Nighttime Interruptions (NMU7) r r r r r r r Sleep Duration 1 - - - - - - Bed Hours .684** 1 - - - - - Global PSQI -.355** .053 1 - - - - Texting (NMU4) .199* .217* -.032 1 - - - Nighttime Gaming (NMU5) .147 .103 .053 .379** 1 - - Social Media (NMU6) .102 .058 .074 .652** .328** 1 - Nighttime Interruptions (NMU7) .122 .215* .128 .293** .208* .270** 1
- 18. Note. **Correlation is significant at the .01 level (2-tailed) * Correlation is significant at the .05 level (2-tailed) Whipps et al Am J Health Behav.™ 2018;42(3):47-55 53 DOI: https://doi.org/10.5993/AJHB.42.3.5 no relationship between NMU and change in any anthropometric variable over the 8-week period, as there were no statistically significant changes in any of these variables. After selecting for students who frequently or al- ways have their cell phones and/or tablets on while sleeping (N = 105), bivariate Pearson correlation models were run to determine how NMU respons- es were correlated with sleep behaviors and PSQI scores (Table 6). Texting after bed was moderately correlated with participants’ Global PSQI score (r = .199, p = .04). Bed hours (time spent in bed) was moderately correlated with both texting in bed (r = .199, p = .04) and device interruptions (r = .270, p = .005). Social media usage and playing games in bed were weakly to moderately correlated with in- terruptions (r = .270, p = .005; r = .293, p = .002) and playing mobile games in bed was moderately correlated with interruptions (r = .208, p = .033). DISCUSSION In 2015, the American Academy of Sleep Medi- cine and Sleep Research Society released a consen-
- 19. sus statement stating adults need 7 or more hours of sleep per night and, for young adults, sleeping more than 9 hours may be appropriate.12 Overall, first year students in our sample reported chroni- cally low levels of sleep compared to current recom- mendations. Total reported sleep time and chronic low sleep in this population were found to be simi- lar to other American college students.7,13 These re- sults emphasize the need to address sleep problems that persist in college-age populations, especially because sleep deprivation has been associated with decreased academic performance,4 increased nega- tive moods,14 increased anxiety and depression,15,16 drowsy driving,17 and reduced productivity.18 Inad- equate time spent sleeping has been demonstrat- ed across both US-born and foreign-born college students as well. Eliasson and Lettieri conducted a study comparing the sleep habits of US-born col- lege students to those of foreign-born students. Although both groups generally reported restrict- ed sleep, foreign-born students were more likely to stay awake longer studying, whereas US-born students delay sleep for more social activities. This suggests that strategies aimed at improving sleep hygiene may need to be tailored based on cultural backgrounds.19 Sleep deprivation is pervasive among young adults in general in the US. Data from the 2014 Be- havioral Risk Factor Surveillance System (BRFSS) found that 32.2% of young adults (age 18-24 years) surveyed reported short sleep duration (<7 hours per night) on average.20 Chronic short sleep may not be unique to the US; the prevalence of short sleep or borderline short sleep has been document- ed in young adult populations in other countries.
- 20. There is evidence showing reduced sleep duration in countries such as Japan,21 and this trend may ex- tend to other countries as well.22 Furthermore, the role that nighttime media usage plays in short sleep duration may extend outside of young adult col- lege students to young adults in general. Overall, sleep problems may not be unique to the US and potential interventions may need to be explored in- ternationally in the future. Our results support the hypothesis that night- time media usage is related to sleep quality. The directionality of the relationship cannot be deter- mined from the current study. Participants who more frequently reported playing games, using so- cial media, or texting after bed were more likely to report sleep interruptions by their devices. This suggests that the presence of a smartphone or tablet in the bedroom does increase the likelihood that sleep will be disturbed and can have an overall im- pact on sleep quality, however prospective studies are necessary to confirm this. Participants who reported playing games, tex- ting, or using social media were also more likely to report engaging in more than one type of activity. Weak to moderately strong correlations were found between those reporting to play games, use social media, and/or text after they are in bed. This sug- gests that first-semester college students are engag- ing with their smartphone devices in multiple ways at night prior to going to sleep; the increased use of multiple types of media may exaggerate the po- tential for sleep disturbances. Future studies should focus on further describing these relationships.
- 21. Other studies have suggested that nighttime me- dia use has no negative effect on sleep among young adults, but instead, suggest that these individuals use their media devices to cope with their existing sleep problems. Taverniew and Willoughby sought to determine the directionality of the relationship between media use and sleep deprivation in first- Evaluation of Nighttime Media Use and Sleep Patterns in First- semester College Students 54 year Canadian college students. They found that, although sleep problems acted as strong predictors of increased time spent watching TV and online, the relationship was not true when using media time to predict sleep problems.18 Further studies may be necessary to determine whether emerging adults are looking to their media devices to cope with their sleep problems or to prove further that the relationship may be unidirectional. Although this study demonstrated that night- time media usage in the bedroom is associated with sleep behaviors, we did not find that it was associat- ed with change in weight or BMI. On average, our participants (both male and female) gained 0.55 kg over the duration of the study. Whereas still an overall increase in weight, the increase is small enough not to be statistically significant. Other studies have shown that first-year students do tend to gain weight, but generally allow for more time between measurements. Increases in weight for
- 22. first-year college students in other studies range from 1.1 kg to 1.3 kg over about 3 months.23,24 However, none of the anthropometric variables changed significantly over the course of the study period. Given that the time between initial and fi- nal measurements was only 8 weeks, the period of time may not have been long enough to show any significant change in weight or other markers. Fu- ture studies should consider a longer period of time between measurements. Limitations Self-reported behaviors can be inaccurate de- pending on participants’ perception, potentially confounding results. Self-reported sleep and NMU may be associated with either recall or response bias. Further, we did not assess whether participants had any clinical conditions, such as obstructive sleep apnea, that could interfere with sleep independent- ly of sleep hygiene. Unfortunately, we were not able to assess physical activity and dietary habits, limit- ing our ability to discuss whether NMU is associat- ed with weight change. However, this is unlikely to be an issue in our study because weight remained stable over the study period. Our results did show that NMU was positively associated with weight and weight status; however, the directionality of this relationship could not be determined due to the cross-sectional study design and the relatively small convenience sample. Due to the small sam- ple size, some of the statistically significant results may have been due to chance alone; future studies should be conducted using a larger sample size to validate these findings.
- 23. Conclusions Our data support the current literature in dem- onstrating that college students, specifically first- semester students, are likely to experience chronic sleep deprivation and is novel in describing the sleep patterns and NMU habits of first-semester college students. This study also adds to the literature by suggesting a relationship exists between sleep be- haviors and nighttime media usage – as nighttime usage (texting, social media, gaming, etc.) increas- es, overall incidence of sleep interruptions increases and sleep quality tends to decrease. Future studies should focus on determining whether nighttime media usage and poor sleep hygiene do have a re- lationship with weight status and other markers of health, as well as determine the true directionality of the relationship between nighttime media usage and sleep quality. Human Subjects Statement The University of Wyoming Institutional Review Board (protocol #20160728JW01264) approved this study. and all students provided informed con- sent prior to participation. Conflict of Interest Statement The authors have no conflicts of interest to disclose. Acknowledgements The authors acknowledge members of the Uni-
- 24. versity of Wyoming Pediatric Physical Activity Lab for their assistance in data collection and data management. References 1. Flegal KM, Kruszon-Moran D, Carroll MD, et al. Trends in obesity among adults in the United States, 2005 to 2014. JAMA. 2016;315(21):2284-2291. 2. Matthews CE, George SM, Moore SC, et al. Amount of time spent in sedentary behaviors and cause-specific mor- tality in US adults. Am J Clin Nutr. 2012;95(2):437-445. 3. Porter VR, Buxton WG, Avidan AY. Sleep, cognition and Whipps et al Am J Health Behav.™ 2018;42(3):47-55 55 DOI: https://doi.org/10.5993/AJHB.42.3.5 dementia. Curr Psychiatry Rep. 2015;17(12):97. 4. Howard ME, Desai AV, Grunstein RR, et al. Sleepiness, sleep-disordered breathing, and accident risk factors in commercial vehicle drivers. Am J Respir Crit Care Med. 2004;170(9):1014-1021. 5. Curcio G, Ferrara M, Degennaro L. Sleep loss, learn- ing capacity and academic performance. Sleep Med Rev. 2006;10(5):323-337. 6. Patel SR, Hu FB. Short sleep duration and weight gain: a systematic review. Obesity. 2008;16(3):643-653.
- 25. 7. Lund HG, Reider BD, Whiting AB, Prichard JR. Sleep patterns and predictors of disturbed sleep in a large population of college students. J Adolesc Health. 2010;46(2):124-132. 8. Adachi-Mejia AM, Edwards PM, Gilbert-Diamond D, et al. TXT me I’m only sleeping: adolescents with mo- bile phones in their bedroom. Fam Community Health. 2014;37(4):252-257. 9. Exelmans L, Van den Bulck J. Bedtime mobile phone use and sleep in adults. Soc Sci Med. 2016;148:93-101. 10. Chickering AW, Reisser L. Education and Identity. 2nd ed. San Francisco, CA: Jossey-Bass Publishers; 1993. 11. Buysse DJ, Reynolds CF, Monk TH, et al. The Pittsburgh Sleep Quality Index: a new instrument for psychiatric practice and research. Psychiatry Res. 1989;28(2):193- 213. 12. Watson NF, Badr MS, Belenky G, et al. Recommend- ed amount of sleep for a healthy adult: a joint con- sensus statement of the American Academy of Sleep Medicine and Sleep Research Society. J Clin Sleep Med. 2015;11(8):931-952. 13. Taylor DJ, Bramoweth AD. Patterns and consequences of inadequate sleep in college students: substance use and motor vehicle accidents. J Adolesc …