
Recommended
More Related Content
Viewers also liked
Viewers also liked (17)
More from laura_sutachan
Recently uploaded
Recently uploaded (20)
trabajoSistemas 2
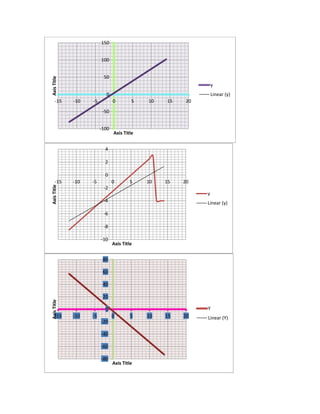
- 1. -100 -50 0 50 100 150 -15 -10 -5 0 5 10 15 20 AxisTitle Axis Title y Linear (y) -10 -8 -6 -4 -2 0 2 4 -15 -10 -5 0 5 10 15 20 AxisTitle Axis Title y Linear (y) -80 -60 -40 -20 0 20 40 60 80 -15 -10 -5 0 5 10 15 20 AxisTitle Axis Title Y Linear (Y)