SlideShare a Scribd company logo
1 of 9
Download to read offline
EABD Unit 2: Lecturer Baseline Information
Dr K R Kumar, MBA, Adhiyamaan College of Engineering (Autonomous) Hosur, Tamil Nadu
Demand Analysis
Demand
Demand in economics is the consumer's desire and ability to purchase a good or service. The
underlying force drives economic growth and expansion. Without demand, no business
would ever bother producing anything.
Law of demand
In microeconomics, the law of demand states that, "conditional on all else being equal, as the
price of a good increase (↑), quantity demanded decreases (↓); conversely, as the price of a
good decreases (↓), quantity demanded increases (↑)". In other words, the law of demand
describes an inverse relationship between price and quantity demanded of a good.
Alternatively, other things being constant, quantity demanded of a commodity is an inversely
related to the price of the commodity.
Why does Demand Curve Slopes Downward?
When price fall the quantity demanded of a commodity rises and vice versa, other things
remaining the same. It is due to this law of demand that demand curve slopes downward to the
right.
Now, the important question is why the demand curve slopes downward, or in other words,
why the law of demand describing inverse price-demand relationship is valid. We can explain
this with marginal utility analysis and with the indifference curve analysis.
Elasticity of Demand
To begin with, let us look at the definition of the elasticity of demand: “Elasticity of demand
is the responsiveness of the quantity demanded of a commodity to changes in one of the
variables on which demand depends. In other words, it is the percentage change in quantity
demanded divided by the percentage in one of the variables on which demand depends.”
TypesofElasticityofDemand
Price Elasticity of Demand: The price elasticity of demand, commonly known as the elasticity
of demand refers to the responsiveness and sensitiveness of demand for a product to the
changes in its price.
EABD Unit 2: Lecturer Baseline Information
Dr K R Kumar, MBA, Adhiyamaan College of Engineering (Autonomous) Hosur, Tamil Nadu
In other words, the price elasticity of demand is equal to
Numerically,
Where, ΔQ = Q1 –Q0, ΔP = P1 – P0, Q1= New quantity, Q2= Original quantity, P1 = New
price, P0 = Original price. The following are the main Types of Price Elasticity of Demand:
 Perfectly Elastic Demand
 Perfectly Inelastic Demand
 Relatively Elastic Demand
 Relatively Inelastic Demand
 Unitary Elastic Demand
Income Elasticity of Demand: The income is the other factor that influences the demand for
a product. Hence, the degree of responsiveness of a change in demand for a product due to
the change in the income is known as income elasticity of demand. The formula to compute
the income elasticity of demand
Is:
For most of the goods, the income elasticity of demand is greater than one indicating that with
the change in income the demand will also change and that too in the same direction, i.e. more
income means more demand and vice-versa.
Cross Elasticity of Demand: The cross elasticity of demand refers to the change in quantity
demanded for one commodity because of the change in the price of another commodity. This
type of elasticity usually arises in the case of the interrelated goods such as substitutes and
complementary goods. The cross elasticity of demand for goods X and Y can be expressed as:
The two commodities are said to be complementary, if the price of one commodity falls, then
the demand for other increases, on the contrary, if the price of one commodity rises the demand
for another commodity decreases. For example, petrol and car are complementary goods.
EABD Unit 2: Lecturer Baseline Information
Dr K R Kumar, MBA, Adhiyamaan College of Engineering (Autonomous) Hosur, Tamil Nadu
While the two commodities are said to be substitutes for each other if the price of one
commodity falls, the demand for another commodity also decreases, on the other hand, if the
price of one commodity rises the demand for the other commodity also increases. For
example, tea and coffee are substitute goods.
Advertising Elasticity of Demand: The responsiveness of the change in demand to the
change in advertising or rather promotional expenses is known as advertising elasticity of
demand. In other words, the change in the demand because of the change in advertisement and
other promotional expenses is called as the advertising elasticity of demand. It can be expressed
as:
Numerically,
Where,
Q1 = Original Demand
Q2= New Demand
A1= Original Advertisement Outlay
A2 = New Advertisement Outlay
These are some of the important types of elasticity of demand that helps in understanding the
criteria of demand for the goods and services and the factors that influence the demand.
DeterminantsofElasticityofDemand
Apart from the price, several other factors influence the elasticity of demand. These are:
EABD Unit 2: Lecturer Baseline Information
Dr K R Kumar, MBA, Adhiyamaan College of Engineering (Autonomous) Hosur, Tamil Nadu
1. Consumer Income: The income of the consumer also affects the elasticity of demand. For
high-income groups, the demand is said to be less elastic as the rise or fall in the price will not
have much effect on the demand for a product. Whereas, in case of the low-income groups, the
demand is said to be elastic, rise, and fall in the price have a significant effect on the quantity
demanded. Such as when the price falls the demand increases and vice-versa.
2. Amount of Money Spent: The elasticity of demand for a product is determined by the
proportion of income spent by the individual on that product. In case of certain goods, such as
matchbox, salt a consumer spends a very small amount of his income, let us say Rs 2, then
even if their prices rise the demand for these products will not be affected largely. Thus, the
demand for such products is said to be inelastic.
Whereas foods and clothing are the items where an individual spends a major proportion of his
income and therefore, if there is any change in the price of these items, the demand will get
affected.
3. Nature of Commodity: The elasticity of demand also depends on the nature of the commodity.
The product can be categorized as luxury, convenience, necessary goods. The demand for the
necessities of life, such as food and clothing is inelastic as their demand cannot be postponed.
The demand for the Comfort Goods is neither elastic nor inelastic. As with the rise and fall in
their prices, the demand decreases or increases moderately.
Whereas the demand for the luxury goods is said to be highly elastic because even with a slight
change in its price the demand changes significantly. But, however, the demand for the prestige
goods is said to be inelastic, because people are ready to buy these commodities at any price,
such as antiques, gems, stones, etc.
4. Several Uses of Commodity: The elasticity of demand also depends on the number of uses of
the commodity. Such as, if the commodity is used for a single purpose, then the change in the
price will affect the demand for commodity only in that use, and thus the demand for that
commodity is said to be inelastic. Whereas, if the product has several uses, such as raw material
coal, iron, steel, etc., then the change in their price will affect the demand for these commodities
in its many uses. Thus, the demand for such products is said to be elastic.
5. Whether the Demand can be postponed or not: If the demand for a particular product cannot
be postponed then, the demand is said to be inelastic. Such as, Wheat is required in daily life
and hence its demand cannot be postponed. On the other hand, the items whose demand can be
postponed is said to have elastic demand. Such as the demand for the furniture can be postponed
until the time its prices fall.
6. Existence of Substitutes: The substitutes are the goods which can be used in place of one
another. The goods which have close substitutes are said to have elastic demand. Such as, tea
and coffee are close substitutes and if the price of tea increases, then people will switch to the
coffee and demand for the tea will decrease significantly. Whereas, if there are no close
substitutes for a product, then its demand is said to be inelastic. Such as salt and sugar do not
have their close substitutes and hence lower is their price elasticity.
7. Joint Demand: The elasticity of demand also depends on the complementary goods, the goods
which are used jointly. Such as car and petrol, pen and ink, etc. Here the elasticity of demand
of secondary (supporting) commodity depends on the elasticity of demand of the major
commodity. Such as, if the demand for pen is inelastic, then the demand for the ink will also
be less elastic.
EABD Unit 2: Lecturer Baseline Information
Dr K R Kumar, MBA, Adhiyamaan College of Engineering (Autonomous) Hosur, Tamil Nadu
8. Range of Prices: The price range in which the commodities lie also affects the elasticity of
demand. Such as the higher range, the rich people usually buy products, and they do not care
much about the change in the price and hence the demand for such higher range commodities
is said to be inelastic.
Also, the lower range commodities have inelastic demand because these are already low priced
and can be bought by any sections of the society. But the commodities in middle range prices
are said to have an elastic demand because with the fall in the prices the middle class and the
lower middle class are induced to buy that commodity and therefore the demand increases. But
however, if the prices are increased the consumption reduces and as a result demand falls.
Thus, these are some of the important determinants of elasticity of demand that every firm
should understand properly before deciding on the price of their offerings.
According to Evan J. Douglas, “Demand estimation (forecasting) may be defined as a process
of finding values for demand in future time periods.”
In the words of Cundiff and Still, “Demand forecasting is an estimate of sales during a specified
future period based on proposed marketing plan and a set of particular uncontrollable and
competitive forces.”
The objectives of demand forecasting
Factors Influencing Demand Forecasting
Demand forecasting methods
Qualitative /Survey Methods
EABD Unit 2: Lecturer Baseline Information
Dr K R Kumar, MBA, Adhiyamaan College of Engineering (Autonomous) Hosur, Tamil Nadu
Delphi method: It is a forecasting process framework based on the results of multiple rounds
of questionnaires sent to a panel of experts. Several rounds of questionnaires are sent out to the
group of experts, and the anonymous responses are aggregated and shared with the group after
each round.
Nominal Method: A systematic and an organized group meeting held among the members to
facilitate decision making by properly identifying the problems and generating the solutions
thereof. The nominal group technique helps in preventing the discussion being dominated by a
single person and hence, allow the silent members, who are quite shy, to speak out their ideas
in the group.
Market Research Method: Involves collecting necessary information regarding the current
and future demand for a product. This method carries out the studies and experiments on
consumer behavior under actual market conditions. In this method, some areas of markets are
selected with similar features, such as population, income levels, cultural background, and
tastes of consumers. The market experiments are carried out with the help of changing prices
and expenditure, so that the resultant changes in the demand are recorded. These results help
in forecasting future demand.
Sales Force Composite: It is a forecasting method used to forecast the sales by adding up
individual sales agents forecasts for sales in their respective sales territories. It is a bottom-up
approach, which companies use to forecast more accurately. Sales agents have the most direct
interaction with the customers and provide many valuable insights that help the companies
boost their sales.
Quantitative/ Statistical methods
Time serious analysis
The patterns that we may find in a time series of historical data include the average, trend,
seasonal, cyclical and irregular components. The average is simply the mean of the
historical data. Trend describes real growth or decline in average demand or other variable of
interest, and represents a shift in the average. The seasonal component reflects a pattern that
repeats within the total period of interest.
The cyclical component shows recurring values of the variable of interest above or below the
average or long run trend line over a multiyear planning horizon. The length of cycles is not
constant, as with the length of seasonal peaks and valleys, making economic cycles much
tougher to predict. Since the patterns are not constant, multiple variable models such as
econometric and multiple regression models are better suited to predict cyclical turning points
than time series models.
The last component is what is left! The irregular component is the random variation in demand
that is unexplained by the average, trend, seasonal and/or cyclical components of a time series.
As in regression models, we try to make the random variation as low as possible.
EABD Unit 2: Lecturer Baseline Information
Dr K R Kumar, MBA, Adhiyamaan College of Engineering (Autonomous) Hosur, Tamil Nadu
Last Period Method
This method uses last year's sales for the next year's forecast. To forecast demand,
this method requires the number of periods best fit and one year of sales order history.
This method is useful to forecast demand for mature products with level demand or
seasonal demand without a trend.
Simple average method
Under this method, simple average rate at cost is obtained by adding the rate of purchases
represented by stock at the time of issue & then dividing the same by the number of such rates.
The rate needs to be revised at the time of any new purchase or exhaustion of any existing
stock. For ascertaining the average rate, the quantity by which each purchase is made has to be
ignored. To dampen the severity of the effect of rises & falls in the purchase price, use of any
kind of average rate is made. Thus, in case of fluctuating rates of purchase, average cost is
used. However, obviously, cost is not properly represented by the average cost.
Moving average methods
A simple technique, which works well with data that has no trend, seasonality nor cyclic
components, is the moving average method. Admittedly, this example data set has trend (note
the overall growth rate from period 1 to 12), and seasonality (note that every third quarter
reflects a decrease in historical demand). A three period moving average forecast is a method
that takes three periods of data and creates an average. That average is the forecast for the next
period. For this data set, the first forecast we can compute is for Period 4, using actual historical
data from Periods 1, 2 and 3 (since its a three period moving average). Then, after Period 4
occurs, we can make a forecast for Period 5, using historical data from Periods 2, 3, and 4. Note
that Period 1 dropped off, hence the term moving average. This technique then assumes that
actual historical data in the far distant past, is not as useful as more current historical data in
making forecasts.
Before showing the formulas and illustrating this example, let me introduce some symbols. In
this module, I will be using the symbol Ft to represent a forecast for period t. Thus, the forecast
for period 4. I will use the symbol Yt to represent the actual historical value of the variable of
interest, such as demand, in period t. Thus, the actual demand for period
1 would be shown as Y1.
Now to carry forward the computations for a three period moving average. The forecast for
period four is:
F4 = (Y1 + Y2 + Y3) / 3 = (398 + 395 + 361) / 3 = 384.7
To generate the forecast for period five:
F5 = (Y2 + Y3 + Y4) / 3 = (395 + 361 + 400) / 3 = 385.3
We continue through the historical data until we get to the end of Period 12 and make our
forecast for Period 13 based on actual demand from Periods 10, 11 and 12. Since Period 12 is
the last period for which we have data, this ends our computations. If someone were interested
in making a forecast for Periods 14, 15, and 16, as well as Period 13, the best that could be
EABD Unit 2: Lecturer Baseline Information
Dr K R Kumar, MBA, Adhiyamaan College of Engineering (Autonomous) Hosur, Tamil Nadu
done with the moving average method would be to make the "out period" forecasts the same
as the most current forecast. This is true because moving average methods cannot grow or
respond to trend. This is the chief reason these types of methods are limited to short term
applications, such as what is the demand for the next period.
Trend Projection Method
The Trend Projection Method is the most classical method of business forecasting, which is
concerned with the movement of variables through time. This method requires a long time-
series data. ... In predicting demand for a product, the trend projection method is applied to the
long time-series data. When a time series reflects a shift from a stationary pattern to real growth
or decline in the time series variable of interest (e.g., product demand or student enrolment at
the university), that time series is demonstrating the trend component. The trend projection
method of time series forecasting is based on the simple linear regression model. However, we
generally do not require the rigid assumptions of linear regression (normal distribution of the
error component, constant variance of the error component, and so forth), only that the
past linear trend pattern will continue into the future.
The trend projection model is:
Tt = b0 + b1 t
where,
Tt = Trend value for variable of interest in Period t
b0 = Intercept of the trend projection line
b1 = Slope, or rate of change, for the trend projection line
Cause Effect Model
Correlation and Regression: These involve the use of econometric methods to determine the
nature and degree of association between/among a set of variables. Econometrics, you may
recall, is the use of economic theory, statistical analysis and mathematical functions to
determine the relationship between a dependent variable (say, sales) and one or more
independent variables (like price, income, advertisement etc.). The relationship may be
EABD Unit 2: Lecturer Baseline Information
Dr K R Kumar, MBA, Adhiyamaan College of Engineering (Autonomous) Hosur, Tamil Nadu
expressed in the form of a demand function, as we have seen earlier. Such relationships, based
on past data can be used for forecasting. The analysis can be carried with varying degrees of
complexity. Here we shall not get into the methods of finding out ‘correlation coefficient’ or
‘regression equation’; you must have covered those statistical techniques as a part of
quantitative methods. Similarly, we shall not go into the question of economic theory. We shall
concentrate simply on the use of these econometric techniques in forecasting.
We are on the realm of multiple regression and multiple correlation. The form of the equation
may be:
DX = a + b1 A + b2PX + b3Py
You know that the regression coefficients b1, b2, b3 and b4 are the components of relevant
elasticity of demand. For example, b1 is a component of price elasticity of demand. The reflect
the direction as well as proportion of change in demand for x because of a change in any of its
explanatory variables. For example, b2< 0 suggest that DX and PX are inversely related; b4 >
0 suggest that x and y are substitutes; b3 > 0 suggest that x is a normal commodity with
commodity with positive income-effect.
Given the estimated value of and bi, you may forecast the expected sales (DX), if you know
the future values of explanatory variables like own price (PX), related price (Py), income (B)
and advertisement (A). Lastly, you may also recall that the statistics R2 (Co-efficient of
determination) gives the measure of goodness of fit. The closer it is to unity, the better is the
fit, and that way you get a more reliable forecast.
The principle advantage of this method is that it is prescriptive as well descriptive. That is,
besides generating demand forecast, it explains why the demand is what it is. In other words,
this technique has both explanatory and predictive value. The regression method is neither
mechanistic like the trend method nor subjective like the opinion poll method. In this method
of forecasting, you may use not only time-series data but also cross section data. The only
precaution you need to take is that data analysis should be based on the logic of economic
theory.

More Related Content

What's hot

Price Mechanism Introduction
Price Mechanism IntroductionPrice Mechanism Introduction
Price Mechanism Introductiontutor2u
 
Demand elasticity and measurement of price elasticity.
Demand elasticity and measurement of price elasticity.Demand elasticity and measurement of price elasticity.
Demand elasticity and measurement of price elasticity.Chaitra GR
 
Determinants of demand
Determinants of demandDeterminants of demand
Determinants of demandzakir farooqui
 
Price Elasticity of Demand
Price Elasticity of DemandPrice Elasticity of Demand
Price Elasticity of Demandtutor2u
 
Class 12 Economics Board Project | Elasticity of Demand |
Class 12 Economics Board Project | Elasticity of Demand |Class 12 Economics Board Project | Elasticity of Demand |
Class 12 Economics Board Project | Elasticity of Demand |Saurabh Hanumant Jadhav
 
Demand and Supply in service marketing
Demand and Supply in service marketingDemand and Supply in service marketing
Demand and Supply in service marketinganju2014
 
Fundamental concepts, principle of economics
Fundamental concepts, principle of economicsFundamental concepts, principle of economics
Fundamental concepts, principle of economicsShompa Nandi
 
Indifference curve analysis ordinal utility approach
Indifference curve analysis   ordinal utility approachIndifference curve analysis   ordinal utility approach
Indifference curve analysis ordinal utility approachvipul gangwar
 
Culture and Consumer Behavior
Culture and Consumer Behavior Culture and Consumer Behavior
Culture and Consumer Behavior MD SALMAN ANJUM
 
Cross elasticity of demand
Cross elasticity of demandCross elasticity of demand
Cross elasticity of demandsuhasoo1shinde
 
Pricing decisions under different market structures
Pricing decisions under different market structuresPricing decisions under different market structures
Pricing decisions under different market structuresdvy92010
 
Presentation on Indifference Curve
Presentation on Indifference CurvePresentation on Indifference Curve
Presentation on Indifference CurveShuvongkor Barman
 
Consumer equilibrium and demand
Consumer equilibrium and demandConsumer equilibrium and demand
Consumer equilibrium and demandmadan kumar
 

What's hot (20)

Price Mechanism Introduction
Price Mechanism IntroductionPrice Mechanism Introduction
Price Mechanism Introduction
 
Demand elasticity and measurement of price elasticity.
Demand elasticity and measurement of price elasticity.Demand elasticity and measurement of price elasticity.
Demand elasticity and measurement of price elasticity.
 
Determinants of demand
Determinants of demandDeterminants of demand
Determinants of demand
 
Price Elasticity of Demand
Price Elasticity of DemandPrice Elasticity of Demand
Price Elasticity of Demand
 
Class 12 Economics Board Project | Elasticity of Demand |
Class 12 Economics Board Project | Elasticity of Demand |Class 12 Economics Board Project | Elasticity of Demand |
Class 12 Economics Board Project | Elasticity of Demand |
 
Demand and Supply in service marketing
Demand and Supply in service marketingDemand and Supply in service marketing
Demand and Supply in service marketing
 
Service Encounter
Service Encounter Service Encounter
Service Encounter
 
Elasticity of demand
Elasticity of demandElasticity of demand
Elasticity of demand
 
Fundamental concepts, principle of economics
Fundamental concepts, principle of economicsFundamental concepts, principle of economics
Fundamental concepts, principle of economics
 
Indifference curve analysis ordinal utility approach
Indifference curve analysis   ordinal utility approachIndifference curve analysis   ordinal utility approach
Indifference curve analysis ordinal utility approach
 
Consumerism
ConsumerismConsumerism
Consumerism
 
Culture and Consumer Behavior
Culture and Consumer Behavior Culture and Consumer Behavior
Culture and Consumer Behavior
 
Cross elasticity of demand
Cross elasticity of demandCross elasticity of demand
Cross elasticity of demand
 
Demand Analysis
Demand AnalysisDemand Analysis
Demand Analysis
 
Pricing decisions under different market structures
Pricing decisions under different market structuresPricing decisions under different market structures
Pricing decisions under different market structures
 
E-buying behaviour
E-buying behaviourE-buying behaviour
E-buying behaviour
 
Presentation on Indifference Curve
Presentation on Indifference CurvePresentation on Indifference Curve
Presentation on Indifference Curve
 
Consumer equilibrium and demand
Consumer equilibrium and demandConsumer equilibrium and demand
Consumer equilibrium and demand
 
Demand
DemandDemand
Demand
 
Consumerism
ConsumerismConsumerism
Consumerism
 

Similar to EABD Unit 2: Factors Affecting Demand Elasticity

Similar to EABD Unit 2: Factors Affecting Demand Elasticity (20)

Managerial Economics - Demand and Consumer Analysis.pptx
Managerial Economics - Demand and Consumer Analysis.pptxManagerial Economics - Demand and Consumer Analysis.pptx
Managerial Economics - Demand and Consumer Analysis.pptx
 
Elasticity of demand
Elasticity of demandElasticity of demand
Elasticity of demand
 
What is demand gp
What is demand gpWhat is demand gp
What is demand gp
 
Elasticity of Demand and its Types.pptx
Elasticity of Demand and its Types.pptxElasticity of Demand and its Types.pptx
Elasticity of Demand and its Types.pptx
 
Chapter 4 lecture
Chapter 4 lectureChapter 4 lecture
Chapter 4 lecture
 
Elasticity of demand
Elasticity of demandElasticity of demand
Elasticity of demand
 
Theory of Consumer Behaviour (part - 2) Class 12
Theory of Consumer Behaviour (part - 2) Class 12 Theory of Consumer Behaviour (part - 2) Class 12
Theory of Consumer Behaviour (part - 2) Class 12
 
Demand theory
Demand theoryDemand theory
Demand theory
 
4 Demand Analysis
4 Demand Analysis4 Demand Analysis
4 Demand Analysis
 
HOME ASSIGNMENT
HOME ASSIGNMENTHOME ASSIGNMENT
HOME ASSIGNMENT
 
Demand
DemandDemand
Demand
 
Economics 2
Economics 2Economics 2
Economics 2
 
Free Ebooks Download
Free Ebooks Download Free Ebooks Download
Free Ebooks Download
 
Elasticity of demand and supply
Elasticity of demand and supplyElasticity of demand and supply
Elasticity of demand and supply
 
Demand and Supply Elasticity in Healthcare
Demand and Supply Elasticity in HealthcareDemand and Supply Elasticity in Healthcare
Demand and Supply Elasticity in Healthcare
 
Law of demand 11th class.pptx
Law of demand 11th class.pptxLaw of demand 11th class.pptx
Law of demand 11th class.pptx
 
Demand analysis &amp; supply analysis
Demand analysis &amp; supply analysisDemand analysis &amp; supply analysis
Demand analysis &amp; supply analysis
 
Demand analysis
Demand analysisDemand analysis
Demand analysis
 
Managarial economics assignment
Managarial economics assignmentManagarial economics assignment
Managarial economics assignment
 
Demand analysis
Demand analysisDemand analysis
Demand analysis
 

Recently uploaded

Progress Report - Oracle Database Analyst Summit
Progress  Report - Oracle Database Analyst SummitProgress  Report - Oracle Database Analyst Summit
Progress Report - Oracle Database Analyst SummitHolger Mueller
 
Monte Carlo simulation : Simulation using MCSM
Monte Carlo simulation : Simulation using MCSMMonte Carlo simulation : Simulation using MCSM
Monte Carlo simulation : Simulation using MCSMRavindra Nath Shukla
 
GD Birla and his contribution in management
GD Birla and his contribution in managementGD Birla and his contribution in management
GD Birla and his contribution in managementchhavia330
 
BEST Call Girls In Old Faridabad ✨ 9773824855 ✨ Escorts Service In Delhi Ncr,
BEST Call Girls In Old Faridabad ✨ 9773824855 ✨ Escorts Service In Delhi Ncr,BEST Call Girls In Old Faridabad ✨ 9773824855 ✨ Escorts Service In Delhi Ncr,
BEST Call Girls In Old Faridabad ✨ 9773824855 ✨ Escorts Service In Delhi Ncr,noida100girls
 
7.pdf This presentation captures many uses and the significance of the number...
7.pdf This presentation captures many uses and the significance of the number...7.pdf This presentation captures many uses and the significance of the number...
7.pdf This presentation captures many uses and the significance of the number...Paul Menig
 
BEST Call Girls In Greater Noida ✨ 9773824855 ✨ Escorts Service In Delhi Ncr,
BEST Call Girls In Greater Noida ✨ 9773824855 ✨ Escorts Service In Delhi Ncr,BEST Call Girls In Greater Noida ✨ 9773824855 ✨ Escorts Service In Delhi Ncr,
BEST Call Girls In Greater Noida ✨ 9773824855 ✨ Escorts Service In Delhi Ncr,noida100girls
 
VIP Call Girls Pune Kirti 8617697112 Independent Escort Service Pune
VIP Call Girls Pune Kirti 8617697112 Independent Escort Service PuneVIP Call Girls Pune Kirti 8617697112 Independent Escort Service Pune
VIP Call Girls Pune Kirti 8617697112 Independent Escort Service PuneCall girls in Ahmedabad High profile
 
Call Girls In Radisson Blu Hotel New Delhi Paschim Vihar ❤️8860477959 Escorts...
Call Girls In Radisson Blu Hotel New Delhi Paschim Vihar ❤️8860477959 Escorts...Call Girls In Radisson Blu Hotel New Delhi Paschim Vihar ❤️8860477959 Escorts...
Call Girls In Radisson Blu Hotel New Delhi Paschim Vihar ❤️8860477959 Escorts...lizamodels9
 
Catalogue ONG NUOC PPR DE NHAT .pdf
Catalogue ONG NUOC PPR DE NHAT      .pdfCatalogue ONG NUOC PPR DE NHAT      .pdf
Catalogue ONG NUOC PPR DE NHAT .pdfOrient Homes
 
/:Call Girls In Jaypee Siddharth - 5 Star Hotel New Delhi ➥9990211544 Top Esc...
/:Call Girls In Jaypee Siddharth - 5 Star Hotel New Delhi ➥9990211544 Top Esc.../:Call Girls In Jaypee Siddharth - 5 Star Hotel New Delhi ➥9990211544 Top Esc...
/:Call Girls In Jaypee Siddharth - 5 Star Hotel New Delhi ➥9990211544 Top Esc...lizamodels9
 
Tech Startup Growth Hacking 101 - Basics on Growth Marketing
Tech Startup Growth Hacking 101  - Basics on Growth MarketingTech Startup Growth Hacking 101  - Basics on Growth Marketing
Tech Startup Growth Hacking 101 - Basics on Growth MarketingShawn Pang
 
rishikeshgirls.in- Rishikesh call girl.pdf
rishikeshgirls.in- Rishikesh call girl.pdfrishikeshgirls.in- Rishikesh call girl.pdf
rishikeshgirls.in- Rishikesh call girl.pdfmuskan1121w
 
Keppel Ltd. 1Q 2024 Business Update Presentation Slides
Keppel Ltd. 1Q 2024 Business Update  Presentation SlidesKeppel Ltd. 1Q 2024 Business Update  Presentation Slides
Keppel Ltd. 1Q 2024 Business Update Presentation SlidesKeppelCorporation
 
Call Girls Navi Mumbai Just Call 9907093804 Top Class Call Girl Service Avail...
Call Girls Navi Mumbai Just Call 9907093804 Top Class Call Girl Service Avail...Call Girls Navi Mumbai Just Call 9907093804 Top Class Call Girl Service Avail...
Call Girls Navi Mumbai Just Call 9907093804 Top Class Call Girl Service Avail...Dipal Arora
 
RE Capital's Visionary Leadership under Newman Leech
RE Capital's Visionary Leadership under Newman LeechRE Capital's Visionary Leadership under Newman Leech
RE Capital's Visionary Leadership under Newman LeechNewman George Leech
 
Lowrate Call Girls In Laxmi Nagar Delhi ❤️8860477959 Escorts 100% Genuine Ser...
Lowrate Call Girls In Laxmi Nagar Delhi ❤️8860477959 Escorts 100% Genuine Ser...Lowrate Call Girls In Laxmi Nagar Delhi ❤️8860477959 Escorts 100% Genuine Ser...
Lowrate Call Girls In Laxmi Nagar Delhi ❤️8860477959 Escorts 100% Genuine Ser...lizamodels9
 
Call Girls In Panjim North Goa 9971646499 Genuine Service
Call Girls In Panjim North Goa 9971646499 Genuine ServiceCall Girls In Panjim North Goa 9971646499 Genuine Service
Call Girls In Panjim North Goa 9971646499 Genuine Serviceritikaroy0888
 
The CMO Survey - Highlights and Insights Report - Spring 2024
The CMO Survey - Highlights and Insights Report - Spring 2024The CMO Survey - Highlights and Insights Report - Spring 2024
The CMO Survey - Highlights and Insights Report - Spring 2024christinemoorman
 
Insurers' journeys to build a mastery in the IoT usage
Insurers' journeys to build a mastery in the IoT usageInsurers' journeys to build a mastery in the IoT usage
Insurers' journeys to build a mastery in the IoT usageMatteo Carbone
 

Recently uploaded (20)

Progress Report - Oracle Database Analyst Summit
Progress  Report - Oracle Database Analyst SummitProgress  Report - Oracle Database Analyst Summit
Progress Report - Oracle Database Analyst Summit
 
Monte Carlo simulation : Simulation using MCSM
Monte Carlo simulation : Simulation using MCSMMonte Carlo simulation : Simulation using MCSM
Monte Carlo simulation : Simulation using MCSM
 
GD Birla and his contribution in management
GD Birla and his contribution in managementGD Birla and his contribution in management
GD Birla and his contribution in management
 
BEST Call Girls In Old Faridabad ✨ 9773824855 ✨ Escorts Service In Delhi Ncr,
BEST Call Girls In Old Faridabad ✨ 9773824855 ✨ Escorts Service In Delhi Ncr,BEST Call Girls In Old Faridabad ✨ 9773824855 ✨ Escorts Service In Delhi Ncr,
BEST Call Girls In Old Faridabad ✨ 9773824855 ✨ Escorts Service In Delhi Ncr,
 
7.pdf This presentation captures many uses and the significance of the number...
7.pdf This presentation captures many uses and the significance of the number...7.pdf This presentation captures many uses and the significance of the number...
7.pdf This presentation captures many uses and the significance of the number...
 
BEST Call Girls In Greater Noida ✨ 9773824855 ✨ Escorts Service In Delhi Ncr,
BEST Call Girls In Greater Noida ✨ 9773824855 ✨ Escorts Service In Delhi Ncr,BEST Call Girls In Greater Noida ✨ 9773824855 ✨ Escorts Service In Delhi Ncr,
BEST Call Girls In Greater Noida ✨ 9773824855 ✨ Escorts Service In Delhi Ncr,
 
VIP Call Girls Pune Kirti 8617697112 Independent Escort Service Pune
VIP Call Girls Pune Kirti 8617697112 Independent Escort Service PuneVIP Call Girls Pune Kirti 8617697112 Independent Escort Service Pune
VIP Call Girls Pune Kirti 8617697112 Independent Escort Service Pune
 
Call Girls In Radisson Blu Hotel New Delhi Paschim Vihar ❤️8860477959 Escorts...
Call Girls In Radisson Blu Hotel New Delhi Paschim Vihar ❤️8860477959 Escorts...Call Girls In Radisson Blu Hotel New Delhi Paschim Vihar ❤️8860477959 Escorts...
Call Girls In Radisson Blu Hotel New Delhi Paschim Vihar ❤️8860477959 Escorts...
 
Catalogue ONG NUOC PPR DE NHAT .pdf
Catalogue ONG NUOC PPR DE NHAT      .pdfCatalogue ONG NUOC PPR DE NHAT      .pdf
Catalogue ONG NUOC PPR DE NHAT .pdf
 
/:Call Girls In Jaypee Siddharth - 5 Star Hotel New Delhi ➥9990211544 Top Esc...
/:Call Girls In Jaypee Siddharth - 5 Star Hotel New Delhi ➥9990211544 Top Esc.../:Call Girls In Jaypee Siddharth - 5 Star Hotel New Delhi ➥9990211544 Top Esc...
/:Call Girls In Jaypee Siddharth - 5 Star Hotel New Delhi ➥9990211544 Top Esc...
 
Best Practices for Implementing an External Recruiting Partnership
Best Practices for Implementing an External Recruiting PartnershipBest Practices for Implementing an External Recruiting Partnership
Best Practices for Implementing an External Recruiting Partnership
 
Tech Startup Growth Hacking 101 - Basics on Growth Marketing
Tech Startup Growth Hacking 101  - Basics on Growth MarketingTech Startup Growth Hacking 101  - Basics on Growth Marketing
Tech Startup Growth Hacking 101 - Basics on Growth Marketing
 
rishikeshgirls.in- Rishikesh call girl.pdf
rishikeshgirls.in- Rishikesh call girl.pdfrishikeshgirls.in- Rishikesh call girl.pdf
rishikeshgirls.in- Rishikesh call girl.pdf
 
Keppel Ltd. 1Q 2024 Business Update Presentation Slides
Keppel Ltd. 1Q 2024 Business Update  Presentation SlidesKeppel Ltd. 1Q 2024 Business Update  Presentation Slides
Keppel Ltd. 1Q 2024 Business Update Presentation Slides
 
Call Girls Navi Mumbai Just Call 9907093804 Top Class Call Girl Service Avail...
Call Girls Navi Mumbai Just Call 9907093804 Top Class Call Girl Service Avail...Call Girls Navi Mumbai Just Call 9907093804 Top Class Call Girl Service Avail...
Call Girls Navi Mumbai Just Call 9907093804 Top Class Call Girl Service Avail...
 
RE Capital's Visionary Leadership under Newman Leech
RE Capital's Visionary Leadership under Newman LeechRE Capital's Visionary Leadership under Newman Leech
RE Capital's Visionary Leadership under Newman Leech
 
Lowrate Call Girls In Laxmi Nagar Delhi ❤️8860477959 Escorts 100% Genuine Ser...
Lowrate Call Girls In Laxmi Nagar Delhi ❤️8860477959 Escorts 100% Genuine Ser...Lowrate Call Girls In Laxmi Nagar Delhi ❤️8860477959 Escorts 100% Genuine Ser...
Lowrate Call Girls In Laxmi Nagar Delhi ❤️8860477959 Escorts 100% Genuine Ser...
 
Call Girls In Panjim North Goa 9971646499 Genuine Service
Call Girls In Panjim North Goa 9971646499 Genuine ServiceCall Girls In Panjim North Goa 9971646499 Genuine Service
Call Girls In Panjim North Goa 9971646499 Genuine Service
 
The CMO Survey - Highlights and Insights Report - Spring 2024
The CMO Survey - Highlights and Insights Report - Spring 2024The CMO Survey - Highlights and Insights Report - Spring 2024
The CMO Survey - Highlights and Insights Report - Spring 2024
 
Insurers' journeys to build a mastery in the IoT usage
Insurers' journeys to build a mastery in the IoT usageInsurers' journeys to build a mastery in the IoT usage
Insurers' journeys to build a mastery in the IoT usage
 

EABD Unit 2: Factors Affecting Demand Elasticity

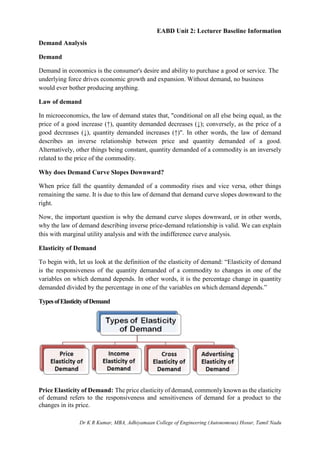
  • 1. EABD Unit 2: Lecturer Baseline Information Dr K R Kumar, MBA, Adhiyamaan College of Engineering (Autonomous) Hosur, Tamil Nadu Demand Analysis Demand Demand in economics is the consumer's desire and ability to purchase a good or service. The underlying force drives economic growth and expansion. Without demand, no business would ever bother producing anything. Law of demand In microeconomics, the law of demand states that, "conditional on all else being equal, as the price of a good increase (↑), quantity demanded decreases (↓); conversely, as the price of a good decreases (↓), quantity demanded increases (↑)". In other words, the law of demand describes an inverse relationship between price and quantity demanded of a good. Alternatively, other things being constant, quantity demanded of a commodity is an inversely related to the price of the commodity. Why does Demand Curve Slopes Downward? When price fall the quantity demanded of a commodity rises and vice versa, other things remaining the same. It is due to this law of demand that demand curve slopes downward to the right. Now, the important question is why the demand curve slopes downward, or in other words, why the law of demand describing inverse price-demand relationship is valid. We can explain this with marginal utility analysis and with the indifference curve analysis. Elasticity of Demand To begin with, let us look at the definition of the elasticity of demand: “Elasticity of demand is the responsiveness of the quantity demanded of a commodity to changes in one of the variables on which demand depends. In other words, it is the percentage change in quantity demanded divided by the percentage in one of the variables on which demand depends.” TypesofElasticityofDemand Price Elasticity of Demand: The price elasticity of demand, commonly known as the elasticity of demand refers to the responsiveness and sensitiveness of demand for a product to the changes in its price.
  • 2. EABD Unit 2: Lecturer Baseline Information Dr K R Kumar, MBA, Adhiyamaan College of Engineering (Autonomous) Hosur, Tamil Nadu In other words, the price elasticity of demand is equal to Numerically, Where, ΔQ = Q1 –Q0, ΔP = P1 – P0, Q1= New quantity, Q2= Original quantity, P1 = New price, P0 = Original price. The following are the main Types of Price Elasticity of Demand:  Perfectly Elastic Demand  Perfectly Inelastic Demand  Relatively Elastic Demand  Relatively Inelastic Demand  Unitary Elastic Demand Income Elasticity of Demand: The income is the other factor that influences the demand for a product. Hence, the degree of responsiveness of a change in demand for a product due to the change in the income is known as income elasticity of demand. The formula to compute the income elasticity of demand Is: For most of the goods, the income elasticity of demand is greater than one indicating that with the change in income the demand will also change and that too in the same direction, i.e. more income means more demand and vice-versa. Cross Elasticity of Demand: The cross elasticity of demand refers to the change in quantity demanded for one commodity because of the change in the price of another commodity. This type of elasticity usually arises in the case of the interrelated goods such as substitutes and complementary goods. The cross elasticity of demand for goods X and Y can be expressed as: The two commodities are said to be complementary, if the price of one commodity falls, then the demand for other increases, on the contrary, if the price of one commodity rises the demand for another commodity decreases. For example, petrol and car are complementary goods.
  • 3. EABD Unit 2: Lecturer Baseline Information Dr K R Kumar, MBA, Adhiyamaan College of Engineering (Autonomous) Hosur, Tamil Nadu While the two commodities are said to be substitutes for each other if the price of one commodity falls, the demand for another commodity also decreases, on the other hand, if the price of one commodity rises the demand for the other commodity also increases. For example, tea and coffee are substitute goods. Advertising Elasticity of Demand: The responsiveness of the change in demand to the change in advertising or rather promotional expenses is known as advertising elasticity of demand. In other words, the change in the demand because of the change in advertisement and other promotional expenses is called as the advertising elasticity of demand. It can be expressed as: Numerically, Where, Q1 = Original Demand Q2= New Demand A1= Original Advertisement Outlay A2 = New Advertisement Outlay These are some of the important types of elasticity of demand that helps in understanding the criteria of demand for the goods and services and the factors that influence the demand. DeterminantsofElasticityofDemand Apart from the price, several other factors influence the elasticity of demand. These are:
  • 4. EABD Unit 2: Lecturer Baseline Information Dr K R Kumar, MBA, Adhiyamaan College of Engineering (Autonomous) Hosur, Tamil Nadu 1. Consumer Income: The income of the consumer also affects the elasticity of demand. For high-income groups, the demand is said to be less elastic as the rise or fall in the price will not have much effect on the demand for a product. Whereas, in case of the low-income groups, the demand is said to be elastic, rise, and fall in the price have a significant effect on the quantity demanded. Such as when the price falls the demand increases and vice-versa. 2. Amount of Money Spent: The elasticity of demand for a product is determined by the proportion of income spent by the individual on that product. In case of certain goods, such as matchbox, salt a consumer spends a very small amount of his income, let us say Rs 2, then even if their prices rise the demand for these products will not be affected largely. Thus, the demand for such products is said to be inelastic. Whereas foods and clothing are the items where an individual spends a major proportion of his income and therefore, if there is any change in the price of these items, the demand will get affected. 3. Nature of Commodity: The elasticity of demand also depends on the nature of the commodity. The product can be categorized as luxury, convenience, necessary goods. The demand for the necessities of life, such as food and clothing is inelastic as their demand cannot be postponed. The demand for the Comfort Goods is neither elastic nor inelastic. As with the rise and fall in their prices, the demand decreases or increases moderately. Whereas the demand for the luxury goods is said to be highly elastic because even with a slight change in its price the demand changes significantly. But, however, the demand for the prestige goods is said to be inelastic, because people are ready to buy these commodities at any price, such as antiques, gems, stones, etc. 4. Several Uses of Commodity: The elasticity of demand also depends on the number of uses of the commodity. Such as, if the commodity is used for a single purpose, then the change in the price will affect the demand for commodity only in that use, and thus the demand for that commodity is said to be inelastic. Whereas, if the product has several uses, such as raw material coal, iron, steel, etc., then the change in their price will affect the demand for these commodities in its many uses. Thus, the demand for such products is said to be elastic. 5. Whether the Demand can be postponed or not: If the demand for a particular product cannot be postponed then, the demand is said to be inelastic. Such as, Wheat is required in daily life and hence its demand cannot be postponed. On the other hand, the items whose demand can be postponed is said to have elastic demand. Such as the demand for the furniture can be postponed until the time its prices fall. 6. Existence of Substitutes: The substitutes are the goods which can be used in place of one another. The goods which have close substitutes are said to have elastic demand. Such as, tea and coffee are close substitutes and if the price of tea increases, then people will switch to the coffee and demand for the tea will decrease significantly. Whereas, if there are no close substitutes for a product, then its demand is said to be inelastic. Such as salt and sugar do not have their close substitutes and hence lower is their price elasticity. 7. Joint Demand: The elasticity of demand also depends on the complementary goods, the goods which are used jointly. Such as car and petrol, pen and ink, etc. Here the elasticity of demand of secondary (supporting) commodity depends on the elasticity of demand of the major commodity. Such as, if the demand for pen is inelastic, then the demand for the ink will also be less elastic.
  • 5. EABD Unit 2: Lecturer Baseline Information Dr K R Kumar, MBA, Adhiyamaan College of Engineering (Autonomous) Hosur, Tamil Nadu 8. Range of Prices: The price range in which the commodities lie also affects the elasticity of demand. Such as the higher range, the rich people usually buy products, and they do not care much about the change in the price and hence the demand for such higher range commodities is said to be inelastic. Also, the lower range commodities have inelastic demand because these are already low priced and can be bought by any sections of the society. But the commodities in middle range prices are said to have an elastic demand because with the fall in the prices the middle class and the lower middle class are induced to buy that commodity and therefore the demand increases. But however, if the prices are increased the consumption reduces and as a result demand falls. Thus, these are some of the important determinants of elasticity of demand that every firm should understand properly before deciding on the price of their offerings. According to Evan J. Douglas, “Demand estimation (forecasting) may be defined as a process of finding values for demand in future time periods.” In the words of Cundiff and Still, “Demand forecasting is an estimate of sales during a specified future period based on proposed marketing plan and a set of particular uncontrollable and competitive forces.” The objectives of demand forecasting Factors Influencing Demand Forecasting Demand forecasting methods Qualitative /Survey Methods
  • 6. EABD Unit 2: Lecturer Baseline Information Dr K R Kumar, MBA, Adhiyamaan College of Engineering (Autonomous) Hosur, Tamil Nadu Delphi method: It is a forecasting process framework based on the results of multiple rounds of questionnaires sent to a panel of experts. Several rounds of questionnaires are sent out to the group of experts, and the anonymous responses are aggregated and shared with the group after each round. Nominal Method: A systematic and an organized group meeting held among the members to facilitate decision making by properly identifying the problems and generating the solutions thereof. The nominal group technique helps in preventing the discussion being dominated by a single person and hence, allow the silent members, who are quite shy, to speak out their ideas in the group. Market Research Method: Involves collecting necessary information regarding the current and future demand for a product. This method carries out the studies and experiments on consumer behavior under actual market conditions. In this method, some areas of markets are selected with similar features, such as population, income levels, cultural background, and tastes of consumers. The market experiments are carried out with the help of changing prices and expenditure, so that the resultant changes in the demand are recorded. These results help in forecasting future demand. Sales Force Composite: It is a forecasting method used to forecast the sales by adding up individual sales agents forecasts for sales in their respective sales territories. It is a bottom-up approach, which companies use to forecast more accurately. Sales agents have the most direct interaction with the customers and provide many valuable insights that help the companies boost their sales. Quantitative/ Statistical methods Time serious analysis The patterns that we may find in a time series of historical data include the average, trend, seasonal, cyclical and irregular components. The average is simply the mean of the historical data. Trend describes real growth or decline in average demand or other variable of interest, and represents a shift in the average. The seasonal component reflects a pattern that repeats within the total period of interest. The cyclical component shows recurring values of the variable of interest above or below the average or long run trend line over a multiyear planning horizon. The length of cycles is not constant, as with the length of seasonal peaks and valleys, making economic cycles much tougher to predict. Since the patterns are not constant, multiple variable models such as econometric and multiple regression models are better suited to predict cyclical turning points than time series models. The last component is what is left! The irregular component is the random variation in demand that is unexplained by the average, trend, seasonal and/or cyclical components of a time series. As in regression models, we try to make the random variation as low as possible.
  • 7. EABD Unit 2: Lecturer Baseline Information Dr K R Kumar, MBA, Adhiyamaan College of Engineering (Autonomous) Hosur, Tamil Nadu Last Period Method This method uses last year's sales for the next year's forecast. To forecast demand, this method requires the number of periods best fit and one year of sales order history. This method is useful to forecast demand for mature products with level demand or seasonal demand without a trend. Simple average method Under this method, simple average rate at cost is obtained by adding the rate of purchases represented by stock at the time of issue & then dividing the same by the number of such rates. The rate needs to be revised at the time of any new purchase or exhaustion of any existing stock. For ascertaining the average rate, the quantity by which each purchase is made has to be ignored. To dampen the severity of the effect of rises & falls in the purchase price, use of any kind of average rate is made. Thus, in case of fluctuating rates of purchase, average cost is used. However, obviously, cost is not properly represented by the average cost. Moving average methods A simple technique, which works well with data that has no trend, seasonality nor cyclic components, is the moving average method. Admittedly, this example data set has trend (note the overall growth rate from period 1 to 12), and seasonality (note that every third quarter reflects a decrease in historical demand). A three period moving average forecast is a method that takes three periods of data and creates an average. That average is the forecast for the next period. For this data set, the first forecast we can compute is for Period 4, using actual historical data from Periods 1, 2 and 3 (since its a three period moving average). Then, after Period 4 occurs, we can make a forecast for Period 5, using historical data from Periods 2, 3, and 4. Note that Period 1 dropped off, hence the term moving average. This technique then assumes that actual historical data in the far distant past, is not as useful as more current historical data in making forecasts. Before showing the formulas and illustrating this example, let me introduce some symbols. In this module, I will be using the symbol Ft to represent a forecast for period t. Thus, the forecast for period 4. I will use the symbol Yt to represent the actual historical value of the variable of interest, such as demand, in period t. Thus, the actual demand for period 1 would be shown as Y1. Now to carry forward the computations for a three period moving average. The forecast for period four is: F4 = (Y1 + Y2 + Y3) / 3 = (398 + 395 + 361) / 3 = 384.7 To generate the forecast for period five: F5 = (Y2 + Y3 + Y4) / 3 = (395 + 361 + 400) / 3 = 385.3 We continue through the historical data until we get to the end of Period 12 and make our forecast for Period 13 based on actual demand from Periods 10, 11 and 12. Since Period 12 is the last period for which we have data, this ends our computations. If someone were interested in making a forecast for Periods 14, 15, and 16, as well as Period 13, the best that could be
  • 8. EABD Unit 2: Lecturer Baseline Information Dr K R Kumar, MBA, Adhiyamaan College of Engineering (Autonomous) Hosur, Tamil Nadu done with the moving average method would be to make the "out period" forecasts the same as the most current forecast. This is true because moving average methods cannot grow or respond to trend. This is the chief reason these types of methods are limited to short term applications, such as what is the demand for the next period. Trend Projection Method The Trend Projection Method is the most classical method of business forecasting, which is concerned with the movement of variables through time. This method requires a long time- series data. ... In predicting demand for a product, the trend projection method is applied to the long time-series data. When a time series reflects a shift from a stationary pattern to real growth or decline in the time series variable of interest (e.g., product demand or student enrolment at the university), that time series is demonstrating the trend component. The trend projection method of time series forecasting is based on the simple linear regression model. However, we generally do not require the rigid assumptions of linear regression (normal distribution of the error component, constant variance of the error component, and so forth), only that the past linear trend pattern will continue into the future. The trend projection model is: Tt = b0 + b1 t where, Tt = Trend value for variable of interest in Period t b0 = Intercept of the trend projection line b1 = Slope, or rate of change, for the trend projection line Cause Effect Model Correlation and Regression: These involve the use of econometric methods to determine the nature and degree of association between/among a set of variables. Econometrics, you may recall, is the use of economic theory, statistical analysis and mathematical functions to determine the relationship between a dependent variable (say, sales) and one or more independent variables (like price, income, advertisement etc.). The relationship may be
  • 9. EABD Unit 2: Lecturer Baseline Information Dr K R Kumar, MBA, Adhiyamaan College of Engineering (Autonomous) Hosur, Tamil Nadu expressed in the form of a demand function, as we have seen earlier. Such relationships, based on past data can be used for forecasting. The analysis can be carried with varying degrees of complexity. Here we shall not get into the methods of finding out ‘correlation coefficient’ or ‘regression equation’; you must have covered those statistical techniques as a part of quantitative methods. Similarly, we shall not go into the question of economic theory. We shall concentrate simply on the use of these econometric techniques in forecasting. We are on the realm of multiple regression and multiple correlation. The form of the equation may be: DX = a + b1 A + b2PX + b3Py You know that the regression coefficients b1, b2, b3 and b4 are the components of relevant elasticity of demand. For example, b1 is a component of price elasticity of demand. The reflect the direction as well as proportion of change in demand for x because of a change in any of its explanatory variables. For example, b2< 0 suggest that DX and PX are inversely related; b4 > 0 suggest that x and y are substitutes; b3 > 0 suggest that x is a normal commodity with commodity with positive income-effect. Given the estimated value of and bi, you may forecast the expected sales (DX), if you know the future values of explanatory variables like own price (PX), related price (Py), income (B) and advertisement (A). Lastly, you may also recall that the statistics R2 (Co-efficient of determination) gives the measure of goodness of fit. The closer it is to unity, the better is the fit, and that way you get a more reliable forecast. The principle advantage of this method is that it is prescriptive as well descriptive. That is, besides generating demand forecast, it explains why the demand is what it is. In other words, this technique has both explanatory and predictive value. The regression method is neither mechanistic like the trend method nor subjective like the opinion poll method. In this method of forecasting, you may use not only time-series data but also cross section data. The only precaution you need to take is that data analysis should be based on the logic of economic theory.