University of Utah Health Wellness Champion Poster Session 2019
•
2 likes•1,613 views

The Wellness Champions at the University of Utah College of Nursing analyzed survey data which showed high rates of burnout, stress, and lack of control over workload among faculty and staff. To address these issues, they focused on building an infrastructure to foster a culture of wellness. Initial improvements included wellness presentations in meetings, establishing a Wellness Committee, and plans for a wellness tile in their internal system. A follow up survey found that these changes increased the visibility of wellness and were well received. Moving forward, they aim to continue facilitating a supportive culture of wellness.

Recommended
Recommended
More Related Content
What's hot
What's hot (20)
Similar to University of Utah Health Wellness Champion Poster Session 2019
Similar to University of Utah Health Wellness Champion Poster Session 2019 (20)
More from University of Utah
More from University of Utah (20)
Recently uploaded
Recently uploaded (20)
University of Utah Health Wellness Champion Poster Session 2019
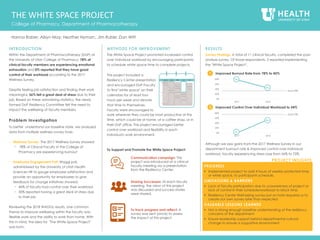
- 1. INTRODUCTION Within the Department of Pharmacotherapy (DoP) at the University of Utah College of Pharmacy, 78% of clinical faculty members are experiencing emotional exhaustion and 0% reported that they have good control of their workload according to the 2017 Wellness Survey. Despite feeling job satisfaction and finding their work meaningful, 56% felt a great deal of stress due to their job. Based on these astonishing statistics, the newly formed DoP Resiliency Committee felt the need to impact the wellbeing of faculty members. Problem Investigation To better understand our baseline state, we analyzed data from multiple wellness survey tools: • Wellness Survey: The 2017 Wellness Survey showed: − 78% of Clinical Faculty in the College of Pharmacy are experiencing burnout • Employee Engagement Poll: Waggl poll, administered by the University of Utah Health Sciences HR to gauge employee satisfaction and provide an opportunity for employees to give feedback for change initiatives showed: − 46% of faculty had control over their workload − 30% reported having a great deal of stress due to their job Reviewing the 2018 WAGGL results, one common theme to improve wellbeing within the faculty was flexible work and the ability to work from home. With this in mind, the idea for "The White Space Project" was born. METHODS FOR IMPROVEMENT The White Space Project promoted increased control over individual workload by encouraging participants to schedule white space time to complete projects. work wherever they could be most productive at this time, which could be at home, at a coffee shop, or in their DoP office. This project encouraged better control over workload and flexibility in each individual's work environment. To Support and Promote the White Space Project: RESULTS Survey Findings: A total of 11 clinical faculty, completed the post- analysis survey. Of those respondents, 2 reported implementing the "White Space Project". Although we saw gains from the 2017 Wellness Survey in our department burnout rate & improved control over individual workload, faculty experiencing stress rose from 56% to 72%. College of Pharmacy, Department of Pharmacotherapy Hanna Raber; Alisyn May; Heather Nyman;, Jim Ruble; Dan Witt PROGRESS Implemented project to add 4 hours of weekly protected time, or white space, to participants schedule. LIMITATIONS & BARRIERS Lack of faculty participation due to unawareness of project or lack of control in their schedule/workload to block time. Resiliency Center Well-being survey put on hold required us to create our own survey later than expected VALUABLE LESSONS LEARNED Not a strong enough baseline understanding of the resiliency concerns of the department Ensure leadership support behind departmental cultural change to ensure a supportive environment PROJECT INSIGHTS Communication campaign: This project was introduced at a clinical faculty meeting via a presentation from the Resiliency Center. Sharing Successes: At each faculty meeting, the vision of this project was discussed and success stories were shared. To track progress and reflect: A survey was sent (once) to assess the impact of this project. THE WHITE SPACE PROJECT This project included a Resiliency Center presentation and encouraged DoP Faculty to find "white space" on their calendars for at least four hours per week and devote that time to themselves. Faculty were encouraged to MON TUE WED THU FRI 8 12 5 0% 20% 40% 60% 80% 2017 2018 Goal 33% • Improved Burnout Rate from 78% to 45%1 78% 45% 0% 20% 40% 60% 80% 2017 2018 Goal 73% • Improved Control Over Individual Workload to 54%2 0% 54%
- 2. INTRODUCTION Due to the Williams Building's displaced location in Research Park, accessing wellness resources is challenging. Our aim is to increase access to wellness activities available on-site. Our wellness initiatives intend to create an environment at the Williams Building that meets the unique needs of staff through leveraging existing wellness offerings and opportunities, as well as creating new opportunities. Problem Investigation Our Wellness Team conducted a baseline analyses to identify barriers that prevented the Division of Critical Care staff at the Williams Building from engaging in wellness activities. Voice of the Customer: interviews & surveys of the Division staff reported barriers to participation including awareness and accessibility (located off campus, shuttle availability to main campus, etc.). METHODS FOR IMPROVEMENT Our goal is to create an environment that meets the unique needs of staff at the Department of Pediatrics Division of Critical Care located in the Williams Building. These needs are multifaceted and fluid. Crowdsourcing Ideas: In order to crowdsource potential ideas and activities, the Wellness Team at the Division utilized a web-based idea management software platform called IdeaScale. Launched in late in October 2018, the group developed a campaign to solicit ideas from Division staff on the types of wellness activities they would be interested in (figure 3). The campaign was launched in conjunction with a ‘Lunch & Learn’ presentation from the Wellness & Integrative Health (WIH) team. One- quarter of the Division staff attended the presentation and many expressed surprise at available resources which they had not heard about prior to the presentation. RESULTS & NEXT STEPS The Division of Critical Care Wellness Team has forged relationships with contacts from the Wellness Center, the Resiliency Center, RD-Approved, and PEAK. These relationships and the identification of a Wellness Ambassador will be important in communicating available wellness offerings and providing feedback on potential new offerings. WELLNESS AT THE WILLIAMS BUILDING Department of Pediatrics, Division of Critical Care Eduardo Zamora; Diane Hartford; Lisa Winter; Stephanie Busch; Maggie Mair PROGRESS Developed key partnerships with wellness resources. Implemented a crowd sourcing tool to collect ideas for additional wellness activities based on wellness wheel categories. LIMITATIONS & BARRIERS Wellness team members changed during the project. Scheduling time with leadership to discuss purpose and goals was challenging. VALUABLE LESSONS LEARNED Engage with your leadership early and often. Clearly message goals and intentions of project to gain inclusive support. PROJECT INSIGHTS Continue to moderate the IdeaScale campaign to encourage ideas and assess interest in wellness activities at the Williams Building. 1 2 Identify a department Wellness Ambassador and establish ongoing relationship with WIH team to design potential new offerings based on IdeaScale suggestions. ASK“WHY”5TIMES What is the abnormal condition? Limited access of wellness activities in the Williams Building Why is there limited access to wellness activities? Because there is limited coordination of wellness activities at the Williams Building Why are wellness activities not coordinated? Because wellness activities are sponsored/organized by multiple entities across the U of U campus Why are wellness activities are organized across multiple entities across the UU campus? Because information is shared/accessed based on your network or the path you access it Why is information shared/accessed differently? Because wellness is valued differently across groups and people Why is wellness valued differently? Root Cause - Because wellness is multifaceted, unique, and fluid to the individual. The current environment does not meet the needs of staff at the Williams Building Figure 2: 5 Why’s Root Cause Exercise Brainstorm Sessions: identified wellness issues and organized using a cause/effect diagram (aka fishbone). Categories were: method, awareness, transportation, environment, and culture (Figure 1). Root Cause ‘5 Whys’ Analysis: identified the complexity of wellness and the need to diversify to meet the needs of individual wellness perceptions (Figure 2). Based on our investigation findings, the team will focus on the following: 1. Improving access to activities to Division employees in the Williams Building 2. Increasing awareness of ongoing U Health official and unofficial wellness activities available Figure 1: Cause/Effect Diagram Figure 3: IdeaScale Promotion
- 3. INTRODUCTION The 2017 University of Utah Health Burnout survey showed improvement in burnout (emotional exhaustion 44% in 2016 to 33% in 2017), however decrease in satisfaction in role (89% in 2016 to 67% in 2017) and decrease in control over workload. A follow-up survey was administered to further clarify areas for improvement. Key findings included: isolation between providers, poor communication, lack of awareness of colleagues’ passion/projects, and burden of activities and meetings outside of work hours. With these in mind, the monthly PM&R faculty meeting was identified as an opportunistic space to build connections/collegiality and establish a culture of respect. Problem Investigation Less: Financial updates; Minimally, relevant topics and outside speakers. To improve participation & collegiality: Create inclusive environment; Elicit individual feedback; Optimize pertinence to practice of topics; Agree upon and enforce a code of respect and professional standards; Include updates on others’ professional interests and practices, personal spotlights, and IRB’s and opportunities for collaboration; Consider team building activities. METHODS FOR IMPROVEMENT Targeting faculty meeting with the goal to optimize content, collegiality, cohesiveness, and respect, we have: Reviewed survey findings with new (Oct 2018) division chair Established culture and communication group to analyze initial survey findings and target areas for change. Initial changes implemented with chair transition at first new chair faculty meeting: Environment/ambience change (soft lights, new table setup), food/nutrition improvements, personalized introduction by chair (family, extracurricular interests, work interests), introduction of tricycle model for division (large clinical front wheel, research and academic/teaching back wheels), optimization of inclusiveness and feedback elicited from different specialties, thanks/respect given to all members present, suggestions elicited on a variety of topics, humor integrated. 1. Defined 3 deliverables for faculty meets: make decisions, educate, and relate (build connections) 2. Asked for individual feedback: "Who are you?", "Why medicine?", "Why academic medicine at the UofU?", "Why are you here?" 3. Introduced potential to explore/reformat faculty meeting: Value-added purpose/content, ground rules for communication/respect, frequency of meeting, location of meeting (SOM, UUOC, restaurant, rotating location), time of meeting. Changes implemented at 2nd new chair faculty meeting: 1. Staff/faculty recognition with Starbucks card reward for exception recent work. 2. Mindfulness speaker and group practice; UofU mindfulness resources (for patients and staff/faculty) introduced. FUTURE CONSIDERATIONS • Content / Structure − Condense and rotate updates (finance, sites, new hospital) − Transparency from policy committees − Strategic planning session to develop PM&R Vision Statement − Agenda prior to meeting − Limit outside speakers − Optimize relevance • Professionalism & Respect − Utah Leadership Training Office professionalism session or reinforcement of SOM professionalism standards to optimize respect • Collegiality & Culture − Employee recognition and faculty spotlights, personal and professional − Updates on IRB’s & collaborations − Team building activities − Wellness interventions at start of meeting (i.e. mindfulness practice, movement, etc.) • Logistics − Frequency, time, & location of meeting FACULTY MEETING REDESIGN Division of Physical Medicine & Rehabilitation Alan Davis, MD (co-lead) and Rebecca Wilson Zingg, DO (co-lead); Candace Floyd, PhD; Richard Kendall, DO; Abbie Paxman; David Steinberg, MD PROGRESS Assessed faculty to determine what needed to change and got buy in from new chair. In progress with target deadline of April 1, 2019 LIMITATIONS & BARRIERS Change of chair in October 2018, impacted time of implementation but ultimately acted as great transition point for change VALUABLE LESSONS LEARNED How much culture of respect and limited collegiality are affecting our division PROJECT INSIGHTS 1 2 3 4 Figure 2: Fishbone diagram PM&R FACULTY MEETING P E O P L E S T R U C T U R E C U L T U R E L O G I S T I C S / O T H E R F I S H B O N E D I A G R A M Problem Statement: Why is faculty meeting the way that it is? How can we engender a culture of respect, collegiality, and value? food Time of day Day of week Frequency Historical structure Topics/interests represented Required content Elective content/speakers Place Faculty present Leadership/facilitation Personalities Diverse specialties/interests Multiple institutions Participation Tone of meeting Cohesiveness/Collegiality Efficiency, 5.78 Transparency of Information, 5.59 Culture of Respect, 5.44 Topic Relevance, 5.39 Collegiality, 5.28 Professional Interests, 5.24 Openness, 5.22 Ease of Participation, 4.89 Faculty Meeting Survey Figure 1. Faculty were asked to rank meeting components in a survey on a scale of 1 to 10 with 10 being best. The PM&R faculty meeting has grown organically under multiple, different active and interim chairs. Faculty were asked to rank meeting components in a survey on a scale of 1 to 10 with 10 being best (figure 1). Results from Survey: All categories ranked between 4.89-5.78 with efficiency of meeting ranking highest and ease of participation ranking lowest. 60% of faculty felt disrespect at meeting. Open Ended Survey Responses: Add/More: Hospital, research, and faculty updates; Site updates; Vision plan; Multi-disciplinary, relevant topics; Transparency in policy and policy committees; Agenda sent in advance.
- 4. INTRODUCTION The UU College of Nursing (CON) has the highest faculty burnout rates across the health science colleges and schools with 51% of faculty and 34% of staff reporting emotional exhaustion + depersonalization. As CON Wellness Champions, we aim to foster and facilitate a culture of wellness, to make it a place that people are energized and passionate about coming to work. Problem Investigation To better understand our baseline state, we analyzed data from multiple wellness survey tools: Wellness Survey: Resiliency Center October 2017 survey: − 51% faculty/34% of staff report emotional exhaustion + depersonalization − 80% of faculty and 34% of staff report feeling a great deal of stress because of their job − Only 22% faculty/49% staff report feeling a sense of control over workload Employee Engagement Poll: The Waggl poll, administered in May 2018 by the University of Utah Health Sciences Human Resources to gauge employee satisfaction and provide an opportunity for employees to give feedback for change initiatives, showed: − 53% of faculty and 38% staff feel they cannot express opinions for fear of retribution or retaliation − 76% faculty and 50% staff reported no perceived control over their workload. Faculty & Staff Feedback: College Spring Retreat on 4/27/18 showed areas to address: − Being able to communicate without repercussions − Dedicated support for wellness opportunities and activities − Flex time and telecommuting options for staff METHODS FOR IMPROVEMENT Based on the consistent themes regarding wellness among these three evaluations, we focused our initial improvements on building an infrastructure to foster a culture of wellness in our College for staff and faculty. Our Wellness Champion project is to increase visibility of wellness in the College of Nursing with the goal of facilitating a culture of wellness. The improvements satisfaction/evaluation surveys will be conducted as needed with faculty and staff to track progress and reflect on effectiveness. RESULTS Faculty and Staff responses in our November 2018 College wide survey: • 73% stated the visibility of wellness in the College has increased in the past 6 months • 95% stated that the six presentations in College Council and Quarterly Staff Meeting increased wellness visibility • 92% stated that the presence of a Wellness Committee has helped increase wellness visibility • • 78% stated that a wellness tile in Pulse would increase access to wellness materials Promoting a Culture of Wellness & Resilience in the College of Nursing College of Nursing, University of Utah Katarina Friberg Felsted, PhD; Jennifer Clifton, DNP, FNP-BC, CNE, CCHP; Sue Chase-Cantarini, DNP, RN, CHSE; Jenneth B. Doria, DNP, MS, RN; Hollie J. Fuhrmann, MA; Erin Meyer, PhD, C-IAYT, E-RYT; Patrick Murphy; Lisa J. Taylor-Swanson, PhD, MAcOM, EAMP; Sunnavy Thomson, MPH PROGRESS Identified wellness as a major concern in three significant evaluations in the past year, through both quantitative and qualitative sources. Built foundation for a culture of wellness through awareness, resources, and a dedicated committee to evaluate needs and implement changes. LIMITATIONS & BARRIERS An erroneous yet wide-spread belief that resilience is merely a personal not a systemic problem. Overcoming the perception that wellness is ‘fluffy’ rather than an integral part of a healthy workplace culture and crucial for employee productivity. VALUABLE LESSONS LEARNED The necessity of persistence and multi- pronged approaches in creating cultural change The strength of the data captured and incorporated in our initiatives PROJECT INSIGHTS 1 2 3 1. Establish CON Wellness Committee Explore and implement ideas to promote wellness. After meetings with interested faculty and staff, the Dean, Interim Dean, and the Executive Committee (EC), the establishment of a permanent Wellness Committee was approved as a subcommittee directly reporting to the EC. All committee members volunteered and this trend continues. 2. Promote Wellness Regularly engage faculty and staff in evidence- based wellness activities. The Wellness Committee plan and implement wellness presentations at each College Council and Quarterly Staff Meeting on topics raised at the College Spring Retreat such as email etiquette, mindfulness practice, and the RD approved program 3. Wellness Resources Share resources for wellness through a central location, the College of Nursing Pulse site. The Wellness Pulse tile has recently been created as a repository for articles, web links, meeting minutes, and Quarterly Staff Meeting and College Council presentations. 4
- 5. INTRODUCTION The Sorenson Legacy Foundation Center for Student Success seeks to create culture of wellness among our team members in order to put into practice and role model the values of the College of Health on a weekly basis. We implemented a multi-pronged wellness initiative in order to address key concerns and needs. Key needs for our team members in order to improve wellness, reduce the chance of burnout, and improve the work environment were identified as: 1) Increased time flexibility and 2) The opportunity for out of office interaction that includes activity and/or stress relief during work hours. PROBLEM INVESTIGATION Baseline state was examined by the following: A GEMBA WALK which showed a lack of any natural light in the center for student success office, no suitable outside seating area in close proximity to the HPR building for lunch breaks, etc.., a lack of shade around the HPR building for staff members to sit outside comfortably in warmer/sunnier weather. ASSESMENT among Center for Student Success faculty/staff which elicited feedback in person and by email from all staff/faculty in the center about needs, barriers, and opportunities surrounding wellness (physical activity, health, mindfulness, stress management). To analyze the baseline state data we used: FISHBONE DIAGRAM to assess causes of challenges (lack of natural light, lack of access to outdoor environment, lack of physical activity, lack of consistent interactions with colleagues, a lack of control over work schedules and work loads at certain times in the academic year. We analyzed feedback from needs, barriers, and opportunities assessment and several key themes surfaced: - A desire for time during the work day for physical activity and mindfulness - A desire to connect with other co-workers and encourage each other to keep up with wellness behaviors - Barriers surrounding lack of opportunity for fitness/physical activity time during the day - Barriers surrounding access to fitness facilities and/or cost of facility membership - Busy/stressful times of the year for staffers that affect their wellness. METHODS FOR IMPROVEMENT An obtainable goal for the Wellness Champion team was to address barriers to physical fitness. We created a schedule and streamlined access to workout facilities in our HPR building complex for Center for Student Success staff/faculty. To support the communications and access process we implemented the following: Paper Flyer/Schedule to assure faculty/staff were aware of offerings and that access was available weekly Email Reminders describing access and offerings for staff/faculty to assure staff/faculty were aware of offerings and were consistently reminded about the benefits Physical Activity/Wellness Log to remind team members to track progress To track progress and reflect on effectiveness of the improvement the team used: Quarterly Scorecard self report by staff of usage of facilities, PEAK classes, and wellness behaviors GOALS 1) Improve quality outcome by increasing amount of positive staff interaction in faulty/staff members in the Center for Student Success of interactions by 10/1/2018. 2) Improve quality outcome by increasing perceptions of wellness in faculty/staff members in the Center for Student Success from 0 self reported increase in wellness activities to 1 self reported increase in wellness by 11/15/2018. 3) Assess resiliency and level of burnout among Center for Student Success faculty/staff members 4) Improve quality outcome by decreasing level of perceived stress among faculty/staff members in the Center for Student Success RESULTS 2018 WELLNESS COLLABORATIVE College of Health, Center for Student Success Gardner, E [L]; Belt, D [M]; Beyene, Y [M]; Brown, L [M]; Lindsey, S [M]; Paisley, K [M]; Park, B [M] Goal 1: “The best part of the Wellness Champion initiative was talking supportively about taking better care of ourselves and encouraging each other to stick to health goals” Team Member 2 PROGRESS Completed LIMITATIONS & BARRIERS Lack of funding, not receiving a Wellness Grant for outdoor seating area, initial barrier of a nearby and affordable access to physical activity facility, and lack of control over workload for staff during busy times of the academic year. VALUABLE LESSONS LEARNED The majority of team members reported utilizing the physical activity room in HPR East after we secured consistent weekly access times. Team members reported that they enjoyed the time allotted during the workday for physical/wellness activities and wanted to continue the program. Most members reported that they had engaged in physical activity/wellness offerings together with another colleague (walking in Huntsman Arena, working out in the HPR East room together and setting goals as a group). PROJECT INSIGHTS 1 2 3 Goal 2: “The Best part of wellness champion initiative for me was getting access to HPR East Workout room, and while I was there, I found a peak class that worked for me and signed up and that have been helping me a lot with my Workouts and Nutrition plans. I really feel like I am getting closer and closer to my goal of being fit and healthy.” Team Member 1 Goal 3: Our small team of 7 faculty/staff reported no signs of burnout and all agreed or strongly agreed that they were “satisfied with their job” according to the burnout survey conducted by the Resiliency Center in November 2018.
- 6. INTRODUCTION As Wellness Champions, we received feedback from providers that the food provided by their centers for meetings was often not healthy. As part of overall University of Utah Wellness Center goals, we feel that improving the healthfulness of meals brought in for staff meetings demonstrates concern for provider wellness, helps providers return to work after meetings feeling healthy and energized, and is part of an organizational commitment to health. Problem Investigation Community Clinics administrative staff order provider lunches from a variety of locations, and use factors such as cost, convenience (ie delivery, speed of obtaining food) to determine food choices. Variable degrees of attention to the healthfulness of this food have been paid. A survey of community clinics providers showed: Assessment of the food quality in terms of healthy choice/nourishment, 26% rated poorly [score 1-4] and 45% rated satisfactory [score 5-7] (figure 1). Assessment of energy levels after eating at meetings showed 13% rated low energy [score 1-4] and 56% rated moderate energy [score 5-7] (figure 2). Comments showed a variability of opinions in current selection (figure 3). METHODS FOR IMPROVEMENT 1. We began by collecting data from each center about who ordered lunches, where they ordered from and what their budgets and any other constraints were. 1. We then worked with Registered Dietitians (RD) from the Wellness Center who analyzed menus and offered healthier choices on those menus, as well as general suggestions for healthy food choices. 1. These were then shared with center administrators. Catering Guidelines Catering Menu / Suggestions NEXT STEPS We have surveyed providers pre implementation of these changes, and plan to repeat the survey in several months to see if there has been change. We will continue to encourage an improvement in healthful options for catered lunches. IMPROVING THE QUALITY OF CENTER LUNCHES Community Physicians Group Margaret Solomon, MD; Carolyn Sanchez, MD; Ann Lokuta; Anne Taylor PROGRESS Gathered information from centers about who orders lunch and where they order from. Working with a registered dietician, we developed recommendations on healthier options and a list of healthy food suggestions. Initial survey sent to providers about food choices at meetings. Will re-survey in 3 months. LIMITATIONS & BARRIERS Time to work on project. Some lack of responsiveness from center managers ordering food VALUABLE LESSONS LEARNED Variability among providers: some really care about healthier food choices while others either don't think it is an important issue or don’t have an opinion. Identify someone in each center to work directly with the person in their center who orders food, and help them select a more appealing and healthier menu. PROJECT INSIGHTS 10% 4% 8% 4% 12% 14% 20% 20% 8% 2% 1 2 3 4 5 6 7 8 9 10 0% 5% 10% 15% 20% 25% 8% 2% 2% 2% 21% 12% 23% 27% 2% 2% 1 2 3 4 5 6 7 8 9 10 0% 5% 10% 15% 20% 25% 30% 1 2 General tips Meal-specific tips Meal-specific examples Nutritional guidelines to meet Registered Dietician approval requirements. Frequently used companies from survey Specific healthy complete meals from each caterer Listed price per person 3 Figure 1. Using a scale of 1-10 with 1 being very poor and 10 being excellent, how would you rate the quality (in terms of healthy choices, nourishment) of the food at your monthly provider meetings? Figure 2. On a scale of 1-10, with 1 being exhausted/no energy, 5 being okay/some energy, and 10 being great/energetic, how would you describe your energy level for clinic after provider meetings Energy lever for clinic after provider meetingsQuality of food (healthy choice and nourishment) − More vegetarian, vegan or seafood options. Less carbs − Usually it's pastries and carbs , not what any of us needs. Finally coffee is available. Plain yogurt, real fruit is nice. − Needs to taste good, more than just healthy. Not everyone likes kale and lawn clippings. − I think the choices have been fine and see no need to change. There are some healthy options for those who want as well as less healthy options for those who are less concerned “ “ Figure 3. Variety in Provider Comments
- 7. INTRODUCTION Message handling is a crucial issue which affects patient care and satisfaction, and also provider wellness. There has been little standardization of in-basket management in the Community Clinics. Medical Assistants who are the first to handle messages in the in-basket have little formal training on how to address them, resulting in many calls and my chart messages being forwarded directly to the provider without being triaged or having work done before routing messages. Problem Investigation Data review: Volume of weekly in- basket messages ranged by provider (figure 1). Process Analysis: Showed many messages were being routed to provider before any MA action taken METHODS FOR IMPROVEMENT Our improved design creates standardized in-basket flows for common calls, provides guidance to MAs on how to effectively manage these calls with minimal provider work, and embeds this process into Epic to make sure it is sustainable and easy to use. Message Type Analysis: Over serval weeks, providers flagged in-basket messages that they felt would benefit from a standardized process. These were then reviewed with the group and a list of fifteen (15) common message types were determined for intervention: − WIC Form Request − DMV Form Request − Physical Form Request − Work/School Excuse Request − FMLA/Disability Form Request − Logisticare Form Request − Other Forms − Forms Received Ahead of Visit Standardized Workflows: Providers worked with the lead MA, who also has experience with Epic optimization, to develop standardized workflows that encouraging MAs to work at the top of their licenses, improving responsiveness to messages, and facilitating more rapid complete responses to patients. (figure 2) − Dot phrases were created to support the improved processes within the MA’s usual workflow. Implementing & Training: Our lead MA met individually with each MA on our team to review these tools and how to use them. Reminder signs on computers listed available dot phrases. GOALS We aim to decrease the number of messages providers receive daily, decreasing in-basket volume and work, and allowing providers to complete their daily work more efficiently; by February 1, 2019: Goals will be monitored in a monthly scorecard. IN-BASKET FLOW Departments of Internal Medicine and Pediatrics – Redwood Health Center Margaret Solomon, MD; Tyler Nelson; Brian Head; Mitchell Cannon, MBA PROGRESS Identified message types to standardize practices, designed workflows, created "dot phrases" in Epic, and trained medical assistants in new workflows. LIMITATIONS & BARRIERS Time constraints to work on this Changes in team members caused delays VALUABLE LESSONS LEARNED If you have an idea, even if it seems overwhelming to make it work, and even if it is only a small step or small piece of the bigger pie, it is worth trying it and then going back to see if it worked. Tap into institutional resources (Value Engineers, lead MAs, Epic support, Wellness staff) to help make the project happen. These people are great at what they do. PROJECT INSIGHTS • Reduce the total volume of weekly phone and MyChart messages received by providers from 174 messages to 157 messages. • Reduce the median time messages sit in a provider’s in-basket from 14.07 hours to 12.5 hours. • Reduce the median time messages sit in the MA message pool from 1.63 hours to 1.55 hours. 1 2 3 Figure 1: Baseline weekly in-basket volume by provider, averaged by month. 0 10 20 30 40 50 60 70 80 90 100 Provider1 Provider2 Provider3 Provider4 Provider1 Provider2 Provider3 Provider4 Provider1 Provider2 Provider3 Provider4 Provider1 Provider2 Provider3 Provider4 July August September October Average Weekly In-Basket Volume Calls Messages − Citizenship Forms − Home Health Orders − Appointment Request − Pharmacy Calls − Lab Request − Referral Request − Overdue Results Figures 2: Sample workflows created for a few of the identified message types.
- 8. INTRODUCTION The motto of the Cystic Fibrosis Foundation is "Adding Tomorrows." Caring for patients with a terminal disease can negatively affect work/life balance and can contribute to compassion fatigue and burnout. Our goal is to reduce burnout and improve the work/life balance of the University of Utah Cystic Fibrosis care team through a challenge geared toward healthy lifestyle choices and team building. Problem Investigation In a group brainstorming session, the Wellness Champion team discussed options on how to engage team members to improve work life balance. Our pre-challenge survey surprised us with only 13% of the team experiencing emotional exhaustion, about 20% below the University of Utah Health average. Additionally, 73% of the team rated their work/life balance a 7 or higher on a scale from 1 to 10. METHODS FOR IMPROVEMENT The Wellness Champion team designed a 12-week challenge to reinforce or create new, easy, and healthy habits. Weekly challenges were decided upon by researching other worksite wellness programs and from past conferences where self care and wellness were discussed. A team luau was hosted at the end of the 12-week challenge to celebrate everyone's success. RESULTS Our original goal of increasing level of work/life balance in the cystic fibrosis team from 7.2 on a scale of 1 to 10 to 8 did not come to fruition. Many participants have expressed interest in another challenge or continuing parts of this challenge, especially the weekly walks. NEXT STEPS • Design a spring 2019 Wellness Challenge • Start a walking group that continues outside of challenge weeks Daily Challenges, One Each Week ‘ADDING HEALTHY TOMORROWS’ WELLNESS CHALLENGE Division of Pulmonology – Cystic Fibrosis Team Jessica Francis, CCRC; Alice Moe, MA ; Lynda Roe, CPhT; Gretchen Anderson, DNP, FNP-C; Mary Andolsek, LCSW PROGRESS Designed and completed a 12-week challenge LIMITATIONS & BARRIERS Lacked buy in or participation from some team members. However, many others wholly embraced the challenge. VALUABLE LESSONS LEARNED Our teams burnout rate was significantly lower than the average UUH employees. The teams biggest 'complaint’ was their clinic environment, which is not an area where we could affect change. Try to understand the barriers that keep team members from participating. PROJECT INSIGHTS Great to have non work things to do with coworkers“ “ - Do a hobby for 30 minutes - Drink 1 litre of water - Get 7 hours of sleep - Walk 30 minutes - Mediate for 10 min a day - Floss daily - Eat one home cooked meal - Use the stairs - List 3 things you are grateful for - Use a reusable water bottle - Compliment someone - Eat five servings of fruits veggies daily Figure 2: Wellness Challenge Score Card Figure 1: Ex. Weekly Response Sheet 1 2 Those that participated received weekly emails with reminders about the current week's challenge and reported back with their involvement at the end of each week (figure 1) through a survey. Bonus challenges were spread throughout the 12 weeks. Individuals’ participation was tracked in a score board (figure 2). By displaying the challenge board in the hallway, team members were reminded of the challenge daily and hopefully inspired to participate. However, the post-survey results showed that many participants continued activities after the overall challenge was completed. Favorite challenges were 30 minute hobby, drink water, sleep, and 30 minute walk (figure 3). 0 2 4 6 Try a New Activity Eat five servings of… Compliment a… Use a Reusable… List 3 things you are… Use the stairs at work Visit a New Place Meditate for 10… Floss daily Walk 30 Minutes Get 7 hours of sleep Drink 1 litre of water Do a hobby for 30… Favorite Challenge Figure 3. Top 3 favorite challenges from 15 participants
- 9. INTRODUCTION It is well understood that burnout is a contributor to faculty attrition, stress for individuals and teams, can lead to increased rate of errors, lack of enthusiasm for work, and even depression, suicidality and substance abuse. In the long term, burnout can contribute to the development of chronic diseases like coronary artery disease and type 2 diabetes. Burnout can be understood as both an individual and organizational problem and both have been shown to help improve wellness and decrease burnout. In a 2017 baseline study across departments in the School of Medicine at the University of Utah, the Physician Assistant Faculty, reported baseline high job satisfaction along with higher than institutional average for signs of burnout. In response to this, the PA division wellness champions facilitated staff and faculty development of simple cultural changes that the team believed could improve wellness culture and decrease individual burnout and measured the impact of these two interventions 3 months after implementation. Problem Investigation 2017 University of Utah Wellness Survey: showed high job satisfaction of 89% of faculty who are overall satisfied with their jobs, however 44% demonstrate signs of burnout (n=9). There was a correlation between hours worked and burnout (Pearson correlation = .587). Additionally, the 2016 University of Wellness Survey found 57% of faculty to show signs of burnout, though a limited sample size of 7. METHODS FOR IMPROVEMENT Design Improve Wellness by enacting office hours policy and restrictions on sending and receiving emails to staff and faculty by 15% as measured by standardized wellness scoring after 3 months. To communicate we used an internal ranked survey given to faculty and staff in which they ranked top choices, generated from the group, for cultural changes. These changes were brought back to the group at a division meeting and implementation was agreed on and a technological support tool for scheduling office hours was also developed. To support the improved process: google calendar for posting office hours, POST IMPLEMENTATION SURVEY FINDINGS RESULTS CULTURE CHANGE TO PROMOTE WELLNESS AMONG PA FACULTY Department of Family and Preventive Medicine, PA Division Joanne Rolls, MPAS, PA-C; Amanda Moloney-Johns, MPAS, PA-C PROGRESS In progress. Interventions were decided upon, implemented and short-term data (3-month impact) has been collected. LIMITATIONS & BARRIERS Culture change, in general, is difficult. A 3 month follow up interval may not show actual change. VALUABLE LESSONS LEARNED Engage all stakeholders from the onset of developing sustainable cultural change. PROJECT INSIGHTS 62% of PA faculty implemented office hours in the last 3 months. 1 2 62% of PA faculty modified specifically sending/receiving emails only between 7am and 6pm. 1 Review survey feedback regarding barriers to implement, attempt to remove barriers and reassess in three months. I really like this… If I do find myself working on email after hours- this initiative actually helps me to think about how urgent it is that I send something and I am more mindful about this. “ “ including location and virtual access, was created, access give to faculty and students could view this calendar. To track progress we are checking in at division meetings, every 1-2 months. 62% 38% Implemented office hours and/or modified email behavior in last 3 months Yes No Barriers to Implementations Office Hours - Other meetings - Students not attending - Location of office hours Email Culture - Urgent responses required - No time to catch up on email during standard work hours - Stress that comes from not checking NEXT STEP 3 Post intervention survey results demonstrated a burnout rate of 33% with a sample size of 21, a decrease from 44% in 2017.
- 10. Use of a Provider Feedback Survey Tool to improve Wellbeing Department of Family and Preventive Medicine, Division of Family Medicine INTRODUCTION Engagement and resilience in physicians is impacted by multiple factors (Figure 1), emphasizing the need for personalized interventions. The Division of Family Medicine Wellness Champions (WC) in partnership with leadership developed and implemented a quarterly anonymous provider survey in 2016 to facilitate an ongoing improvement process for provider wellness (Figure 1). Articulated concerns and constructive solutions resulted in a number of systematic changes that increased communication, reduced burnout and increased a sense of control. This project examines the ongoing impact during the second year. Amy Locke MD, Katie Fortenberry PhD, Erika Sullivan MD, Sonja Van Hala MD METHODS FOR IMPROVEMENT We used 2016 - 2018 survey data to assess the following: burnout, control over work, satisfaction with work, meaning in work. Division data was benchmarked to national and local data among school of medicine faculty. Quarterly surveys assess issues of most concern to providers in supporting wellbeing in the following areas: administration, clinic, personnel, division, scholarship, teaching, wellness, service, responsiveness to concerns. Issues were brought up in each of the key drivers of engagement and resilience (Figure 2 and Table 1). Each quarter we asked participants about responsiveness to concerns. The second year of the project resulted in modifications of how data was reviewed and reported. At the two year mark, we looked at usefulness of the tool, value to leadership and providers, as well as impact on work wellbeing. RESULTS PROGRESS The quarterly survey continued to identify issues impacting faculty wellness over the second year. LIMITATIONS & BARRIERS Several difficult to address issues came up repeatedly, leading to a sense of inaction and frustration. VALUABLE LESSONS LEARNED This model, which has been exported to other groups at the University of Utah, has the potential to reduce burnout in health care in a variety of settings. This project requires a close ongoing working relationship and open communication with leadership to be successful. Our next step is to implement workgroups to address challenging issues with regular reporting expected. Burnout decreased dramatically between year 1 and year 2 (Figure 3), related to a number of high level changes. However, burnout increased in year 3, corresponding with a decrease in sense of control over workload (Figure 3). Possible explanations include frustration with changes not yet made, and perceptions of decreasing leadership involvement. Figure 2 Figure 3 Figure 4 Table 1 Action Plans Implemented in the Division to Improve Provider Wellbeing Issues Identified Quotes Changes Taken Category Long hours of operation; inconsistent workload “Close the clinics at 7 pm. It is rare to find a provider or a patient who would rather see or be seen after 7. We are only open then out of convenience for scheduling and room access.." Condensed hours of clinic operation improved individual flexibility Templated scheduling to reduce variation Workload; Work-life Integration Faculty frequently bumped out of clinic to accommodate residents “If you want providers that are going to be here for a long time and continue doing a quality job, there needs to be better scheduling practices.” Schedule faculty first and then residents to reduce faculty bumps out of clinic Control Some faculty overburdened by covering attending “The number of resident clinics to cover is too many and it is too challenging to cover the additional slots when people go on vacation.” Adjusted payment to faculty for attending residents to encourage more consistent staffing Workload Frequent charting after hours “need more staff support to answer endless Mychart requests/ labs” “Keep moving on optimizing the team- based approach to inbox management. We've made great progress so far.” Expansion of Dragon Medical secretary role In-basket management work group Clinic flow and efficiency work group Efficiency; Workload Faculty struggle with academic work “no time, support, mentorship or structure to do any research / scholarly work other than CQI and even then that is fragmented” Mentorship of junior faculty writing Support for faculty scholarship and career development Culture and Values Desire to schedule vacations into the future “It was pretty stressful to not know about time off for summer being ok'd until quite late this year.” Process for advance scheduling to allow time away planning Work-life Integration Poor communication “Need more time as a group to discuss how to manage issues whether it is scheduling, clinic flow, team function, etc. Too much being told how things will go and what will happen and too little on deciding together what makes the most sense.” Recommend time set away to discuss quarterly Work groups to address tough issues. Culture and Values; Social Support and Community PROJECT INSIGHTS PROCESS OF QUARTERLY SURVEY ADMINSTRATION TO FAMILY MEDICINE PROVIDERS Figure 1
- 11. INTRODUCTION Results from the 2017 University of Utah Health Wellness survey indicated faculty and staff at the Eccles Health Sciences Library (EHSL) lacked good morale and a unifying team mindset. Workplace studies show that adding a social context to work through employee clubs can be an effective way to increase moral, reduce stress levels, boost overall health and well-being, and foster team bonding.1,2 The Club Eccles (CE) project was inspired by the 2018 U.S. Women's Olympic Cross-Country Skiing Team’s mantra3: CE enables employees with similar interests to spend 30 minutes or more per week together, participating in activities they enjoy, while developing collegiality and camaraderie. PROBLEM INVESTIGATION Baseline: • Feedback from Fall 2017 University of Utah Health Wellness Survey • Ideas generated by an EHSL follow-up meeting with the Resiliency Center The most significant needs identified: morale and team building METHODS FOR IMPROVEMENT To develop collegiality and comraderies, Club Eccles was developed and provided a variety of employee-suggested, extracurricular clubs that had “something for everyone.” Employees could choose an Timeline RESULTS EHSL monthly employee survey (Y/N): Has participating in CE this month improved your morale at work? Has participating in CE made you feel like you were part of a team? CLUB ECCLES Spencer S. Eccles Health Sciences Library Sarah Dickey, Erica Lake, MLS, AHIP; Melissa Rethlefsen, MLS, AHIP; Catherine Soehner, BSN, MLS • 50% of employees answered “Yes” to one of the two questions on improved moral and team building. • Scores from the 2018 survey show a 25% increase in wellbeing scores from the 2017 baseline survey. • 5 of the 8 clubs voted to continue even after project ended in Sept. PROGRESS Completed LIMITATIONS & BARRIERS None, happily reported VALUABLE LESSONS LEARNED Sometimes the simplest approaches are best PROJECT INSIGHTS 2 3 Do what’s right for me in a way that’s right for we “ “ Mar Apr May Jun Jul Aug Sep Oct Nov Project Development 8 Clubs Employee Signup ≥ 1 Club Eccles Launch Evaluate Data Wrap Up & Celebrate! Library-wide Picnic activity they enjoyed, and that best fit into their work schedule, family obligations, and other time commitments, thus relieving potential stress. 1. Lunch Club 2. Hiking Club 3. Craft Club 4. Tea Time 5. Nap Club 6. Walking Club 7. Book Club 8. Yoga Club Club Eccles Offerings 4 13.15% 11.10% 86.85% 88.90% JUNE/JULY AUGUST No Yes • Nearly 90% of participants reported CE improved morale & team inclusion. 1 REFERENCES: 1. Shevory, Kristina. “The Workplace as Clubhouse.” New York Times, February 16, 2008, https://www.nytimes.com/2008/02/16/business/yourmoney/16money.html. Accessed April 10, 2018; 2. Barton, Tynan. “The motivational impact of sports and social clubs.” Employee Benefits, October 24, 2013, https://www.employeebenefits.co.uk/issues/motivation-and-recognition-supplement-2013/the-motivational-impact-of-sports-and-social-clubs/. Accessed April 10, 2018; 3. Pokorny, Annie. “How the U.S. team completely rebuilt the culture of women's cross-country skiing -- then won the first Olympic gold ever.” ESPN W, March 16, 2018, http://www.espn.com/espnw/life-style/article/22780439/how-us-team-rebuilt-culture-women-cross-country-skiing-won-first-olympic-gold-ever. Accessed April 10, 2018 CLUB ECCLES
- 12. INTRODUCTION The Clinical Staff Education (CSE) department at Huntsman Cancer Institute (HCI) is a group of nurse educators that function in a unique capacity while facing role-specific challenges. Educators are expected to perform in a leadership role; however, trainings afforded to other organizational leaders are not always available. They also hold responsibility for all employee education and competency verification but have no authority to hold employees accountable. Their workload and expectations are consistently high. Many of the challenges faced are the same throughout the department. When challenges are not addressed, nurse educators may experience increased compassion fatigue and burnout. The 2017 Engagement Survey asked employees to rate the statement, "My organization helps me deal with stress and burnout." The HCI CSE department's survey results were low at 36.4%, compared to a benchmark of 41.3% throughout the organization. The goal of this project was to identify departmental stressors and implement appropriate interventions to address them. Problem Investigation To understand our baseline state burnout we examined: Burnout Survey: The department was below average (36.4%) compared to the organizational average of 41.3%) for engagement. Professional Quality of Life (ProQOL) scale: A standardized tool used to measure compassion fatigue, with a sub-scale that includes burnout, was administered in May 2018 and results showed compassion fatigue and employee burnout within the department. Engagement survey: The HCI CSE department was significantly below the benchmark in several areas, specifically job satisfaction and employee engagement. Qualitative survey: Educators were asked to specify what contributed to burnout, and responses were compiled with the following themes extracted: 1. Perceived lack of support / growth 2. Intradepartmental negativity 3. High workload METHODS FOR IMPROVEMENT Our problem investigation showed a clear need to address burnout to provide an optimal work environment with specific themes in improving professional support and team culture. 1. Professional Support To address the perceived lack of continued professional growth, several group classes and team building activities were implemented. 2. Team Culture To promote a positive work environment and improve collaboration the nurse educators took ownership for planning and implementing team building activities, including service projects and intradepartmental celebrations. Weekly huddle with whiteboard to display significant team events for the week Recognition board: Publicly display peer appreciation and recognition Monthly highlighted behavioral standard: Theme of the month displayed in department office Team building through service project & team retreat RESULTS NEXT STEPS Team suggestions to promote an optimal work environment included: Celebrating success Increase support and advocacy for the department Continued trainings and team building DECREASING BURNOUT IN NURSE EDUCATORS Huntsman Cancer Institute (HCI) - Clinical Staff Education Department Cassidy Kotobalavu BSN, RN, OCN; Mary-Jean Austria MS, RN, OCN; Amanda Keddington MSN, RN, CCRN, OCN Scores related to all ProQOL scales improved between May 2018 & November 2018. Changes in burnout scores were the most significant. Nurse educators reported team building and educational trainings were most valuable. Frequency of comments related to negativity and workload decreased. PROGRESS Identified two opportunities for improvement: (1) professional support and (2) team culture Successfully implemented several interventions with 6 months of data LIMITATIONS & BARRIERS Adding Wellness Champion project responsibilities on top of required daily work VALUABLE LESSONS LEARNED Sponsorship and support from management helps to remove barriers The Value Summary can be a useful tool to organize and communicate your work Involving team in planning and implementing activities contributed to ownership and buy-in PROJECT INSIGHTS 1 2 3 Professional Growth & Support Class Topics Leadership Personal Resilience Effective Communication 15 20 25 30 35 40 45 Baseline (May 2018) 6 Months (November 2018) ProQOL Results Compassion Satisfaction Burnout Seconday Traumatic Stress SCORE LEVEL 22 or less Low 23 - 41 Avg 42 or more High 21% 23% 42% 39% 35% 24%
- 13. INTRODUCTION Recently, there has been increased awareness of burnout and poor mental health amongst healthcare providers. Studies show it begins in medical school and can peak in residency where the greatest contributing factor is lack of control of one’s schedule and available personal time. Evidence suggests that residents have higher rates of burnout and depression compared with population controls. Studies show this trend continues into practice. Problem Investigation Two consecutive University of Utah GME Resident Wellness surveys found the Ophthalmology residents to have an 80% burnout, significantly higher than the University of Utah Resident average of 59%. The first survey set the record for highest level-of- burnout amongst any University of Utah residency program but had 56% program response rate. The second survey, though no longer the highest level of burnout across university residency programs, had a 100% response rate and demonstrated the same degree of burnout - 80%. METHODS FOR IMPROVEMENT Design To improve sense of control and ultimately burnout, a proposal to provide residents with residents a predetermined administrative half day once a month, was presented to faculty. Upon approval, residents could choose what activity they did during their administrative hours. Results of how time was spent is described in figure 1. Summary Per the internal anonymous resident surveys, we found the administrative time was used for: GME Resident Wellness Survey Results Rate of burnout decreased from 80% in 2017 to 30% in 2018! This was likely multifactorial, but there was a consensus amongst residents that the administrative time was the most impactful change. RESULTS NEXT STEPS • Announcing the favorable survey results at faculty meetings and house staff meetings to reinforce to all the success of this program. • A quarterly reminder to faculty and check-in with residents to ensure the administrative time continues to be protected. • Internal resident surveys/reports were issued (biannually) regarding the use of their administrative time and perceived impact on wellness using a Likert-type scale. RESIDENT ADMINISTRATIVE TIME TO REDUCE BURNOUT Moran Eye Center Christopher J. Ricks, MD; Michael K. Burrow, MD; Jeff H. Pettey, MD; Griffin J. Jardine, MD PROGRESS Implemented administrative half days for ophthalmology residents. LIMITATIONS & BARRIERS Getting Faculty buy-in VALUABLE LESSONS LEARNED A key component of burnout is the perception that we in health care “lack control: over our schedules and lives that makes us feel enslaved to our responsibilities and work. Any effort to restore control has significant impact on well- being. Give residents administrative time, they love it! PROJECT INSIGHTS Spring 2017 Summer 2017 Fall 2017 Summer 2018 All participants indicated administrative half-days are extremely beneficial to personal wellness and that compared to other wellness activities offered by the University, academic half-days are much more beneficial. 1 2 3 Exceeded goal to reduce burnout in the Ophthalmology Residency Program. 0% 20% 40% 60% 80% Oct 2015 Jan 2017 Apr 2018 Goal 40% 1 80% 30% Faculty agreement to implement First implementation attempt, 25% success rate Adoption at 50% with reiteration at each meeting 100% fully implemented 29% 28% 13% 13% 18% Administrative Activity Study Wellness Activities Research Technical/Surgical Skills Practice Other (presentations, patient care, paperwork) Figure 1. Results from survey on residents chosen activity during admin hours. 80%
- 14. A Compassionate Workplace Starts With YOU Sue Childress MN, RN, OCN; Melissa Banner MSN, RN, OCN Huntsman Cancer Institute at the University of Utah Health BACKGROUND Huntsman Cancer Institute (HCI) is an NCI designated cancer hospital. During a three year period this organization addressed concerns related to moral distress, workload, and environment to create a more “Compassionate Workplace.” Although metrics from the ProQOL V survey instrument showed a modest improvement, comments revealed the need to continue work related to civil communication. Senior leaders and front line managers all agreed that holding staff accountable to the behavior standards was going to start with THEM. INTERVENTIONS • All managers were expected to take two of the hospital’s iLead classes: Leading at the Speed of Trust and Crucial Conversations • Staff were encouraged to use the incident reporting system (RL6) for any type of incivility displayed by providers, staff, and/or patients/visitors • The HR department collaborated with training and processes to address employee issues • A Civility task force was created including front line staff, managers, directors and Organizational Development representation. HCI Executive Leadership recognized that support of a Compassionate Workplace through civil communication began at the top, with a commitment to address behavior at all levels. OUTCOMES • Managers and Directors completed iLead classes • Behavior related reporting increased significantly • HR provided managers with clear guidelines and support to hold employees accountable for their behavior. • Physician leadership established a clear guideline for MD/APC behavior standards and follow-up • University leadership, Customer Service and Risk management provided strong support for patient/visitor expectations PURPOSE The purpose of this initiative was to improve communication across the organization and create a civil environment that supports productive patient care and employee satisfaction. Training and Education Reporting Events Accountability A Compassionate Workplace that emphasizes civil communication can lead to improvements in: • Quality • Patient Satisfaction • Financial bottom line We have many people to thank for participation in this multi year project but it would not have been possible without our senior leaders – Ben Tanner, HCI Executive Director and John Sweetenham MD, HCI Senior Director, Clinical Affairs NEXT STEPS • The Civility Task Force, composed of front line staff, are developing a program that will “hard wire” our PROMISE (Behavior) Standards into every day work practices. • Collaborating with the HR Organizational Department, the task force is developing training for front line staff to reinforce civil communication.
- 15. INTRODUCTION Work-related chronic musculoskeletal pain and injury are common amongst surgeons. These injuries stem largely from poor operating room ergonomics or a lack of surgeon understanding of how best to optimize the operating room environment to minimize injury. The goal of this project is to define the prevalence of work-related pain and/or injury, assess knowledge of operating room ergonomics and the role ergonomics play in causing injury, educate how to optimize ergonomics, and intervene on behalf of those with pain or injury. PROBLEM INVESTIGATION Voice of the customer analysis showed chronic pain and/or injury is common amongst surgeons at the University of Utah. Surgeon Survey: The Department of Surgery Grand Rounds was used as a platform to discuss project and survey intent, we have surveyed all surgeons at the University of Utah for prevalence of work related chronic pain and/or injury, surveyed their knowledge of the role of operating room ergonomics in causing injury and their understanding of how to optimize ergonomics to prevent injury, and implement an intervention on behalf of affected surgeons in partnership with Physical Therapy. The survey was developed by Mark Savarise, MD, MBA (University of Utah) in partnership with Tatiana Catanzarie, MD (UCSD/Kaiser Permanente) with support of the American College of Surgeons. Preliminary data from the initial survey of general surgery faculty are as follows: Chronic pain and work-related injuries stemming from inadequate attention by surgeons to operating room ergonomics are common. This is a significant detriment to the well-being of surgical faculty at the University of Utah. This issue is a consequence of inadequate training of the importance of optimal operating room ergonomics and a failure of surgeons to recognize the importance of proper ergonomics in preventing work-related pain and injury. To date, our faculty have not received formal training in work place ergonomic optimization. GOAL MINIMIZING WORK PLACE INJURY BY OPTIMIZING OPERATING ROOM ERGONOMICS Department of Surgery David Ray, MBA; Robert Glasgow, MD; Yvonne Savarise, DPT; Mark Savarise, MD, MBA PROGRESS Partnered with UCSD and the American College of Surgeons to develop and implement survey to gain a better understanding of the current problem. In process of developing solutions based on preliminary data findings. LIMITATIONS & BARRIERS Finding time to work on project in addition to team’s overall workload VALUABLE LESSONS LEARNED Pain and injuries are common in surgeons Wellness Champions should ask for help earlier in their projects PROJECT INSIGHTS Reduce surgeon work-related injury and/or chronic pain stemming from poor optimization of operating room ergonomics in all surgeons from 25% to 10% by 7/1/2019. 1 NEXT STEPS Educate surgeons of the importance of optimizing the above ergonomic variables to minimize the chance of sustaining work related pain and injury. 1 Resurvey following intervention to track progress and reflect on effectiveness of improvement 3 Work with Physical Therapy to evaluate and treat affected surgeons 2 Ergonomics is the interface between the surgeon and the operating room. Anything related to the operating room that influences how a surgeon physically does an operation is included. This includes physical layout of the OR, operating room table height and angle, and surgeon related variables such as posture, arm/shoulder/neck angles, etc. ERGONOMICS er·go·nom·ics | noun 1 : an applied science concerned with designing and arranging things people use so that the people and things interact most efficiently and safely — called also biotechnology, human engineering, human factors 2 : the design characteristics of an object resulting especially from the application of the science of ergonomic 50-60% of respondents reported work-related pain including chronic neck, back and shoulder pain 15-20% had defined injuries 50% of surgeons noted gaps in their understanding of proper operating room ergonomics 1.5% of general surgery training programs in the US have formal programs to address ergonomics
- 16. INTRODUCTION As healers, we often forget to take care of ourselves. Our team identified social disengagement between providers and staff, as well as different departments within primary care; Family Medicine, Internal Medicine, Pediatrics. A project working on social connectedness would decrease absenteeism, improve staff health, mental acuity, reduce mistakes and errors, and improve patient care. METHODS FOR IMPROVEMENT Local Wellness Committee: First, a multidisciplinary committee was established with representation from internal medicine, family medicine, and pediatrics. Also diversified in social traits (introvert/extrovert). The committee met regularly at beginning and then moved to monthly once established. Scale of Workplace Social Connectedness: To understand our baseline workplace social connectedness, a survey adapted from the Social Connectedness Scale (Lee, R. M., & Robbins, S. B., 1995). Wording of questions adjusted to accurately reflect community of interest (i.e. workplace vs. general community). Questions were also added to assess for interpersonal preference (i.e. extrovert/introvert) and willingness to participate in social activities during or after work hours. RESULTS & REFLECTION Attendance to the 1st potluck was high and fell during the 2nd and 3rd. The social connectedness survey was reapplied and showed a mild decrease in connection, with an average pre score of 31.81 and post score of 32.28 with the lower number indicating more connectedness. CREATING A COMMUNITY OF SUPPORT Primary Care – South Jordan Health Center Michael Bouck, LCSW; Carolyn Sanchez, MD; Shane Gardner, RN; Linda Herrera, RN; Kelsee Wride, PharmD; Clint Christofferson, MA; Elizabeth Starr, MA; Erica Styles, MA; Jennifer Bills, MA; Rebekah Johnson PROGRESS Developed local wellness committee, increased awareness of wellness in department, developed measurement for social connectedness, and hosted 3 events LIMITATIONS & BARRIERS Barriers were both personal and systematic. Social event attendance barriers included perceived expectation to contribute food and having to use clinic or personal time (clock-out) to attend. Providers and MA’s do not frequently use email and Outlook calendars so those channels did not work well for promotion and reminders. Flyers were more effective for promotion but are not effective at reminding. VALUABLE LESSONS LEARNED Let attendees know the goal of the social events to promote intermingling and staying for the full event. For future social events, rotating with a variety of activities could sustain engagement and increase appeal to different types of people. Work with leadership to increase incentives to attendance and participation. PROJECT INSIGHTS Most significant response “I feel a sense of community at work” decreased from 2.09 to 1.96. 1 Figure 1 shows the pre-intervention social connectedness survey results. Pre-test results showed moderate feelings of connectedness between employees. There was a fairly even mix of introverts and extroverts in the survey sample. Survey also showed a preference in social activities during work hours (4.72) over after work activities (4.06). Social Events: The committee determined a lunch event would be most accessible and respect the preference for activities during work. We have successfully hosted 3 events: − Monthly 1.5 hour open house style potluck. − Two people from the committee were in charge of theme, sign up sheet, plus setup and cleanup. − Word of mouth, flyers and emails were used to promote the events. It’s difficult for me to use my skills and talents without someone working close beside me, 3.75 My job is less satisfying without a close friend at work, 2.91 I don’t participate with anyone or any group at work, 4.09 Even among my closest colleagues, there is no sense of community, 4.34 I don’t feel a sense of connectedness with coworkers, 4.06 Even around people I know at work, I don’t feel I belong, 3.97 I participate in groups more for the friendship than the activity, 3.41 Working side by side with others is more gratifying than working alone, 4.28 I’m more productive when I work alone, 2.71 I have a close friend at work, 3.84 My thoughts and ideas are important to my coworkers, 3.84 I feel a sense of community at work, 3.78 I feel connected with people at work, 4.03 STRONGLY AGREE NEUTRAL STRONGLY DISAGREE STRONGLY DISAGREE NEUTRAL STRONGLY AGREE Scale of Social Connectedness Figure 1: Scale of Social Connectedness Pre-Intervention Score out of 5. 1
- 17. INTRODUCTION The Department of Surgery employs over 70 Nurse Practitioners (NP) and Physician Assistants (PA) in a variety of roles across it's 9 Divisions. Between Divisions, there lacks uniformity of annual evaluations or recognition of contributions by these Advanced Practice Clinicians (APC). University-wide, APCs do not have a career advancement track and limited faculty roles available. With over 500 APCs in University of Utah Health, this is a large number of individuals without a career advancement model. Our turnover rate for APCs is higher than we would prefer, and while our average APC in the Department has been with us for nearly 4 years, those who leave typically do so after just 2-3 years. Most APCs reach optimal proficiency at 18-24 months, so these losses shortly thereafter increases the burden on the system in both lost productivity and strain on the remaining team members. We are in an optimal position to look at retaining the talent we have and feel that providing recognition for professional contributions and advancement opportunities will improve APC fulfillment in their current roles. Problem Investigation METHODS FOR IMPROVEMENT As one of many measures to address job satisfaction and retention among NPs and PAs in the Department of Surgery, we have looked into creating a career progression model. This would allow for consistent recognition of efforts by APCs in a variety of areas such as clinical standardization/optimization, research, education, outreach, and mentorship. We have developed a draft career ladder which will now be evaluated for possible implementation. GOAL CAREER PROGRESSION OPPORTUNITIES FOR NPs & PAs Department of Surgery – Advanced Practice Clinicians Charity Coe, PA-C; Julie O’Brien, APRN; David Kendrick PA-C, Andrea Schindler APRN; Robert Glasgow, MD; David Ray, MBA PROGRESS Learned more about the current state of the Department of Surgery APCs and their professional expectations and advancement. Draft of career progression model under review, with collaboration with other Departments to create a system that is as uniform as possible. LIMITATIONS & BARRIERS Lack of senior leadership of the over 500 NPs and APCs in the organization makes standardization a challenge. VALUABLE LESSONS LEARNED Important changes take time and patience to achieve a worthwhile result Collaboration and buy-in are key to a project’s success. PROJECT INSIGHTS Increase NP and PA opportunities for professional growth in The Department of Surgery though implementing an evaluation and professional progression model across the Department, ideally within the next year. 1 Career Progression Model: The MA and RN career ladders show career progression up to four levels with a focus on years of experience and obtaining specific certifications (figure 1). The Physician (and other clinical faculty)promotion criteria aligns with the School of Medicine missions in four areas of accomplishment: clinical practice, education, investigation, and administration (figure 2). Promotion is based on demonstrating excellence in two areas and effectiveness in the other two areas, as well as external involvement/dissemination (figure 1). APC Roles & Responsibilities: Our APCs provide high-quality clinical care and are involved in optimizing processes to further streamline patient care, including informatics. Academic responsibilities include lecturing or precepting students, as well as others who embrace a more formal research role. To encourage these type of highly engaged individuals to thrive at the University of Utah, we would propose an advancement model that is more than time, certification and job- based, such as the MA/RN models, to one that encourages well rounded APCs to thrive in our Department, similar to the physician model. AREAS OF ACCOMPLISHMENT EXCELLENCE EFFECTIVE C L I N I C A L P R A C T I C E Direct patient care or oversight; develop algorithms, care process models, protocols or templates; decision support tools to improve patient care; participation in quality improvement projects or programs; − Service on clinical guidelines or professional society committee − Dissemination of QI projects − Presentations on clinical topics. − Improve care or clinical education. − Deliver high quality care − Participation in QI projects − Ongoing commitment to maintaining and improving clinical skills. E D U C A T I O N Dissemination of knowledge, skills, and attitudes to trainees, faculty members, clinicians, staff, colleagues, patients, and the public within or external to the institution. Education includes teaching activities; learner assessment; curriculum development; mentoring, advising, and supervising; and educational leadership and administration. − Service on curriculum committees − Dissemination of curricula or teaching methods − Presentations on educational topics − Curricular development − Participation in at least one area of education − Ongoing commitment to improving educational skills − Positive assessments I N V E S T I G A T I O N Generate or advance creation or development of new knowledge. These could include such activities as bench research, clinical trials, quality improvement, and evaluation of educational efforts. Team science, clinical care, collaboration, technology commercialization, education, community engagement, advocacy, inclusion, sustainability, web-based dissemination, administration / service, and global health. − Authorship on peer-reviewed original articles − Peer-reviewed, durable workshops − Commercialized innovation that improves patient care/outcomes − Other metrics that demonstrate durable dissemination and impact. − Participation in investigation projects that have impact. − Substantial contributions to enrolling patients in published clinical trials − Completion of QI projects. A D M I N I S T R A T I O N Leadership and work within and outside the institution on committees; participation in organizational efforts to meet strategic goals; and program or unit leadership. Service includes leadership and work as part of inclusion, sustainability, outreach, and other service efforts. May overlap with other areas of accomplishment. − Service on admin/service related committees − Presentations related to admin/service − Dissemination of admin/service innovation − Developmental, scholarly, or investigational contributions − Participation in administrative / service roles Figure 2. Clinical Track Areas of Accomplishment LEVEL 1 LEVEL II LEVEL III LEVEL IV MEDICAL ASSISTANT Experience < 6 mo 6 mo – 3 years 3+ years 3+ years Certification MA by 6 mo MA MA MA Leadership Role - - Operations responsibilities Lead MA REGISTERED NURSE Experience < 1 year 1 – 5 years 5+ Being Developed Certification RN Residency RN RN + Ntl. Nursing Cert. Degree - - Nursing Bachelors (BSN) Leadership Role - - Charge Nurse / Preceptor INSTRUCTOR ASSISTANT PROF. ASSOCIATE PROFESSOR PROFESSOR PHYSICIAN Areas of Accomplishment Emerging Commit 2 Areas of Excellence 2 Areas of Excellence 2 Areas of Effectiveness 2 Areas of Excellence 2 Areas of Effectiveness Involvement / Dissemination - - Excellence outside of division / department Excellence outside of the institution Figure 1. Career advancement models for Medical Assistants, Nurses, and Clinical Physicians.
- 18. INTRODUCTION In 2017, Imagine Perfect Care awarded the Redwood Health Center a grant to build a community garden to improve patient care. With the garden construction completed in early 2018, the garden manager and Redwood stakeholders decided to use the garden to engage patients in better self-care for chronic illnesses, focusing on a clinic-wide goal to improve diabetes control for their patients with an A1C greater than 8%. Problem Investigation In 2017 only 66.5% of diabetic patients at Redwood Health Center were considered controlled with an A1C of ≤ 8%. Identified Barriers: psycho-social barriers, medication costs, cultural practices, inconsistent patient outreach, lack of education, and preexisting conditions. Voice of the Customer: Diabetes impacts relationships in patients lives. Health challenges interrupt activities of daily living or other areas of functioning (e.g. sleep, diet, food prep, energy levels). More understanding about diabetes management is desirable. Literature review findings: Greater self- efficacy has been associated with positive self-care behaviors in patients with T2DM1. Studies focused on improving patient access to produce found improved health outcomes in patients with diabetes2. METHODS FOR IMPROVEMENT Our team developed an 8-month gardening program that promotes healthy living and empowers skill development through: 1. Educational Resources: A packet of available diabetic and healthy living resources was developed and given to each participant. We also partnered with USU extension for class on using garden produce for healthy meals. 2. Group Therapy: 8 group sessions were held to address psycho-social barriers to change. Themes for sessions came from Voice of Customer analysis. 3. Access to Healthy Food: A plot was designated to each participant to grow food of choice. Promoting the Garden Program Internal Campaign: Project team presented at each department staff meeting in Redwood Health Center to provide details about the program with written and verbal instructions to refer patients. Patient Promotion: Patients were given information about the program via MyChart messages, in person consultations, and referrals from providers or staff. Interested individuals were given appointments with the project team and were then offered placement in the program depending on interest. Patient Flyer: Provided information on the Diabetes Care Team, Classes, and Other Resources for support with managing diabetes. Dot Phrase in Epic: Inserted in diabetic patient notes, provided information on the Diabetes Care Team, Classes, and Other Resources for support with managing diabetes. RESULTS Project evaluations and a focus group reported the program to be helpful. At least half of the participants took part in all activities involved with the program, with all participants utilizing appointments with specialists. Additionally, most of the participants found the individual gardening and living well classes helpful and all found appointments with specialists helpful. • Participants with controlled A1c, an indicator of diabetic wellness, increased from 40% to 60%. • Self-efficacy for diabetes, which measures confidence in doing certain activities on a scale of 1- 10, showed a positive increased from 6.45 to 7.35. ENGAGING PATIENTS IN HEALTHY LIVING Redwood Health Center Garden Program Megan Whitlock, LCSW; Michael Bouck, LCSW; Teresa Lopez, LCSW; Julia Ewanowski, LCSW; Hannah O’Neil, CSW; Shauna Chong Lee PROGRESS Completed 8-month long healthy living garden program. LIMITATIONS & BARRIERS Maintaining engagement over 8 months is challenging. Despite high interest, patients were not always able to attend all the activities. Learning to grow food and maintain plot was a barrier for many first time gardeners. Picking up produce in a timely fashion can be difficult. Staff participation is difficult without dedicated shift time to tend garden. Monetary incentives were provided for attendance to the therapy group sessions. These were well-received but may not be sustainable. VALUABLE LESSONS LEARNED Partnering with community experts such as the Edible Campus Garden and nearby agricultural schools as well as a dedicated garden manger would help inform the best use of the garden space and ensure upkeep. Administrative support is needed to improve patient access to produce. Next year we hope to implement a dedicated space in clinic for free produce pick up for patients in need and promotion of available produce from providers . PROJECT INSIGHTS 1 2 References: 1. Aljasem LI, Peyrot M, Wissow L, & Rubin RR. (2001). The impact of barriers and self-efficacy on self-care behaviors in type 2 diabetes. Diabetes Education, 27(3):393–404; 2. Weinstein, E., Galindo, R., Fried, M., Rucker, L., & Davis, N., (2013). Impact of a Focused Nutrition Educational Intervention Coupled With Improved Access to Fresh Produce on Purchasing Behavior and Consumption of Fruits and Vegetables in Overweight Patients With Diabetes Mellitus. The Diabetes Educator, 40 (3), 100-106. doi/abs/10.1177/0145721713508823 Loved this program! Participating in the gardening program allowed me to use more fresh vegetables in my meals, being mindful of what is a healthier option. “ “
- 19. DEPARTMENT OF INTERNAL MEDICINE WOMEN'S WORLD CAFÉ Dori Knight; Mandy Skonhovd; Aaron Bell RESILIENCY CENTER | DEPARTMENT OF INTERNAL MEDICINE PROJECT VISION BASELINE ANALYSIS Participants in the Women's World Café educated leaders on historical concerns and identified several areas of immediate improvement or focus. WORLD CAFÉ METHOD AND PROJECT OVERVIEW A World Café helps to foster calm and deep conversations with less debate and more listening by using five structured communication techniques: 1. Structuring Innovation: Invite participants to gather in small groups to discuss shared challenges 2. Arranging the Space: Tables with the advertised topic of conversation, with 5 to 7 seats at each, are assigned a facilitator to keep the discussion on track and conversation flowing 3. Distributing Participation: Everyone is included in the conversations and provided with equal opportunity to contribute 4. Configuring Groups: Table participants are unassigned and diversely comprised of any interested in the topic 5. Time Allocation: Facilitators host the dialogue, encouraging open-ended contributions from all participants in five-minute rounds PROGRESS TO DATE: Instituted faculty driven task forces to address diversity, equity, career development, and mentoring, and launched a Women's World Café for staff. ROADBLOCKS & BARRIERS: A World Café is a foreign format to most and getting enough attendees proved difficult. Finding a convenient time that did not detract from work or family was also a challenge, but holding an evening event was success. VALUABLE LESSONS LEARNED: Addressing gender-related issues through a World Café can be a unifying experience through opening conversations, increasing awareness, and in bringing individuals of any gender together to identify productive solutions ProjectInsights WOMEN'S WORLD CAFÉ FOR STAFF University of Utah Health Department of Internal Medicine Over the last year, the Department of Internal Medicine chose to focus on gender related issues that directly impact resiliency and wellness of female faculty and trainees. Historically, the State of Utah has struggled to break boundaries and address inequity issues for women, earning a rather poor report card with an F in Work & Family, a D+ in Poverty & Opportunity, a B in Health & Well-Being, and a D in Employment & Earnings. Though one of the largest departments in the School of Medicine, women are the overwhelming minority, representing only 36% of faculty in the Department of Internal Medicine. To give these women a voice and safe space to come together, the Department of Internal Medicine chose to hold an event to address and learn about the issues and concerns that directly impact this minority group. 1 2 Themes focused on: • Workplace culture • Bias • Mentoring • Enhanced communication • Work-life balance • Leadership development • Career advancement In true "café" style, we hosted a dinner which encouraged socializing and networking prior to discussions. Chairs of other academic departments and senior women leaders from the School of Medicine participated as facilitators. Over 50 faculty and trainees attended. 1. Status of Women in the States: https://statusofwomendata.org/wp-content/themes/witsfull/factsheets/economics/factsheet-utah.pdf 2. Liberating Structures Conversation Cafe: http://www.liberatingstructures.com/17-conversation-cafe/ Because of the event's success, we extended this initiative to staff in the Department of Internal Medicine. Through the faculty event, we learned that certain issues are not gender exclusive and that men indicated a desire to know and understand issues their women colleagues face. Unlike the faculty event, invitations were sent to all staff, regardless of gender, to be more inclusive. The Women's World Café for Staff will be held December 14, 2018. We look forward to learning how we can further explore resiliency and wellness issues for the entire Department of Internal Medicine. Women's World Café - March 14, 2018 As a result, Department leadership launched multiple task forces to focus on mentoring, equity, diversity, and career development. Additionally, administrative initiative groups were formed to tackle process improvement issues, brought up in the discussions.
- 20. Team Building for Internal Medicine Interns: Part of a Comprehensive Wellness Program Amy N. Cowan, MD, MS Salt Lake City Veterans Administration Health Care System University of Utah Graduate Medical Education, Department of Internal Medicine Background Methods Objectives • Evaluate intern satisfaction through post-activity survey and narrative comments • Explore if these types of activities could lessen burnout • Use narrative comments to help guide future activities Design • 55 Interns were divided into groups of 10-12 • Created a curriculum to relate rock climbing to medicine – problem solving, emotion regulation, asking for help, communication both verbal and non-verbal Intervention • Small groups each met once for 2.5 hours over 5 wks • A climbing instructor taught the group belay skills • Interns paired up with different partners throughout the activity to practice as climber and belayer • Scheduled pauses throughout the activity for discussion, reflection, and stress relieving strategies Results Conclusions Looking Ahead • Change climbing activity from July to February to target time of year when interns are most at risk for depression and burnout • Focus activity to go beyond team building and provide an opportunity for debrief and to share support strategies • Include more Chief Medicine Residents, residents and committed faculty to participate Survey Results •Attending this activity was worth my time 96% •I want more types of these activities sponsored by the department 90% •These activities are an important part of decreasing burnout 85% •I would highly recommend this activity to others 90% Narrative Comments “How quickly we could trust each other.” “Surprised how others had similar feelings of being overwhelmed at work.” “How much I bonded in such a short time!” “I feel valued.” “Others are going through the same thing.” i • Interns and leadership see value in this activity • This program could serve as a springboard for connection leading to other wellness activities such as meals together, beer making, hiking, etc. • Over time this activity, embedded within a comprehensive wellness program, may be protective against workplace burnout Medical residency has high rates of burnout nationally. In October 2017 our program of 124 was surveyed by GME. A response rate of 42% evaluated the following: • Symptoms of depression – program 33% vs all programs in GME 35% • Burnout – program 60% vs 59% • Perceived appreciation from the program was slightly below the mean for all programs. Our wellness program includes a wellness lecture series, social and athletic activities, snack baskets for our inpatient teams and has named faculty and residents as wellness champions. People identified as peer or faculty support for residents in distress. Since many interns have left behind an established social support network we wanted to engage them with each other and expose them to something our community is famous for, rock climbing.
- 21. Restoring Balance Self-Care Retreats DEPARTMENT OF PSYCHIATRY Paul Thielking, MD University of Utah Introduction Burnout is a psychological syndrome that includes emotional exhaustion, depersonalization, and a reduced sense of personal accomplishment (1). Physicians, nurses, and other health care professionals are at high risk of burnout (2)(3). Interventions with most evidence supporting their use are mindfulness-based interventions. Mindfulness interventions have been shown to decrease burnout, increase empathy, decrease stress and anxiety, and increase a sense of meaning/engagement with work (4,5,6). One barrier for professionals that might be interested in mindfulness training is that mindfulness based interventions often involve at 8 week commitment, are time intensive. In effort to create innovative ways of promoting self- care and decreasing physician stress and burnout, we have developed a one-day "Restoring Balance" retreat. Starting in May, 2016 these retreats have been offered on a monthly basis. The HCH retreats have been attended by staff throughout the HCH institution, including: nurses; social workers; chaplains, advanced practice clinicians, clerical staff; housekeeping personnel; pharmacy staff; food service workers; and other HCH employees. Results A mixed model analysis found a significantly lower Emotional Exhaustion (EE) score at post-survey than at pre-survey (t = -2.30, p = .0257). At pre-survey, the mean EE subscale raw score for all participants is 23.24. At post-survey, the mean EE subscale score for all participants is 20.61 There were no significant differences in pre-survey and post-survey scores for the Depersonalization and Personal Accomplishment sub-scales. Methods Burnout was assessed using the Maslach Burnout Inventory (MBI). The MBI measures three dimensions of burnout: emotional exhaustion, depersonalization, and personal accomplishment. (1) From December, 2016 through November, 2017, a total of 49 retreat participants completed pre-retreat Maslach Burnout Inventory (MBI) questionnaires and post-retreat questionnaires 3 months following completion of the retreat. Discussion Caring professionals are at high risk of burnout. The oncology setting is particularly challenging for health care professionals. The Restoring Balance retreat offers a one-day intensive that helps participants gain insights into sources of burnout, and teaches tools that can be used to alleviate stress and allow for balance between caring for others and caring for the self. This one-day retreat was associated with improvements in emotional exhaustion that were present 3 months after the workshop. Future plans will be to do a more rigorous assessment of these workshops for nurses. The Restoring Balance retreats consist of several components including: Educational: Discussion of concepts including burnout, compassion fatigue, wellness, mindfulness, and stages of behavioral change. Mindfulness Training: Guided mindfulness exercises are taught at various times through the day, including sitting meditation, walking meditation, and restorative yoga. There is an emphasis on integrating brief mindfulness practices in the midst of work activities. Large group “Big Mind Process”: Facilitated exploration of some of the core issues that contribute to provider burnout, with a focus on internal resources and barriers to good self-care. Dyads: “Being Present” exercise with partner, Closing Process: Integration of retreat experiences and each participant developing a written self-care plan Available on request. References Burnout Pre-Retreat Post -Retreat change p-value Emotional Exhaustion 23.24 20.61 2.63- 0.0257 Depersonalization 6.39 5.17 1.22- 0.763 Personal Accomplishment 38.31 38.62 0.31+ n/a
- 22. 0% 25% 50% 75% 100% clinic lunch go relax respected pre project post project Look forward to clinic lunches Have somewhere to go to relax Feel respected & appreciated by management Staff survey questionnaireRESULTS NEXT STEPS INTRODUCTION We recognized a need to improve morale at our clinic. There were no healthy options for buying snacks or lunch and no place to decompress from clinic stress or connect with colleagues. Monthly clinic meeting lunches and recognition rewards were nutritionally poor and felt disrespectful. This environment has led to staff not feeling valued, respected, or connected. This was identified as a prominent issue on a pre project survey and has resulted in high staff turnover. Problem Investigation Gemba Walk: showed inadequate, uncomfortable, break room space with noise from GI suction closet and view of loading dock; Staff eating separately in make-shift places -- at desk, in conference room, in break room; Monthly lunch uninspiring, processed, high-fat, nutritionally-poor food. Voice Of Customer: Staff do not look forward to monthly lunches and they do not have a place to go to decompress and relax. Survey Results: On our survey of Redstone staff the majority agreed that our coworkers are our best asset. They also agreed that their main concerns are the negativity of the staff and the lack of a supportive and respectful work environment. • 83% feel connected to colleagues • 79% of staff don’t look forward to clinic lunches • 78% don’t have somewhere to decompress & relax at work • 26% of staff have symptoms of burnout. PROGRESS ▪ Ongoing LIMITATIONS & BARRIERS ▪ Initial push-back from administration ▪ Delays in delivery of ordered products ▪ Delays in completion of work orders ▪ Difficulty coordinating efforts between off-site departments VALUABLE LESSONS LEARNED ▪ Even with only partial project implementation, we saw surprising improvements in staff attitudes toward project goals. ▪ Staff burnout is multifactorial and continued attention to wellness is needed to have a real PROJECT INSIGHTS METHODS FOR IMPROVEMENT We formed a Wellness Team with the goal of improving the morale at our clinic. Our project focused on nourishing our bodies and minds. We are creating a rejuvenating space for employees and staff and we worked with administration and registered dieticians to develop healthier options for snacks and meals. Highlighted below are a few key initiatives: Project 1: Breakroom Space Project 2: Registered Dietitian Approved Project 3: Wellness Team Suggestion Box Working with the RD Approved team, we were able to find healthier catering options within budget for our monthly meetings. Also, we have purchased a small fridge to store healthy snacks and drinks for staff to purchase in the breakroom. Profits from snack sales will go towards future wellness initiatives. NOURISHING OUR BODIES & MINDS Department of Family & Preventive Medicine – Redstone Clinic Sandra Van Leuven, MD, PhD; Alessandra Zimmerman, PA-C; Mary Anderson, RN, BSN; Kristyne Showell, MA, EMT The loading dock and breakroom were minimally furnished, uninviting spaces for staff to relax. With the support of a wellness grant, we are creating a welcoming, rejuvenating environment where staff can connect. A wellness suggestion box has been created to generate future initiatives and is posted prominently by the time clock. • Implement the sale of healthy snacks and drinks in break room by early 2019 • Complete loading dock remodel and break room improvements by May 2019 • November 2018 survey results showed 23.5% of staff have ANY symptoms of burnout vs. 14.4% in May.
- 23. IMPROVING CRITICAL TEST RESULT MANAGEMENT IN RADIOLOGY Megan K. Mills, Tony Jones, Richard Wiggins III, Taylor Conkey, Edward Quigley, Luca Boi and Satoshi Minoshima Department of Radiology and Imaging Sciences, University of Utah SUMMARY One of the Joint Commission National Patient Safety Goals is to “report critical results of tests and diagnostic procedures on a timely basis”. Critical test result management (CTRM) can be a frustrating task for radiologists and support staff. This workflow process is wrought with frequent interruption and can require significant effort during an already busy, high volume radiology practice. These stresses have a negative impact on wellness in the work place. The current CTRM process has numerous potential targets for intervention and process improvement. PLAN We utilized a ‘go and see’ method of analysis to identify specific areas for improvement in our critical test result management (CTRM) workflow. The current state is outlined by the flow chart in the central panel. During clinical hours, radiologists make use of a reading room assistant (RRA) to perform steps of the workflow, while afterhours these steps are performed by the interpreting radiologist. We identified a bottleneck during a portion of the workflow where the radiologist waits for a callback from the responsible care provider (RCP). A call back from the RCP took, on average, 7 minutes. We decided to target this specific step for intervention. Existing IT vendor products have been specifically designed to improve the communication of critical results. According to a report by AuntMinnie.com, despite the availability of these products, fewer than 400 hospitals have implemented a CTRM product. A solution assessment was undertaken for two available CTRM products, an Epic-based communication tool, as well as an external CTRM product. The Epic solution addressed all of the functional requirements of CTRM, including the ability to establish direct communication, a ‘hands- off’ solution for the radiologist, direct communication with an RCP, and automated documentation that can be audited. While the external CTRM product provided many of these same abilities, barriers were identified. These barriers included cost, introduction of a new site-wide IT product, and the absence of two-way communication. We hypothesize that information technology solutions can be used to improve the efficiency of critical radiology results communication. Implementation of an electronic critical test result management tool can improve the radiologic workflow, decrease stressors in the workplace, and improve wellness. The Epic CTRM tool is an existing feature that is available, but not currently used at the University of Utah. The Epic CTRM tool alerts an RCP via the Epic Inbasket and provides the ability for progressive alerts and flags within the electronic medical record. Because this system is integrated with the electronic medical record, it is auditable and reportable through Epic Workbench. In addition to the initial communication, the Epic CTRM also has the ability to alert the RCP when a follow-up study is due or provide a means to enter a future order. DO The next step in our process cycle to is implement this initiative on a small scale. Participation of a few radiologists and targeted clinicians will allow repeat data collection on a small scale and further study of our process change. STUDY We will gather data from our pilot and measure the efficiency of CTRM delivery to evaluate the impact of the change. We expect to see time savings after the implementation of this tool. Compliance to JCAHO National Patient Safety Goals and incidence of critical result reporting is currently measured by our department for a number of specific critical results (ie. pulmonary embolism, acute intracranial hemorrhage). Current compliance data could be compared against reports utilizing CTRM software. ACT If our analysis demonstrates improved efficiency, we can turn to system-wide implementation. CTRM products have a varied history of success at other institutions. A consistent barrier is the culture change required for successful implementation. We continue to seek ways to combat potential barriers, including involvement of hospital administration senior staff early in the implementation process. The current process will continue to be refined, with the ultimate goal of system-wide adoption and potential expansion into other areas requiring critical communication. 1. https://www.jointcommission.org/standards_information/npsgs.aspx 2. Critical Results Reporting Software Is Promising, Challenging https://www.auntminnie.com/index.aspx?sec=ser&sub=def&pag=dis&ItemID=8 2463 3. SelectNuance Announces Veriphy 4.0, Critical Test Result Management For Radiology, Pathology, Cardiology and Clinical Laboratories https://www.businesswire.com/news/home/20091130005270/en/Nuance- Announces-Veriphy-4.0-Critical-Test-Result There is an opportunity to enhance wellness in the radiology department by improving critical results reporting at the University of Utah. The Epic critical results management tool provides a way to increase efficiency in the radiology workflow and, potentially, other departments who manage critical results. MOTIVATION METHODS CONCLUSION METHODS CONT. REFERENCES