1. Introduction
Literature Review
Results
Discussion
The Town of Prosper is a wealthy suburban town located in Collin and Denton counties
within the state of Texas, United States. Within the last few years, many businesses, neighborhoods,
and houses and have been built to accommodate the rush of people entering the town. Due to this
increase in volume, the amount of town employees have increased from around 80 employees to
140 in only 3 years and only seems to be growing. Due to the fact that many businesses are new,
there are a small number of fitness facilities while many of the restaurants are fast and don’t offer a
variety of healthy options.
The Towns Wellness Program for the Prosper employees is very limited and not well
established. There is a Benefits and Wellness Committee that was established earlier this year and
consists of 8 of the Town’s directors and staff. This committee rarely meets and never evaluates the
progression of health within the town staff. However, they are in charge of creating activities and the
benefits within the wellness program.
The purpose of this project was to increase the overall wellness program for the town
employees. In order to accomplish this, more activities must be offered at multiple times to create a
more versatile program. These activities produced an incentive by giving out wellness points to lower
each employees health care premium for the year while being entered for a drawing for raffle prizes
provided by human resources. An objective for the purpose includes increasing participation within
scheduled monthly activities by 25%. This will, in turn, decreasing sedentary time throughout the day
by 25% as well. In a way to promote physical activity and scheduled events, online informational
flyers will be sent out weekly.
The hypothesis, when compared to the literature, isthat if weekly informational flyers will be
sent out and more activities are offered, sedentary time will be reduced while the participation within
activities will increase among the town employees.
The driving force of the project was the Theory of Reasoned Action and Planned Behavior
along with the International Physical Activity Questionnaire (IPAQ). A questionnaire was designed
to provide information directly for the theory and was combined with the IPAQ to create one
questionnaire consisting of 20 parts, which was titled the Belief of Physical Exercise
Questionnaire. Icek Ajzen created the Theory of Reasoned Action and Planned Behavior in 1991,
and 15 years later, created a template for a questionnaire in 2006. This was a major reference
regarding the creation of the the Belief of Physical Exercise Questionnaire. Others researched this
theory as a model for understanding sedentary behavior and determined that the “subjective
norms appear to be a strong predictor of sedentary intentions whereas sedentary intentions
appear to be a strong predictor of sedentary time. Attitudes consistently affected sedentary time
through intention” (Prapavessis, 2015).
Kozey-Keadle, et. al., tested the reliability and validity of a 7-day sedentary time
questionnaire, which concluded that it generally overestimated sedentary time, but appeared to be
a useful tool for ranking individuals in a large scale observation (2014). The Theory of Planned
Behavior questionnaire was also assessed for bias and concluded a low risk of bias in the overall
quality (Oluka, 2014). The online intervention based on informational flyers was studied to reduce
sedentary behavior time among adults, which was monitored by the 7-day SLIPA Log, (Barwais,
2015), and concluded that “a significant decrease of 33% was found between the time spend in
sedentary activities measures at baseline and at the end of the 4-week intervention.”
In an effort to elucidate the factors associated with sedentary lifestyle within the employees of
the Town of Prosper, Texas, a needs assessment was performed within a controlled group of people
that represented the target population. The needs assessment was then used as the driving force for
the intervention involving online educational flyers and was used to help determine the evaluation
method of using the International Physical Activity Questionnaire – 7-day short version. The
hypothesis was that the participation rates within the wellness program would increase while the
sedentary time would decrease.
The main finding was that the intervention involving online educational flyers, which were
geared towards the needs of the target population, were proven to slightly increase awareness of
physical activity as determined by the IPAQ – 7-day. Much feedback was given by word of mouth of
the employees claiming that the online flyers increased awareness, which was possible due to the
small size of the target population. The participation rates for the wellness program events increased
by 23%, slightly below the hypothesis, while sedentary time decreased by 30%, slightly above the
hypothesis. This follows the results of the literature reviewed by Barwais (2015) and Kozey-Keadle
(2014).
A recommendation to improve the quality of the results would be to make questionnaires
such as the IPAQ and the Belief of Exercise Questionnaire mandatory for all employees. This would
increase participation rates which, in turn, would increase awareness throughout the target population.
Another recommendation would be to retest the question “define your current state of physical
exercise” in order to validate the success of the intervention. The final recommendation would be to
change the implementation of the questionnaires to be received during a less stressful time and,
therefore, more accurate results would be produced. Each participant would know the intents of using
the information of the questionnaires and, therefore, would produce more accurate results for each
participant. When looking at individual results, it seemed as if little thought went into completing the
questionnaires.
In summary, the present study concluded that a 7-day sedentary time questionnaire, along
with online educational flyers, were proven to be slightly effective with increasing awareness of
physical activity and wellness. However, the results were scarce due to the fact that the sample size
was small and, therefore, the results must be evaluated with that in consideration. While the
hypothesis was shown to be correct, a larger sample size would be more accurate.
Wellness Matters: A Needs Assessment for Town Employees of Prosper, TX
Tanner Lee
Department of Health and Human Performance
Texas State University
Methods
The target population for the research is the employees for the Town of
Prosper, TX, however the instrumentation will only use a portion of the entire
population. These participants were a sample group of 59 active employees who
accurately reflected the target population.
The research is derived from the Theory of Reasoned Action and Planned
Behavior (Ajzen, 1991) which will link beliefs and behavior from the target population.
This theory used behavioral evidence to drive the objective of observing progress and
reduction of sedentary time within the target population.
The instrumentation used to gather data was surveys and questionnaires.
The first instrument was a survey which evaluated the needs of the population by
asking a series of 13 questions. The priority issues was determined by allowing
participants to choose from a list of wellness topics and choosing: Low to High on a
scale of 1-5. The topics which had the most “high” interest levels were then chosen to
be included in the intervention. This was the driving force for the information used in
the weekly educational flyers. The second instrument was a questionnaire used to
directly to find information for the Theory of Reasoned Action and Planned Behavior
(Ajzen, 2006). This provided information such as behavioral beliefs, outcome
evaluation, and the subjective norm which are all utilized and evaluated. The final
instrument was another questionnaire to determine the short term evaluation of
physical activity within the past seven days (Craig, 2015).
The needs assessment was distributed through a paper format at an
employee lunch and learn towards the beginning of the semester consisting of 59
employees. The 13 question survey was taken at the time of the lunch and learn and
given back immediately. These answers were evaluated and discussed by the
Benefits and Wellness Committee.
The second and third instrument were combined into one questionnaire
which provided information about the theory and the past seven days of exercise.
This was given to the same group of people. The third instrument was then given by
itself to evaluate the success of the weekly flyers and to see any change in sedentary
time throughout the week. A sample size was gathered and the International Physical
Activity Questionnaire (IPAQ) was distributed to observe progress and improvement
within physical activity. This questionnaire was distributed twice and the data was
compared to show physical activity levels on a short term scale. The final instrument
used consisted of the participation log of employees for each activity provided.
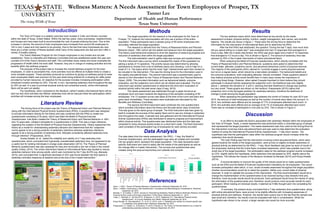
The key wellness topics which were determined as top priority by the needs
assessment included: physical activity, nutrition, weight management, skin cancer, and work/life
balance. The results are shown in figure 1. These were the driving force to determine the
information for the intervention of informational flyers and to determine the IPAQ.
After the first IPAQ was distributed, the question “During the last 7 days, how much time
did you spend sitting on a week day?” was evaluated and had 12 responses that averaged to 6
hours a day. After the 4-week intervention, the IPAQ was given again and a total of 10 responses
that averaged to 4.2 hours a day. This is shown in figure 2. The amount of sedentary time was
reduced by 30% in the 4-week intervention of online educational flyers.
When analyzing the Belief of Exercise Questionnaire, which directly correlated with the
Theory of Reasoned Action and Planned Behavior, questions were asked to determine their
current state, attitudes, subjective norms, and percieved behavioral control of physical exercise.
The majority of the participants (45%) claimed to “currently engage in some physical exercise
but not on a regular basis, which should be a test-retest correlation. The behavioral beliefs and
the outcome evaluations, both evaluating attitudes, directly correlated. These questions asked if
they believe physical activity would benefit them in many ways verses the importance of
improving those things. However, when asked if people important to them believe they should
participate in physical activity assessing the subjective norm, the likelihood was only slightly
above 1, between the domains of -3 and 3, claiming that their likelihood to change was positive
but very small. These graphs are shown on the handout. Prapavessis (2015) claims that
subjective norm is the strongest predictor for sedentary behavior, therefore the likelihood of
change is small among the target population.
When assessing the participation logs between the month of October for year 2014 and
2015, the amount of total employees as well as the number of events were taken into account. In
2014, four activities were offered and an average of 17% of employees attended each event. In
2015, five activities were offered and an average of 22.1% of employees attended each event.
There was an increase of participants in one year by 23%. This is shown in Figure 3.
References
Ajzen, I. (1991). Theory of Planned Behaviour Questionnaire. Retrieved September 28, 2015
Ajzen, I. (2006). Constructing a TpB Questionnaire: Conceptual and Methodological Considerations. Retrieved
September 28, 2015
Barwais, F., & Cuddihy, T. (2015, January 5). Empowering Sedentary Adults to Reduce Sedentary Behavior and Increase
Physical Activity Levels and Energy Expenditure: A Pilot Study. Retrieved September 21, 2015.
Craig, C., Marshall, A., Sjo Stro M, M., & Bauman, A. (2015, September 27). International Physical Activity
Questionnaire: 12-Country Reliability and Validity. Retrieved September 28, 2015
Kozey-Keadle, W., Bourdeaudhuij I, D., & JG, G. (2014, June 1). Reliability and validity of a domain-specific last
7-d sedentary time questionnaire. Retrieved September 23, 2015
Prapavessis, H., Gaston, A., & DeJesus, S. (2015, February 3). The Theory of Planned Behavior as a model for
understanding sedentary behavior. Retrieved September 28, 2015
Data Analysis
The data taken from the needs assessment, the IPAQ – 7-day, the Belief of
Exercise Questionnaire, and the participation logs were all created and compiled
into bar graphs which represent the target population. This data represents each
specific instrument and used to easily see the needs of the participants as well as
the change after a 4-week intervention. The surveys and questionnaire were
created using the www.surveymonkey.com website and compile.
Figure 1
17%
22.1%
0%
5%
10%
15%
20%
25%
2014 (135
employees)
2015 (141
employees)
Percent Attended
Figure 2 Figure 3
0
5
10
15
20
25
30
35
40
Allergies
Asthmas
BackInjuryPrevention
BoneHealth
CholesterolManagement
Cold/FluPrevention
EmotionalHealth
VisionHealth
HighBloodPressure
Men'sHealth
Nutrition*
PhysicalActivity*
SkinCancer*
SmokingCessation
StressManagement
Walking
WeightManagement*
Women'sHealth
Work/LifeBalance*
Low
Medium Low
Medium
Medium High
High
6
4.2
0
1
2
3
4
5
6
7
Log 1 Log 2 - After
Intervention
Average Sedentary Time (in hours)