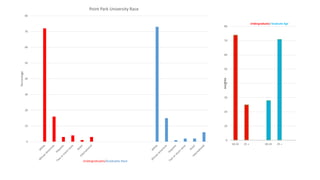
PPU Undergraduate/graduate Race Breakdown.
City of Pittsburgh Breakdown. Added CMU and PPU total population
I chose CMU and their demographic profile is surprisingly different from Point Park’s and I say surprisingly because I thought PPU was diverse. CMU has a significantly larger Asian and International student percentage than PPU.
Student/Faculty
The PPU demographics are close to the U.S. demographics with the White and Black percentages but the others vary greatly. The Hispanics are not well represented at the school in reflection to the population of the US overall.
Beginners Guide to TikTok for Search - Rachel Pearson - We are Tilt __ Bright...
311 assignment one
1. 0
10
20
30
40
50
60
70
80
Percentage
Undergraduates/Graduates Race
Point Park University Race
0
10
20
30
40
50
60
70
80
18-24
25 +
18-24
25 +
Axis Title
Undergraduate/ Graduate Age
2. Population of Pittsburgh Students and Residents
Carnegie Mellon Students
Point Park Students
Residents of Pittsburgh
66.00%
26.10%
0.20%
4.40%
0
2.50%
2.30%
64.80%
81.90%
10.80%
0.20%
2.70%
0.00%
1.90%
5.70%
79.50%
0.00%
10.00%
20.00%
30.00%
40.00%
50.00%
60.00%
70.00%
80.00%
90.00%
White
Black or African American
American Indian and Alaska Native
Asian alone
Native Hawaiian and Other Pacific Islander alone
Two or More Races
Hispanic or Latino
White alone, not Hispanic
Pittsburgh Race 2010
Series2
Series1
3. 48.3
6.3
8.4
4.3
27
17.9
6.7
0
10
20
30
40
50
60
White
AfricanAmerican
Hispanic
Two or moreraces
Asian
International
Other
Carnegie Melon University Race
8188
2707
CMU Age
18-24
25 +
4. 77.7
13.2
17.1
2.4
5.3
1.4
U.S. Race 2013
White
African American
Hispanic
Two or more races
Asian
Other
72
16
3
4
1
3
PPU Undergraduates
White
African American
Hispanic
Two or more races
Asian
International
73
15
1
2
2
6
PPU Graduates
White
African American
Hispanic
Two or more races
Asian
International