


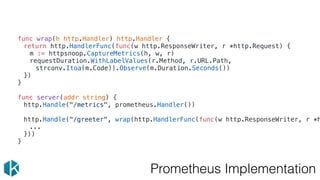
![Prometheus Implementation
import (
“github.com/prometheus/client_golang/prometheus"
)
var requestDuration = prometheus.NewHistogramVec(prometheus.HistogramOpts{
Name: "request_duration_seconds",
Help: "Time (in seconds) spent serving HTTP requests.",
Buckets: prometheus.DefBuckets,
}, []string{"method", "route", "status_code"})
func init() {
prometheus.MustRegister(requestDuration)
}](https://image.slidesharecdn.com/theredmethod-171117125403/85/The-RED-Method-How-To-Instrument-Your-Services-9-320.jpg)
![Easy to query
Rate:
sum(rate(request_duration_seconds_count{job=“…”}[1m]))
Errors:
sum(rate(request_duration_seconds_count{job=“…”,
status_code!~”2..”}[1m]))
Duration:
histogram_quantile(0.99,
sum(rate(request_duration_seconds_bucket{job=“…}[1m])) by (le))](https://image.slidesharecdn.com/theredmethod-171117125403/85/The-RED-Method-How-To-Instrument-Your-Services-11-320.jpg)

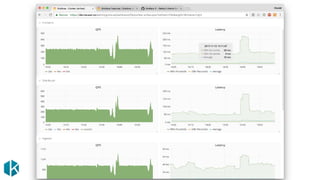
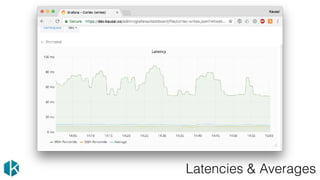
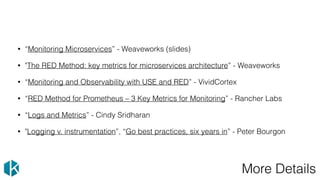
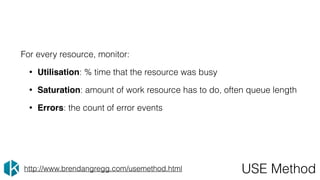
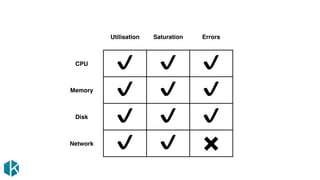


The document presents the RED method for monitoring microservices, focusing on three key metrics: request rate, errors, and duration, implemented using Prometheus. Additionally, it discusses the USE method which tracks resource utilization, saturation, and errors, alongside the four golden signals for service monitoring. Various resources and methodologies for deeper understanding and practical application of these monitoring techniques are also referenced.