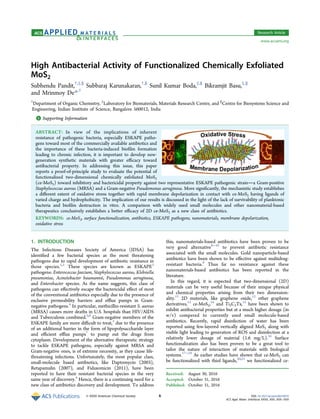
2. MoS2 with different thiol ligands to impart different charge and
hydrophobicity to the material surface. In particular, we tested
its antibacterial and antibiofilm efficacy against representative
Gram-positive and Gram-negative ESKAPE pathogens MRSA
and P. aeruginosa, respectively. To the best of our knowledge,
we achieved the lowest reported antibacterial dosage (in w/v)
of a ce-MoS2-based drug with optimized functionalization
against both Gram-positive and Gram-negative bacteria
compared to all other 2D materials, nanoparticles, and small
molecules reported earlier.
2. EXPERIMENTAL SECTION
2.1. Exfolaition and Functionalization of MoS2. Bulk MoS2 was
exfoliated following the reported procedure with few modifications.22
In short, 300 mg of bulk MoS2 was taken in a glass vial placed inside
the glovebox under nitrogen atmosphere. Then 3 mL of 1.6 M n-
butyllithium solution in hexane was added and stirred for 48 h. The
lithium-intercalated MoS2 was filtered (Whatman 1) followed by
washing with hexane to remove excess of n-butyllithium, and then the
setup was taken out of the glovebox. The lithium-intercalated MoS2
powder was then added to ice-cold distilled water and sonicated for 30
min. For purification, the obtained solution was centrifuged at 10 000
rpm three times, and the precipitate was collected to remove all salt
and small molecules. Again, the precipitate was redispersed in water
and centrifuged at 3000 rpm two times, and the supernatant solution
was collected to remove “not so well exfoliated MoS2”. The obtained
solution was used for further functionalization by following the
reported method.20
First, 15 mg of ligand was dissolved in 8 mL of
water. To that ligand solution 2 mL of ce-MoS2 (2 mg/mL) was
added, sonicated for 20 min, and then stirred for 1 day at 4 °C. The
functionalized solution was dialyzed for 1 day using a snake-skin
dialysis membrane of 10 000 MW cut off (Thermo scientific) to
remove excess of ligands. Only for the neutral ligand, the ligand was
dissolved in 8 mL of a 1:1 mixture of EtOH and water instead of only
water. The synthetic scheme of the ligands used to functionalize ce-
MoS2 along with the NMR spectra of the final ligands has been
included in the Supporting Information (Figures S2−S7).
2.2. Determination of Minimum Inhibitory Concentration.
For evaluation of the antimicrobial efficacy of the functionalized MoS2,
methicillin-resistant S. aureus (MRSA, USA300) and P. aeruginosa were
chosen as “ESKAPE” representative microbes for the study and we
followed reported methods to determine minimum inhibitory
concentration (MIC).23
The freeze-dried stocks of the above bacterial
species were revived on nutrient agar plates. Single colonies/few
colonies of the bacteria were cultured overnight for 10−12 h in 5 mL
of Luria broth (LB, HiMedia, 20 g/L) media, and the 50 μL of primary
culture was subcultured in 4 mL of fresh LB until it reaches the mid
log phase (A600 ≈ 0.3). The optical density of the seeding bacteria was
adjusted to A600 = 0.01 (106
−107
bacteria per mL) and used for the
experiments. The minimum inhibitory concentrations (MIC) of
functionalized MoS2 were determined by the microbroth dilution
method in 96-well plates. The materials were diluted to prepare 30 or
5 ppm of fresh stock solutions. The working solution concentrations
were prepared by 2-fold serial dilution with phosphate saline buffer
(PBS). A 100 μL amount of the above working solutions was added to
100 μL of bacterial suspension with A600 = 0.01. With the help of a
microplate reader (Eppendorf AF2200) equipped with a shaker and
thermostat set to 37 °C, the bacterial growth curves were monitored
over a period of 16 h in a real time kinetic cycle with A600 taken at 10
or 15 min intervals followed by orbital shaking at 100 rpm. The
minimum concentration at which there was no rise in the growth
curves was designated as MIC.
To determine minimum bactericidal concentration (MBC), after 16
h reading, the 96-well plate was further incubated at 37 °C for 4 h, and
then the bacterial solutions from the treated wells were taken and
streaked on a nutrient agar plate. The minimum concentration at
which no bacterial growth was observed has been designated as MBC.
2.3. Quantification of Oxidative Stress. Ellman’s assay was
employed to quantify free thiol as described in the literature.15
In
short, 0.4 mM GSH (final concentration) was dissolved in 50 mM
bicarbonate buffer with pH 8.6, and then 10 × MIC against MRSA
(final concentration) for positive C1, C6, and C8 MoS2 was added;
18.8 ppm of ce-MoS2 (which is same concentration as 10 × MIC for
positive C1 MoS2) was also added to one tube just to compare its
oxidative stress with that of same dosage of positive C1 MoS2. In
negative control, no MoS2 was added, and in positive control 1 mM
H2O2 was added. The tubes were wrapped with aluminum foil to
prevent any photochemical oxidation. The solutions were incubated at
37 °C for 15 min, 30 min, 45 min, 1 h, 2 h, and 3 h. A 100 μL amount
of the reaction mixture at each time point was taken out and
centrifuged at 15 000 rpm for 5 min to get rid of any interference in
absorbance due to the presence of MoS2 in a later stage of the
experiment. A 90 μL amount of supernatant was mixed with 157 μL of
50 mM TRIS-HCl (pH 8.3, SRL Chem) and 3 μL of 100 mM 5,5′-
dithio-bis(2-nitrobenzoic acid) (DTNB, SRL Chem). Then the
absorbance of the resulting solution was measured at 412 nm using
a UV−vis spectrometer (Eppendorf BioSpectrometer, USA). The
percentage loss of glutathione was calculated as
− ×
⎛
⎝
⎜
⎞
⎠
⎟1
A of the sample at particular time
A of the negative control at 0 min
100%412
412
2.4. Qunatification of Membrane Depolarization. The
membrane depolarization of the bacteria by these MoS2 materials
has been quantified following the reported method.24
The mid-log
phase culture (A600 ≈ 0.3) of MRSA was harvested by centrifugation at
3500 rpm for 5 min. The cell pellet was washed with 5 mM glucose
and 5 mM HEPES buffer (pH 7.2) mixed in a 1:1 ratio, and the
washed cell pellet was resuspended in 5 mM HEPES buffer, 5 mM
glucose, and 100 mM KCl solution mixed in a 1:1:1 ratio. Then 50 μM
DiSC3 dye (3,3′-dipropylthiadicarbocyanine iodide, TCI Chemicals)
was added to the 96-well plate with bacterial suspension, and the plate
was incubated for 20 min. Positive C1, C6, and C8 MoS2 was added to
the wells containing a bacterial suspension and DiSC3 dye, so that the
final concentration of those MoS2-based materials become 10 × MIC
against MRSA (for ce-MoS2 18.8 ppm was used). After addition of the
dye, the fluorescence was monitored with an excitation wavelength of
622 nm and an emission wavelength of 670 nm for the next 110 min.
An increase in fluorescence indicates membrane depolarization of the
bacterial membrane. An increase in fluorescence at a certain time
compared to 0 min has been taken and plotted.
2.5. Cellular Toxicity Study. For the determination of cellular
toxicity of the MoS2-based antimicrobials, we used HeLa cell line
procured from Molecular Biophysics Unit, Indian Institute of Science,
Bangalore, India. The cryo-preserved stocks of the cells were revived
and grown in the complete media comprising of DMEM (Dulbecco’s
Modified Eagle’s Medium, Invitrogen), 20% FBS (Fetal Bovine Serum,
Invitrogen), 1% antibiotic antimycotic solution (Sigma), and 2 mM of
L-glutamine (Invitrogen). Subsequently, the cells were cultured in a
CO2 incubator (Sanyo, MCO-18AC, USA) at 37 °C, 95% humidity,
and 5% CO2. When the cells reach 70−80% confluency, they were
detached using 0.05% Trypsin−EDTA (Invitrogen) and centrifuged at
425×g for 5 min. These cells were further subcultured and used for the
study as required. Cytotoxicity of the functionalized ce-MoS2 was
assayed against HeLa cells by a 96-well microtiter-based MTT assay.
Around 10 000 cells/well were seeded and incubated in complete
media for 24 h. Then the adhered cells were treated for 24 and 72 h
with desired concentration of functionalized ce-MoS2. After treatment
the media was carefully aspirated, and the cells were washed with PBS
(pH = 7.4). Subsequently, fresh media containing 15% MTT (5 mg/
mL, Sigma) was added and incubated for 4 h. After incubation, the
media was aspirated and the formazan crystals were solubilized in
DMSO (Sigma). The OD of the solubilized solution was measured at
595 nm using the plate reader (Varioskan Flash Multimode Reader,
Thermo Scientific).
2.6. Statistical Analysis. All graphs in Figures 2, 4, and 5 have
been plotted as mean value with standard deviation (SD) as an error
ACS Applied Materials & Interfaces Research Article
DOI: 10.1021/acsami.6b10916
ACS Appl. Mater. Interfaces XXXX, XXX, XXX−XXX
B
3. bar using GraphPad Prism 6. The statistical analysis of the data
provided has been carried out using GraphPad Prism 6. The
experiments have been carried out in triplicate. For Figures 2, 4, and
5, a one-way ANNOVA test followed by Turkey test has been
employed to determine significance of data. Figure 6 has been plotted
with a box plot of the range with a line at median. For Figure 6, the
Kruskal−Wallis test was employed to determine the overall
significance of medians of the data sets because the dosage data sets
are mostly skewed with outliers perturbing the mean and SD of the
data sets heavily. p values have been calculated to show the level of
significance where the p value denotes the chance of having no
significance between the means of sets of values.
3. RESULTS AND DISCUSSION
3.1. Functionalization of ce-MoS2. Bulk MoS2 was
exfoliated by the lithium intercalation method22
and then
functionalized with different thiol ligands with variable charge
and hydrophobicity.20
The formation of single layers of ce-
MoS2 was confirmed by AFM and SEM imaging with a height
profile of 1−1.2 nm (Supporting Information, Figure S1). In
the present case, the ligands we used, have a thiol group at the
end to anchor the ce-MoS2 sheets, followed by an alkane chain
for the stability, tetraethylene glycol (TEG) for biocompati-
bility, and finally the head group to impart different charge and
hydrophobicity. Neutral ligand has a hydroxyl group as the
headgroup, while negative ligand has a carboxyl, and positive
ligands have a quaternary ammonium group with different
chain length (Figure 1a). After functionalization, the materials
show higher stability in aquous media and varied surface
potentials from that of ce-MoS2. We measured the ζ potential
of the functionalized materials to confirm the surface
modification (Figure 1b). For positively charged MoS2, the
hydrophobicity of the ligand was altered by varying the alkane
chain length with methyl (C1 MoS2), hexyl (C6 MoS2), and
octayl (C8 MoS2) groups at the quaternary ammonium center
(Figure 1c). According to previous reports,25,26
hydrophobicity
of the alkane chains has been quantified using the log of the air/
water partition coefficient. C8 ligand is the most hydrophobic
followed by C6 and C1. But, we also quantified the
macroscopic hydrophobicity of the surfaces according to the
previous report on wettability of the MoS2 films.27
However,
before and after functionalization we did not notice any
significant difference of water contact angle with varied
functionalization of the material (Supporting Information,
Figure S26). This is because the functionalization of the
material happens mainly at edges and defect sites and also
preserves the overall high positive charge and hence high
hydrophilicity.
3.2. Activity against Planktonic Bacteria. These
functionalized ce-MoS2 were evaluated for minimum inhibitory
concentration (MIC) and minimum bactericidal concentration
(MBC) against MRSA and P. aeruginosa. The MIC and MBC
values are summarized in Table 1. The detailed growth curve
and the MBC plate images are included in the Supporting
Information (Figures S8−S24). From Table 1, we can observe
that ce-MoS2, neutral MoS2, and negative MoS2 do not exhibit
any growth inhibitory effect against any of the investigated
bacterial species up to 15 ppm concentration. In contrast,
positively charged C1 MoS2 shows antibacterial activity against
only Gram-positive bacteria at 1.88 ppm as MIC and 3.75 ppm
as MBC, but Gram-negative bacteria remain unaffected by this
C1 MoS2. Positively charged C6 MoS2 and C8 MoS2 were
effective against both MRSA and P. aeruginosa at very low
concentrations, 156 (MIC and MBC) and 78 ppb (MIC and
MBC) respectively. This can be rationalized by the fact that
bacterial surfaces possess a net negative charge28
due to the
presence of strongly negatively charged components like
teichoic acid, and therefore, ce-MoS2 with positive charges
are most effective in inducing the bactericidal effect.
3.3. Mechanism of Action. ce-MoS2 is known to generate
abiotic ROS-independent oxidative stress.14
Hence, we
employed glutathione oxidation assay to quantify abiotic
oxidative stress generation of the functionalized ce-MoS2 at
10 × MIC concentrations (against MRSA) and 18.8 ppm
concentration ce-MoS2, which is the same as a 10 × MIC
concentration of C1 MoS2. From Figure 2a, it can be seen that
functionalized materials generate lesser oxidative stress than ce-
MoS2. According to the statistical analysis, up to 120 min, C1,
C6, and C8 MoS2 have significantly lower oxidative stress than
ce-MoS2 with p < 0.0001. At 180 min, C6 shows lower
oxidative stress to ce-MoS2 with p < 0.05 and C8 shows the
same with p < 0.0001, while C1 does not have any statistically
significantly difference with ce-MoS2. Surprisingly, C8 MoS2
does not show any oxidative stress initially up to 60 min, and it
is has no significant statistical difference to negative control as
can be seen for statistical analysis of the graph. Over the time
span of 2−3 h, it shows a significantly lower amount of
oxidative stress compared to ce-MoS2. To find the origin of the
antibacterial activity of the functionalized ce-MoS2, we also
quantified the membrane depolarization by using DISC3(5)
fluorescent probe.29
Bacterial cells take up DISC3(5) dye
according to its cell membrane potential, and the dye gets
concentrated in the cell membrane. The fluorescence of the dye
Figure 1. Structure and surface properties of functionalized ce-MoS2.
(a) Schematic representation of functionalized ce-MoS2 with thiol
ligands of varied charge and hydrophobicity. (b) Zeta potential of the
functionalized ce-MoS2. (c) Hydrophobicity of the positive ligands
with different chain length at quaternary ammonium center.
ACS Applied Materials & Interfaces Research Article
DOI: 10.1021/acsami.6b10916
ACS Appl. Mater. Interfaces XXXX, XXX, XXX−XXX
C
4. gets self-quenched in this process. It is known that external
membrane depolarizing/hyperpolarizing agents change the
membrane potential and lead to release of the dye and an
increase in fluorescence intensity.30
From Figure 2b, it can be
seen that C8 MoS2 caused rapid depolarization of the bacterial
membrane, followed by C6 MoS2, while C1 MoS2 and ce-MoS2
do not show any significant signal at 10 × MIC and 18.8 ppm
concentration, respectively.
Although ce-MoS2 is more potent in generating oxidative
stress than functionalized materials, it does not show
antibacterial activity up to 15 ppm of concentration. This can
be explained as oxidative stress generated by ce-MoS2 is ROS-
independent type.14
Further, it acts through contact between
bacteria with the 2D ce-MoS2 sheet, which is really weak for ce-
MoS2. Also, ce-MoS2 surface is negatively charged and that is
expected to repel bacterial surface. Positive functionalization
has been effective in better attachment of the bacterial surface
to MoS2 nanosheet, thereby amplifying the effect of oxidative
stress on the bacteria. Subsequently, when we introduce a
longer alkane chain with the positively functionalized ce-MoS2,
another parallel mechanism of membrane depolarization comes
into the picture due to excellent hydrophobic interaction of
long alkane chains with the cell membrane of bacteria. Due to
the rapid depolarization of the bacterial membrane, the MIC
value decreases rapidly for C6 MoS2 and C8 MoS2 and starts
affecting Gram-negative bacteria also due to excellent hydro-
phobic interaction of the alkane chains with the outer cell
membrane of Gram-negative bacterial species. A switchover in
the mechanism can be observed while going form C1, C6, and
C8 MoS2. In particular, C1 MoS2 works via mainly ROS-
independent oxidative stress followed by strong attachment to
the bacteria. In contrast, C6 MoS2 works via oxidative stress
and moderate membrane depolarization of the bacterial
membrane, while C8 MoS2 acts through mainly rapid
depolarization of the bacterial membrane, thereby causing
bacterial death.
In contrast to unmodified MoS2 (chemically exfoliated 1T-
MoS2
14
or sulfurized 2H-MoS2
16
), surface functionalization
plays a crucial role in bacteriotoxicity of functionalized MoS2.
Nonfunctionalized materials mainly work through the ROS
formation, while our reported material works through
combination of ROS-independent oxidative stress and a cell
membrane depolarization pathway.
The combination of SEM and AFM analysis of the treated
bacteria also support the bactericidal mechanism of the action
described above (Figure 3). The AFM images were “Sobel
operated”31
for clear view of the sharp edges in the picture.
Although all MRSA has been treated with 2.5 × MIC dosage,
the treated cells show distinct features because different
materials cause antibacterial activity through different mecha-
nisms. From the AFM images (Figure 3a−c) we can clearly
distinguish the untreated MRSA from the treated one. C1
MoS2-treated bacteria seem to aggregate, and the shape has
been stretched. We expect this because of the strong
attachment of functionalized ce-MoS2 to the bacterial surface,
thereby causing oxidative stress and disruption of the cellular
processes without much visible membrane damage. For positive
Table 1. Summary of MIC and MBC Values of Functionalized ce-MoS2 against Methicillin-Resistant S. aureus (MRSA) and P.
aeruginosa (PA)a
materials MRSA MIC MRSA MBC PA MIC PA MBC
ce-MoS2 >15 ppm not applicable >15 ppm not applicable
negative MoS2 >15 ppm not applicable no inhibition not applicable
neutral MoS2 no inhibition not applicable no inhibition not applicable
C1 MoS2 1.88 ppm (3.14 μg/ml) 3.75 ppm (6.26 μg/mL) >15 ppm not applicable
C6 MoS2 156 ppb (260 ng/mL) 156 ppb (260 ng/mL) 156 ppb (260 ng/mL) 156 ppb (260 ng/mL)
C8 MoS2 78 ppb (130 ng/mL) 78 ppb (130 ng/mL) 78 ppb (130 ng/mL) 78 ppb (130 ng/mL)
a
Concentrations are in ppm/ppb of [Mo] and in (w/v) of the functionalized material.
Figure 2. Mechanistic study of the functionalized ce-MoS2 for
bactericidal action. (a) Abiotic glutathione oxidation assay for
quantification of oxidative stress generated. (b) Quantification of
membrane depolarization of MRSA using DISC3(5) fluorescent
probe.
ACS Applied Materials & Interfaces Research Article
DOI: 10.1021/acsami.6b10916
ACS Appl. Mater. Interfaces XXXX, XXX, XXX−XXX
D
5. C8 MoS2, the treated cells have deformed membranes,
ruptured, and fused with each other, due to significant
membrane damage caused by membrane depolarization. SEM
analysis also provides strong evidence for the mechanism
proposed here (Figure 3d−f). The control image shows
spherical MRSA cells, while the treated cells have been
deformed. In C1 MoS2-treated sample, the aggregation of the
cells and covering by a sheet of MoS2 can be clearly seen. C8
MoS2-treated sample does not show any aggregation or
covering with MoS2, but the inset zoomed image of a single
cell clearly shows wrinkled and damaged membranes.
3.4. Activity against Biofilm. The biofilm formation of
planktonic bacteria has been a major source of prosthetic
infection, and the challenge has been to develop materials
which should not encourage biofilm formation.32
In biofilms,
the bacterial cells are encapsulated in secreted extracellular
polymeric substances (EPS), which heavily screen the bacterial
cells from the effect of antibiotics. In the present study, C1, C6,
and C8 MoS2 were observed to cause antibiofilm action against
MRSA. C6 and C8 MoS2 reduced the biofilm formation of P.
aeruginosa. Significant biomass reduction in the case of 48 h
grown biofilms of MRSA and P. aeruginosa, when treated with
functionalized positive ce-MoS2, was recorded. The viability of
the biofilm was also declined when treated with functionalized
positive ce-MoS2 (Figure 4a). One-way ANNOVA test shows
that the treated biofilm data is statistically significant compared
with that of control with p < 0.0001. Posthoc Turkey test shows
a significant difference between all of the treated sample with
control with p < 0.0001 and between 2 × MIC and 8 × MIC
with p < 0.01. This was further confirmed by the live−dead
fluorescence imaging of the treated biofilm. Figure 4b clearly
indicates the eradication of mature biofilms when treated with
C6 and C8 MoS2. The antibiofilm effect of C1 MoS2 against
MRSA has been included in the Supporting Information
(Figure S25).
3.5. Cellular Toxicity. A dose-dependent cellular toxicity
study of all the functionalized ce-MoS2 has been carried out
against HeLa cell line by MTT assay. We observed a very
minute reduction of cellular viability with dosages up to 32 ×
MIC of C8 and C6 MoS2 and up to 8 × MIC of C1 MoS2 in a
time frame of 24 and 72 h. Statistical analysis shows no
significant reduction of cellular viability up to 4 × MIC for all
materials. Although, for 8 × MIC there is a statistically
significant decrease in cell viability, for C1, C6, and C8 MoS2
on average 91%, 89%, and 80% cells are viable (Figure 5). Cell
viability of 16 × MIC and 32 × MIC for C6 and C8 MoS2 and
10 ppm of neutral and negative MoS2 has been included in the
Supporting Information (Figures S27 and S28). At 32 × MIC
for 72 h 59% and 64% cells are viable for C6 and C8 MoS2,
respectively. All these toxicity values indicate functionalized ce-
MoS2 elicits very low eukaryotic cellular toxicity.
3.6. Comparison with Existing Antibiotics. Most
interestingly, these functionalized ce-MoS2 show the lowest
antibacterial dosage in w/v compared to all other 2D materials,
nanoparticles, and even the small molecule-based antibiotics
reported so far. Figure 6 summarizes the position of
functionalized ce-MoS2 as an antibacterial agent compared to
other categories of materials (detailed tables in Supporting
Figure 3. AFM and SEM images of MRSA treated with functionalized
positive ce-MoS2. (a) AFM image of untreated MRSA (b, c) AFM
images of MRSA after treating it with 2.5 × MIC dosage of C1 and C8
MoS2 for 1 h. Scale of AFM images represents 200 nm. (d) SEM
image of untreated MRSA (e, f) SEM images of MRSA after treating it
with 2.5 × MIC dosage of C1 and C8 MoS2 for 1 h. Scale of SEM
images represents 2 μm. Inset in SEM images shows magnified single-
bacterial cells for better visualization of cell deformation. Figure 4. Antibiofilm properties of functionalized ce-MoS2 against 48
h grown mature biofilm of MRSA and P. aeruginosa. (a) Biomass and
viability of the functionalized ce-MoS2-treated biofilm. (b) Live−dead
stained fluorescence microscope image of the treated biofilms. Green
indicates live bacteria stained by Syto9. Red indicates dead bacteria
stained. Images have been taken in 20× magnification.
Figure 5. Viability of the HeLa cell incubated with different dosages of
C1, C6, and C8 MoS2 for 24 and 72 h. “ns” denotes no statistical
significant difference, and ** denotes p < 0.01 with respect to control.
ACS Applied Materials & Interfaces Research Article
DOI: 10.1021/acsami.6b10916
ACS Appl. Mater. Interfaces XXXX, XXX, XXX−XXX
E
6. Information, Tables S2 and S3). The statistical comparison of
medians of the data sets by the Kruskal−Wallis test has
indicated a significant reduction of dosage with p < 0.05 for
both Gram-positive and Gram-negative bacteria. To illustrate
some specific instances, in the case of Gram-positive bacteria,
the efficacy of C8 MoS2 at 2000 times lower dosage than that of
GO is demonstrated. In the case of Gram-negative pathogens,
C8 MoS2 works at a 615 times lower dosage than that of
nonfunctionalized ce-MoS2. Small molecules-based antibiotics
are the most widely used drugs for the clinical treatment of
bacterial infections. Our materials match the order of
magnitude of dosage needed for the small molecule-based
antibiotics to treat bacterial infection. For MRSA, C8 MoS2 is
effective at 5.8 and 7.7 times lower dosage than widely used
antibiotics Vancomycin33
and Daptomycin,34
respectively. For
P. aeruginosa, C8 MoS2 works at 7.7 and 3.8 times lower dosage
than widely used antibiotics Imipenem35
and Levofloxacin35
respectively. No nanomaterial has been reported until now to
match the efficacy of the small molecules in terms of w/v
dosage, and in that regard, functionalized ce-MoS2 is an
enormous improvement. Nanomaterials have been proven to
be a good alternative to prevent the antibiotic resistance
problems,8
mostly associated with small molecules, but they kill
bacteria at much higher concentration than small molecule-
based drugs. In the above perspective, we report a nanomaterial
that possesses all the advantages associated with nanomaterials-
based antibiotics and works at the dosage level of small
molecule-based drugs.
4. CONCLUSION
In summary, we demonstrated functionalized ce-MoS2 as a
highly effective antibiotic agent against Gram-positive and
Gram-negative ESKAPE pathogens and their corresponding
biofilms. The mechanistic study reveals that, by altering the
hydrophobicity of positively charged MoS2 one can tune the
antibacterial pathway between ROS-independent oxidative
stress generation and depolarization of bacterial membrane.
We report a highly efficient functionalized nanomaterial-based
broad spectrum antibiotic agents against ESKAPE pathogens,
which could be an alternative to the conventional small
molecule-based antibiotics. Further surface modification and
alteration based on positively functionalized MoS2 can even
strengthen its progress toward development of a new genre of
antibiotics.
■ ASSOCIATED CONTENT
*S Supporting Information
The Supporting Information is available free of charge on the
ACS Publications website at DOI: 10.1021/acsami.6b10916.
Synthetic details of ligands, functionalization and
characterization methods, ICP-MS, biofilm quantification
and imaging, AFM and SEM sample preparation;
bacterial growth curves for MIC, agar plate images for
MBC, detailed MIC value comparison chart with existing
materials, contact angle values, cellular toxicity data
(PDF)
■ AUTHOR INFORMATION
Corresponding Author
*E-mail: md@orgchem.iisc.ernet.in.
Author Contributions
§
S.P., S.K., and S.K.B. contributed equally to this work.
Notes
The authors declare no competing financial interest.
■ ACKNOWLEDGMENTS
We thank the Department of Science and Technology (DST,
Government of India) and Council for Scientific and Industrial
Research (CSIR, Government of India) for their major financial
support. We are grateful to the Department of Biotechnology
(DBT, Government of India) for financial support to the
“Centers of Excellence and Innovation in Biotechnology”
scheme through the center of excellence project: “Translational
Center on Biomaterials for Orthopedic and Dental Applica-
tions”. S.P thanks DST for his KVPY undergraduate scholar-
ship. S.K. and S.K.B. thank DST-INSPIRE and CSIR for
doctoral fellowships.
■ ABBREVIATIONS
ce-MoS2 chemically exfoliated MoS2
MRSA methicillin-resistant S. aureus
MIC minimum inhibitory concentration
MBC minimum bactericidal concentration
SEM scanning electron microscope
AFM atomic force microscope
■ REFERENCES
(1) Ventola, C. L. The Antibiotic Resistance Crisis: Part 1: Causes
and Threats. Pharm. Ther. 2015, 40, 277−283.
(2) McKenna, M. Antibiotic Resistance: the Last Resort. Nature
2013, 499, 394−396.
(3) Boucher, H. W.; Talbot, G. H.; Bradley, J. S.; Edwards, J. E.;
Gilbert, D.; Rice, L. B.; Scheld, M.; Spellberg, B.; Bartlett, J. Bad Bugs,
No drugs: No ESKAPE! An Update from the Infectious Diseases
Society of America. Clin. Infect. Dis. 2009, 48, 1−12.
(4) Walsh, C. T.; Wencewicz, T. A. Prospects for New Antibiotics: a
Molecule-Centered Perspective. J. Antibiot. 2014, 67, 7−22.
(5) Boucher, H. W.; Corey, G. R. Epidemiology of Methicillin-
Resistant Staphylococcus aureus. Clin. Infect. Dis. 2008, 46, S344−
S349.
(6) Klevens, R. M.; Edwards, J. R.; Tenover, F. C.; McDonald, L. C.;
Horan, T.; Gaynes, R. Changes in the Epidemiology of Methicillin-
Figure 6. Antibacterial dosage comparison of functionalized ce-MoS2
with existing 2D materials, nanoparticles, and other small molecule
based drugs. Range of dosage with a line at the median has been
plotted in the graph (detailed table with dosage values has been
provided in the Supporting Information, Tables S2 and S3). Kruskal−
Wallis test shows the significance of the data set with p < 0.05,
demonstrated in the graph with an asterisk (*).
ACS Applied Materials & Interfaces Research Article
DOI: 10.1021/acsami.6b10916
ACS Appl. Mater. Interfaces XXXX, XXX, XXX−XXX
F
7. Resistant Staphylococcus aureus in Intensive Care Units in US
Hospitals, 1992−2003. Clin. Infect. Dis. 2006, 42, 389−391.
(7) Nikaido, H. Multidrug Efflux Pumps of Gram-Negative bacteria.
J. Bacteriol. 1996, 178, 5853−5859.
(8) Li, X.; Robinson, S. M.; Gupta, A.; Saha, K.; Jiang, Z.; Moyano, D.
F.; Sahar, A.; Riley, M. A.; Rotello, V. M. Functional Gold
Nanoparticles as Potent Antimicrobial Agents Against Multi-Drug-
Resistant Bacteria. ACS Nano 2014, 8, 10682−10686.
(9) Hu, W.; Peng, C.; Luo, W.; Lv, M.; Li, X.; Li, D.; Huang, Q.; Fan,
C. Graphene-Based Antibacterial Paper. ACS Nano 2010, 4, 4317−
4323.
(10) Boda, S. K.; Broda, J.; Schiefer, F.; Weber-Heynemann, J.; Hoss,
M.; Simon, U.; Basu, B.; Jahnen-Dechent, W. Cytotoxicity of
Ultrasmall Gold Nanoparticles on Planktonic and Biofilm Encapsu-
lated Gram-Positive Staphylococci. Small 2015, 11, 3183−3193.
(11) Bhimanapati, G. R.; et al. Recent Advances in Two-Dimensional
Materials beyond Graphene. ACS Nano 2015, 9, 11509−11539.
(12) Liu, S.; Zeng, T. H.; Hofmann, M.; Burcombe, E.; Wei, J.; Jiang,
R.; Kong, J.; Chen, Y. Antibacterial Activity of Graphite, Graphite
Oxide, Graphene Oxide, and Reduced Graphene Oxide: Membrane
and Oxidative Stress. ACS Nano 2011, 5, 6971−6980.
(13) Qi, Z.; Bharate, P.; Lai, C.-H.; Ziem, B.; Böttcher, C.; Schulz, A.;
Beckert, F.; Hatting, B.; Mülhaupt, R.; Seeberger, P. H.; Haag, R.
Multivalency at Interfaces: Supramolecular Carbohydrate-Function-
alized Graphene Derivatives for Bacterial Capture, Release, and
Disinfection. Nano Lett. 2015, 15, 6051−6057.
(14) Yang, X.; Li, J.; Liang, T.; Ma, C.; Zhang, Y.; Chen, H.;
Hanagata, N.; Su, H.; Xu, M. Antibacterial Activity of Two-
Dimensional MoS2 Sheets. Nanoscale 2014, 6, 10126−10133.
(15) Rasool, K.; Helal, M.; Ali, A.; Ren, C. E.; Gogotsi, Y.; Mahmoud,
K. A. Antibacterial Activity of Ti3C2T x MXene. ACS Nano 2016, 10,
3674−3684.
(16) Liu, C.; Kong, D.; Hsu, P.-C.; Yuan, H.; Lee, H.-W.; Liu, Y.;
Wang, H.; Wang, S.; Yan, K.; Lin, D.; Maraccini, P. A.; Parker, K. M.;
Boehm, A. B.; Cui, Y. Rapid water disinfection using vertically aligned
MoS2 nanofilms and visible light. Nat. Nanotechnol. 2016,
DOI: 10.1038/nnano.2016.138.
(17) Mout, R.; Moyano, D. F.; Rana, S.; Rotello, V. M. Surface
Functionalization of Nanoparticles for Nanomedicine. Chem. Soc. Rev.
2012, 41, 2539−2544.
(18) Kim, S. T.; Saha, K.; Kim, C.; Rotello, V. M. The Role of Surface
Functionality in Determining Nanoparticle Cytotoxicity. Acc. Chem.
Res. 2013, 46, 681−691.
(19) Wu, G.; Li, P.; Feng, H.; Zhang, X.; Chu, P. K. Engineering and
Functionalization of Biomaterials via Surface Modification. J. Mater.
Chem. B 2015, 3, 2024−2042.
(20) Chou, S. S.; De, M.; Kim, J.; Byun, S.; Dykstra, C.; Yu, J.;
Huang, J.; Dravid, V. P. Ligand Conjugation of Chemically Exfoliated
MoS2. J. Am. Chem. Soc. 2013, 135, 4584−4587.
(21) Chen, X.; Berner, N. C.; Backes, C.; Duesberg, G. S.;
McDonald, A. R. Functionalization of Two-Dimensional MoS2: On
the Reaction Between MoS2 and Organic Thiols. Angew. Chem., Int.
Ed. 2016, 55, 5803−5808.
(22) Joensen, P.; Frindt, R.; Morrison, S. R. Single-Layer MoS2.
Mater. Res. Bull. 1986, 21, 457−461.
(23) Boda, S. K.; Pandit, S.; Garai, A.; Pal, D.; Basu, B. Bacterial
Siderophore Mimicking Iron Complexes as DNA Targeting
Antimicrobials. RSC Adv. 2016, 6, 39245−39260.
(24) Konai, M. M.; Haldar, J. Lysine-Based Small Molecules That
Disrupt Biofilms and Kill both Actively Growing Planktonic and
Nondividing Stationary Phase Bacteria. ACS Infect. Dis. 2015, 1, 469−
478.
(25) Lomond, J. S.; Tong, A. Z. Rapid Analysis of Dissolved
Methane, Ethylene, Acetylene and Ethane using Partition Coefficients
and Headspace-Gas Chromatography. J. Chromatogr. Sci. 2011, 49,
469−475.
(26) Jönsson, J.; Vejrosta, J.; Novak, J. Air/water Partition
Coefficients for Normal Alkanes (n-Pentane to n-Nonane). Fluid
Phase Equilib. 1982, 9, 279−286.
(27) Chow, P. K.; Singh, E.; Viana, B. C.; Gao, J.; Luo, J.; Li, J.; Lin,
Z.; Elías, A. L.; Shi, Y.; Wang, Z.; Terrones, M.; Koratkar, N. Wetting
of Mono and Few-Layered WS2 and MoS2 Films Supported on Si/
SiO2 Substrates. ACS Nano 2015, 9, 3023−3031.
(28) Gottenbos, B.; Grijpma, D. W.; van der Mei, H. C.; Feijen, J.;
Busscher, H. J. Antimicrobial Effects of Positively Charged Surfaces on
Adhering Gram-Positive and Gram-Negative Bacteria. J. Antimicrob.
Chemother. 2001, 48, 7−13.
(29) Singh, A.; Nicholls, P. Cyanine and Safranine Dyes as
Membrane Potential Probes in Cytochrome c Oxidase Reconstituted
Proteoliposomes. J. Biochem. Biophys. Methods 1985, 11, 95−108.
(30) Zhang, L.; Dhillon, P.; Yan, H.; Farmer, S.; Hancock, R. E.
Interactions of Bacterial Cationic Peptide Antibiotics with Outer and
Cytoplasmic Membranes of Pseudomonas aeruginosa. Antimicrob.
Agents Chemother. 2000, 44, 3317−3321.
(31) Pal, N. R.; Pal, S. K. A Review on Image Segmentation
Techniques. Pattern recognition 1993, 26, 1277−1294.
(32) Wu, H.; Moser, C.; Wang, H.-Z.; Høiby, N.; Song, Z.-J.
Strategies for Combating Bacterial Biofilm Infections. Int. J. Oral Sci.
2015, 7, 1−7.
(33) Kosowska-Shick, K.; Ednie, L. M.; McGhee, P.; Smith, K.; Todd,
C. D.; Wehler, A.; Appelbaum, P. C. Incidence and Characteristics of
Vancomycin Non-susceptible Strains of Methicillin-Resistant Staph-
ylococcus aureus at Hershey Medical Center. Antimicrob. Agents
Chemother. 2008, 52, 4510−4513.
(34) Diederen, B. M.; van Duijn, I.; Willemse, P.; Kluytmans, J. A. In
Vitro Activity of Daptomycin against Methicillin-Resistant Staph-
ylococcus aureus, Including Heterogeneously Glycopeptide-Resistant
Strains. Antimicrob. Agents Chemother. 2006, 50, 3189−3191.
(35) Lister, P. D.; Wolter, D. J.; Wickman, P. A.; Reisbig, M. D.
Levofloxacin/Imipenem Prevents the Emergence of High-Level
Resistance Among Pseudomonas aeruginosa Strains Already Lacking
Susceptibility to One or Both Drugs. J. Antimicrob. Chemother. 2006,
57, 999−1003.
ACS Applied Materials & Interfaces Research Article
DOI: 10.1021/acsami.6b10916
ACS Appl. Mater. Interfaces XXXX, XXX, XXX−XXX
G