1. Funding Stormwater Controls in Maryland
Robert E. Jenkins, April 2015
Introduction
Urban stormwater runoff is the fastest growing, controllable source of primary pollutants
impacting the health of the Chesapeake Bay (US EPA 2010). With annual increases in human
population and expansion of urbanized areas, pollutant loadings are projected to increase by
over two million pounds within the next 20 years (MDE 2013) . Given the uncertainties of being
able to reduce these targeted pollutants from the other major source sectors- agricultural,
industrial, publicly owned treatment works (POTW), atmospheric deposition- it is critical that the
urban stormwater source be controlled. Of the many environmental issues facing the
Chesapeake Bay and Maryland, urban stormwater runoff and the appropriate way to address
and fund reductions are among the most contentious. A critical component to the success of
controlling urban stormwater will be the development of an adequate and stable funding
program. The recent controversy that surrounds the so called "Rain Tax" illustrates the difficulty
that is associated with developing such a funding base.
Among many state residents there is a general lack of understanding of the requirements for
stormwater mitigation, as well as a specific lack of understanding of the stormwater remediation
fee, i.e. the "Rain Tax". A recent poll of Maryland voters found that 50% of those surveyed
believe that residents will be taxed when it rains (Raabe 2015). Confusion also exists over the
how urban stormwater mitigation is funded, the great variability by which mitigation fees are
determined and then utilized at the county level, as well as the disparity that exists from
jurisdiction to jurisdiction. In the same poll referenced above, 75% of voters surveyed were
unsure of the fee structure within their local jurisdiction, with most unwilling to hazard a guess
(Raabe 2015). The current approach in Maryland requires certain counties, specifically those
with Municipal Separate Storm Sewer System (MS4) permits, to pay a stormwater mitigation
fee, while other counties do not. In order to effectively address the issue of urban stormwater
mitigation, current policies should be revamped and uniformly applied, and education and
economic incentivization plans more fully developed in order to engage all stakeholders.
Background
The Chesapeake Bay Watershed consists of six states: New York, Pennsylvania, Virginia, West
Virginia, Delaware, Maryland, and the District of Columbia, with a combined population of over
18 million. The Bay Watershed drains approximately 64,000 acres of land into the Bay proper,
with the freshwater drainage contributing approximately half of the Bay's 18 trillion gallon
volume. The Chesapeake Bay supports significant plant and animal life, as well as providing
recreational and economic opportunities.
The Bay is currently in a state of ill health, which Bay states have been attempting to address
for more than 40 years. The Bay's ill health is due in no small part to the effects of the primary
2. pollutants nitrogen, phosphorous, and sediment, which is typically expressed as total
suspended solids (TSS). Excess loadings of the primary pollutants has resulted in:
decreased water clarity
extensive algal blooms that block sunlight from beds of underwater grasses
degradation of habitat for submerged aquatic vegetation and biota such as the blue
crab and oyster
creation of hypoxic/anoxic dead zones which are incapable of supporting and
sustaining viable populations of underwater life
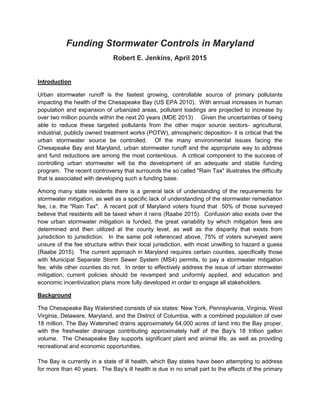
Current estimates indicate that approximately 20% of the nutrient, and 40% of the sediment
pollutant loadings reaching the Chesapeake Bay are due to urban stormwater runoff (Fig. 1).
These pollutant loadings originate from both natural and anthropogenic sectors and are a mix
of point and non-point sources.
Pollution originating from a single, identifiable source is considered point source. Non-point
source pollution can be generated from multiple locations and is not attributable to a specific
source. Stormwater pollution is generated as water moves over or through the ground, picking
up and transporting pollutant loads. As the runoff moves, it picks up and transports both natural
and man-made pollutants, eventually depositing them into a receiving water body. The water
carrying the pollutant loadings can originate from natural processes such as rainfall or
snowmelt, or as a result of human activities. Contaminated stormwater constitutes one of the
world’s main transport mechanisms introducing non-point source pollutants into receiving waters
(Pitt et al. 1995), but is generally treated as a point source, subject to regulation via permitting.
For a more detailed explanation of the regulatory process addressing stormwater please refer
to the "Regulations and Requirements" section of the paper.
The deterioration of the Bay and it's tributary watersheds is by no means limited to problems
attributable solely to the primary pollutants. Urbanization exerts a strong influence on the
quality of stormwater, which is being increasingly contaminated by a variety of physical,
chemical, and biological pollutants stemming from anthropogenic activities commonly practiced
in urban areas (Pitt et al. 1995; Zgheib, Moilleron, and Chebbo 2012).
Physical pollutants include thermal pollution from dark impervious surfaces such as streets and
rooftops, as well as tons of litter and floatables that are transported via stormwater.
Chemical pollutants are extremely varied. A 2008 study by Zgheib established a list of 88
stormwater priority substances (i.e. 65 organic substances, 8 metals and 15 volatile organic
compounds), based on Europe's Water Framework Directive list of priority substances and the
adapted version of the Chemical Hazard Identification and Assessment Tool methodology
(Zgheib, Moilleron, and Chebbo 2012). 55 of these stormwater priority substances were found
at least once within the monitored sites, with 21 being found in all samples. By comparison, the
Clean Water Act identifies and regulates 126 priority substances. A study by Pitt determined
that of a selected group of 39 stormwater contaminants designated as toxic pollutants by the
Environmental Protection Agency (EPA), 19 were found in stormwater runoff at least 10% of the
3. Primary Pollutants of Concern-Sector Contributions
Figure 1. The percentages of nitrogen(1a), phosphorous(1b), and sediment(1c) contributed annually by
source to the Chesapeake Bay. Stormwater runoff consists of both regulated and unregulated sources.
All data attributable to: http://baystat.maryland.gov/causes-of-the-problems-map/.
Agriculture
37%
Wastewater
Treatment
26%
Stormwater
Runoff
20%
9.5 million lbs.
Septic
6% Forests
11%
Nitrogen Contribution by Source - 46.9 million lbs.
Fig. 1a
Agriculture
53%Wastewater
Treatment
20%
Stormwater
Runoff
22%
640,000 lbs.
Forests
5%
Phosphorous Contribution by Source - 2.9 million lbs.
Fig. 1b
Agriculture
50%
Wastewater
Treatment
1%
Stormwater
Runoff
39%
492 million lbs.
Forests
10%
Sediment Contribution by Source - 1.2 billion lbs.
Fig. 1c
4. time (Pitt et al. 1995). Notable among the contaminants found were polyaromatic hydrocarbons
(PAH), which are a major concern with regards to public health and environmental impact due to
their carcinogenic and mutagenic properties (Hwang and Foster 2006).
Improperly disposed of pet waste and illicit sewer connections can be sources of biological
pollutants such as bacteria and viruses. The health hazards posed by organisms such as fecal
coliform bacteria are well documented.
Causes
There are three main factors influencing the continued growth of urban stormwater runoff:
changes in population, in land development, and in impervious surface.
The most recent census data from 2010 shows Maryland's population to be approximately 5.8
million residents. Decadal projections generated by the Maryland Department of Planning
predict a 20% population increase by 2040, equivalent to one million more residents in the state
within the next 25 years (MDP 2014). Both historically and in future projections, populations in
all regions of the state continue to increase, with the greatest increases occurring in areas that
are already experiencing urbanization.
The ever increasing number of residents within the state has resulted in significant changes in
land development over the same time period. Historical increases in the amount of urbanized
land in the U.S., as well as a projected increase in the amount of developed land from 5.2
percent to 9.2 percent by 2025 suggest that urbanization is a major domestic trend (Pickett and
Belt 2007). It is estimated that as of 2010, the global human population has shifted from
predominantly rural and agricultural to urban (Pickett and Belt 2007). A similar trend in the
amount of land development can be seen within Maryland (Fig 2). Maryland's total land area is
approximately 6.2 million acres with over 1.6 million acres developed, an increase of 150% over
the last fifty years (MDP 2010a). Since the early 2000's, a large portion of this development has
occurred in areas that are designated as priority funding areas. Priority funding areas are those
in which development is encouraged due to the existence of established infrastructure and the
allowance for higher population densities. These areas are typically targeted for economic
growth and development. However, "large lot" development, development of low density
residential property greater than half an acre, accounts for more than half of the developed land
within the state (MDP 2010a).
Population increases and land development changes occur both in areas where infrastructure
and services already exist, as well as in areas where they do not. The combination of
population increase and land development creates the need for maintenance of existing
infrastructure, as well as development of new infrastructure such as roads, sewers, waste
disposal, et al., resulting in an increase in impervious cover (Fig. 3)
5. Developed Land in Maryland: 1973-2010
Figure 2. Maps indicating the change in land development within Maryland's 6.2 million acres. All data
attributable to: Maryland Department of Planning (MDP 2010a).
1973
10.5% of total
land area
developed.
2010
27% of total
land area
developed.
6. Impervious Surface Coverage in Maryland: 1985-2010
Figure 3. Maps indicating the change in impervious surface coverage within Maryland. All data
attributable to: Maryland Department of Planning (MDP 2010b).
2010
1985
7. Effects
Increases in population are coupled with an increase in development, along with an expansion
of urbanized areas. As the sizes of the developed and urbanized areas increase, there is a
concomitant increase in the amount of impervious surface as well. The increase in impervious
surface results in increased runoff and pollutant loadings shunted directly into transporting water
bodies. Excess stormwater runoff has historically had a degrading impact on both terrestrial
and aquatic ecosystems (Carlson and Traci Arthur 2000) as evidenced by the physical,
chemical and biological changes that occur in more urbanized systems.
Physical
Urbanized conditions route stormwater to streams in less time and in greater quantities. The
change in shape seen on a hydrograph (Fig. 4a), is a result of urbanization impacts on drainage
networks and impervious cover (Sillanpää and Koivusalo 2015). Changes in flow regime -
magnitude, duration, frequency and timing of flows, differential flow rates - can be modified by
urbanization.
Higher peak flows can lead to stream degradation and habitat alteration as well as increasing
sediment loadings from erosion and runoff. The impacts on channelization of streams and
disengagement from their floodplains (both through incision and excavation) have increased the
efficiency with which flow is transferred from headwaters to catchment outlets (Fletcher, Vietz,
and Walsh 2014). Construction, the loss of existing vegetation, and the compaction of soil
result in the modification of natural channels and the capacity for soil absorption (Fig. 4b).
Infiltration capacity becomes almost nil with much of the remaining soil nearly impervious,
decreasing the potential for infiltration and storage, and increasing the rate at which the soil
becomes saturated (Booth 1997). The severity of a precipitation event and how stormwater
runoff occurs is effectively changed by covering land with impervious surfaces such as roads
and roofs.
Chemical
TSS loadings and the potential adsorption capacity of sediment are of particular concern. Many
studies conducted on stormwater quality (Gromaire-Mertz et al. 1999; Davis, Shokouhian, and
Ni 2001; Rügner et al. 2014) have indicated that pollution in stormwater is mainly bound to
particles. Population growth with increased urban sprawl shows a strong positive correlation
with increased traffic activity, which is responsible for high levels of PAHs in urban runoff and
the consequent degradation of water quality (Hwang and Foster 2006). PAHs are hydrophobic,
and typically found in association with particle loadings (Fig. 5). Incomplete vehicle combustion
can result in formation of soot carbon residue. Because of high porosity and the ability to form
very stable bonds, particulate soot carbon has been known to exhibit a high affinity for planar
aromatic compounds like PAHs (Hwang and Foster 2006). These higher concentrations of
PAHs in suspended sediments can be attributed to increased urban pressure, with
contaminated particles carrying an urban (PAH) signal related to surface runoff from urban
space, occurrence of coal tar sealcoats, et al. (Rügner et al. 2014).
8. Figure 4. Differences in stream flow (4a) and stream geometry (4b) due to change in urbanized area (US
EPA 1992; Schueler 1987).
4a
4b
9. Figure 5. Comparison of particulate and dissolved PAH concentrations during base flow and storm flow
(Hwang and Foster 2006).
10. Biological
Watershed development and impervious surface coverage has also been positively correlated
with fecal bacterial contamination in freshwater urban streams (Mallin, Johnson, and Ensign
2009) with rainfall runoff having major impacts on water quality. Positive correlations occur
between rainfall and TSS, turbidity, and fecal coliform abundance (Fig 6), with correlations
indicating increased loadings of constituents from anthropogenic and natural sources during
storms (Mallin, Johnson, and Ensign 2009).
Figure 6. Dry versus wet-period concentrations of TSS, turbidity (mean + standard error of the mean),
and fecal coliform bacteria (geometric mean) in urbanized (BMC), suburban (SC), and rural (PGC)
catchments; significantly different at *p<0.05. The unit of measure for fecal coliform is colony forming
units (CFU)/100 mL. (Mallin, Johnson, and Ensign 2009)
The cited studies in the "Effects" section of the paper clearly demonstrate the negative aspects
resulting from increased urbanization and stormwater runoff. Flow regime changes due to
urbanization lead to more impactful precipitation events and loadings of sediment. Surface
water pollution by inorganic and organic chemicals, as well as by fecal bacteria, is higher in
urban watersheds with concentrations of these pollutants becoming much greater following
precipitation events. Increasing urbanization within a watershed is therefore both a source and
means of transport for physical, chemical, and biological pollutants to surface waters.
11. It is clear that stormwater runoff and the pollutant loadings carried within it are problematic. As
the pressures influencing runoff continue to increase, it only becomes more critical that
mitigation efforts increase as well. The initial means of addressing stormwater runoff and
mitigation is through legislation, both federally and at the state level.
Regulations and Requirements-Federal
The Clean Water Act (CWA), an improved and expanded version of the Federal Water Pollution
Control Amendments, was signed into law in 1972 despite the opposition of then-President
Richard Nixon. The main tenet of the CWA is the protection and restoration of the physical,
chemical, and biological integrity of the nation's waters, with a minimum goal of waters being
fishable and swimmable. The CWA gives the US Environmental Protection Agency (EPA)
authority to regulate pollutant loadings that are affecting the designated uses and water quality
standards of all navigable waters of the US, as well as ensuring that those same waters do not
degrade.
Section 303(d) of the CWA requires that states develop impaired waters lists for water bodies
not meeting their designated uses and water quality standards. Total Maximum Daily Loads
(TMDLs) are developed for waterbodies placed on the list, which specifies the maximum
amount of a pollutant that a waterbody can receive in order to meet water quality standards. A
TMDL consists of wasteload allocations (WLAs) for point sources (PS) and load allocations
(LAs) for nonpoint sources (NPS), with a margin of safety (MOS) included. (Eq. 1)
TMDL = ΣWLA + ΣLA + MOS (1)
Point sources are regulated through the National Pollutant Discharge Elimination System
(NPDES) program, with all PS discharges required to have an NPDES permit. Traditionally,
stormwater runoff was considered a NPS, but in 1987 the CWA was amended to designate
stormwater discharge as a point source.
Stormwater runoff is transported and discharged into receiving waters via Municipal Separate
Storm Sewer Systems (MS4s), which are controlled by public agencies (counties, state
agencies, et al.) but are not connected to POTW's. NPDES permits are written for MS4s in
order to control the wasteload allocations from stormwater runoff and to limit the transport of
harmful pollutants. As per Section 402 of the CWA, MS4 permits require controls to reduce
pollutant discharge to the Maximum Extent Practicable (MEP). (Sawyers et al. 2014) A 2002
EPA memorandum stated that Water Quality Based Effluent Limits (WQBELs) for stormwater
discharge permits may be expressed in the form of Best Management Practices (BMPs) through
an iterative approach (Wayland and Hanlon 2002). However, a more recent memorandum from
the EPA encourages the use of measurable requirements, and if possible, numeric criteria for
effluent limitations. (Sawyers et al. 2014)
Regulations governing MS4's went into effect in two Phases, both dependent on population.
Phase I was initiated in 1990 and applies to medium or large cities and jurisdictions with
12. populations greater than 100,000. MS4's in Phase I are assigned individual permits, either for
each outfall discharging stormwater runoff into receiving waters, or as a systemic requirement.
Under Phase I permits, there are seven standard conditions to be met (Table 1).
Phase II applies to jurisdictions with smaller urbanized populations and was initiated in 1999.
MS4's in Phase II are given general permits and are obligated by law to implement at least six
minimum measures of control (Table 2). All six control measures are facets of individual permit
requirements.
Table 1. Requirements for individual Phase I MS4 permits
Condition Purpose
Permit Administration Assign individual to liaise with MDE
Legal Authority Ensure county maintains appropriate legal authority
Source Identification Identify pollutant sources to stormwater runoff; submit specified GIS data
annually
Management Programs Implement and maintain programs to address stormwater, erosion and
sediment, illicit discharges, trash and litter; address pollutant loadings from
county facilities; public education and outreach
Restoration Plans/TMDL County-wide assessment of watersheds; restoration of 20% of county
assessed impervious surface area; assure TMDL compliance; solicit public
input as regards restoration, TMDL compliance, water quality
Assessment Controls Establish monitoring programs to determine effectiveness of restoration
plans and BMPs
Program Funding Annual reporting of costs associated with mitigation efforts; assurance of
funding; insufficient funds are not considered as noncompliance
Table 2. Control measures required under Phase II MS4 permitting
Control Measure Addresses
Public Education Impact of stormwater discharge, how public can reduce
pollutants
Public Participation Public involvement in restoration efforts
Illicit Discharge Detection/Elimination Identification and elimination of illicit connections to the
Maximum Extent Practicable (MEP)
Construction Site Control Erosion and sediment control at construction sites;
compliance to Maryland Annotated Code's more stringent
requirements equates to compliance with NPDES permit
Post-Construction Control Stormwater management within new developments;
compliance to Maryland Annotated Code's requirement for
jurisdictional stormwater management plans equates to
compliance with NPDES permit
Housekeeping Reduction of pollutant loadings from municipal facilities
13. Though EPA is the federal authority, a great deal of latitude has been given to states through
cooperative federalism to assess whether water bodies are meeting their designated uses.
States establish TMDLs for those waters that are impaired (303d list), and are responsible for
the NPDES permitting of point sources. In Maryland, the agency responsible for such actions is
the Department of the Environment (MDE). In cases where jurisdictions are not meeting their
permit requirements, or there exists unregulated stormwater discharges -high growth areas,
areas with significant impervious cover, headwater areas- both EPA and MDE have Residual
Designation authority allowing them to designate such areas for NPDES permitting. (US EPA
2010)
Regulations and Requirements-Maryland
A summary of the legal history of stormwater mitigation in Maryland
1982 MD General Assembly passes Stormwater Act; put in place to address the
stormwater runoff impacts from new development.
1990 Implementation of Phase I (medium to large cities or counties, population greater
than 100,000) NPDES permitting for all MS4's addressing stormwater discharge.
1999 Implementation of Phase II general permitting; Phase II includes small MS4's
within urbanized areas. Measurable goals for each control measure must be in place.
MDE has the authority to require a jurisdiction to obtain an individual permit.
1982
Stormwater Act
1990
Phase 1
2000
Stormwater
Design Manual
2007
Stormwater Act
2012
HB 987
2015
SB 863
14. 2000 Adoption of the Stormwater Design Manual; main goals are the protection of state
waters from urban stormwater runoff, and to provide guidance on the design and quality
of constructed Best Management Practices (BMP's).
2007 MD General Assembly passes the Stormwater Act of 2007; requires the use of
Environmental Site Design (ESD) to the Maximum Extent Practicable (MEP).
2010 Chesapeake Bay TMDL; improvement of the Bay health through reduction of
pollutant loadings; states responsible for determining when and how goals are met.
Due to the lack of progress and visible results in the overall health of the Bay and
in accordance with the CWA, the EPA issued the Chesapeake Bay TMDL for the
primary pollutants. All jurisdictions within the Bay watershed are required to
meet 60% of their reduction goals by 2017, with full implementation in place by
2025. The means by which reduction goals are met are determined by the
jurisdictions themselves, and developed in the form of a Watershed
Implementation Plan (WIP), a blueprint as to how and when the reduction goals
will be met. The cost for Maryland to meet its reduction goals is estimated to be
~ $7.5 billion.
2012 House Bill 987; requires jurisdictions having Phase 1 MS4 permits to implement a
Watershed Protection and Restoration Program (WPRP), which is to be funded by
application of a stormwater remediation fee. Jurisdictional discretion is given in
determining the dollar value of the fee, and how the fee is assessed. Fees generated
are to be used exclusively for stormwater mitigation projects.
2014 Larry Hogan elected as the new Governor of Maryland; one of his main campaign
platforms is the elimination of stormwater mitigation fees.
2015 House Bills 481,773, 874; Senate Bills 36, 42, 588, *863[RaL1]; proposed bills
seeking to repeal or modify HB 987
Both Federal and State policies mandate reductions in stormwater runoff and its associated
pollutant loadings. The next step in the process is the implementation of reductions. Computer
programs such as MAST can be used to compare the effectiveness of BMPs at reducing
pollutant loadings on a per acre basis, but do not account for the monies required. To assess
the effectiveness of BMPs in mitigating stormwater runoff goes beyond the scope of this paper.
What is important to note is that there are costs associated with all levels of stormwater
reductions: capital, operation and maintenance, permit requirements, BMP retrofitting or
installation, TMDL requirements, WIPs, et al.
Costs for urban stormwater BMPs vary more widely and are more site‐ and project‐specific than
the costs of most other BMPs. (King and Hagan 2011) As mentioned in "Regulations and
Requirements-Maryland-2010" the cost for Maryland to meet the reduction goals of the Bay
15. TMDL alone are a staggering $7.5 billion dollars. The amount of monies needed throughout the
state highlights the crux issue of adequate funding.
Stormwater Mitigation Funding
The state has a number of methods to fund mitigation efforts:
Water Quality Revolving Loan Fund--offers money for stream corridor restoration and
protection
Chesapeake and Atlantic Coastal Bay Trust Fund--offers funds to assist with multiple
projects statewide
319 Grants--Federal grants made available by section 319 of the CWA; helps fund state
programs; provides grants to state and local projects that reduce or eliminate water
quality impairments
MDE has offered several grant programs to defray local retrofit project costs, but most
communities have relied on their local capital budgets to finance the majority of their retrofits.
(Bahr et al. 2012). Most revenue within these budgets is generated through taxes and fees.
Monies from the General Fund have traditionally been used to finance stormwater mitigation
efforts. The problem with such funding is that programs other than stormwater mitigation take
precedence resulting in budget shortfalls and insufficient funds to complete projects and meet
reduction goals.
As early as the mid-90's there was legislation in place that allowed localities to develop a fee
system. Continued inadequate funding and lack of progress in addressing stormwater runoff led
to pressure from environmental groups for a stable means of funding stormwater mitigation.
The end result was the passage of HB 987 in 2012 ("Regulations and Requirements-
Maryland"). The main impact of HB 987 was the creation of a Watershed Protection and
Restoration Program (WPRP), to be funded by application of a stormwater remediation fee.
Mitigation fees collected by jurisdictions cannot be redistributed into the General Fund. They
serve as a dedicated revenue source for projects related to reduction of stormwater pollutant
loadings: MS4 permit compliance, infrastructure upgrades, BMPs. Fees may also be used to
support stormwater educational and outreach programs.
The state has left the particulars of complying with HB 987 up to the jurisdictions. Jurisdictional
discretion was given in determining both the dollar value of the fee and the methods by which
the fee was to be assessed, however not all counties were required to comply with HB 987.
The law mandates that the 10 largest jurisdictions, those with Phase I MS4 permits, be
responsible for development of a WPRP and determining the means to fund it (Table 3).
16. Table 3. Listing of the jurisdictions directly impacted by House Bill 987, as well as associated
fees and the means by which they are assessed
Jurisdiction Residential Fee Based On Non-Residential
Fee
Based On
Anne Arundel $85/2940 ft
2
estimated ft
2
ISa
$85/2940 ft
2
IS actual ft
2
IS
Baltimore City $12-36/quarter actual ft
2
IS $18/quarter
minimum
IS/ERUb
(1050 ft
2
)
Baltimore $21-39/year type of dwelling $69/2000 ft
2
IS actual ft
2
IS
Carroll none none
Charles $43/year flat rate $43/year flat rate
Frederick $0.01/year flat rate $0.01/year flat rate
Harford $12.50/year
phase in, ($125)
IS : residential
property size
$0.07/500 ft
2
phase in, ($7)
actual ft
2
IS
Howard $15-90 prop. size/ ft
2
IS $15/500 ft
2
actual ft
2
IS
Montgomery $88.50/ERU
(2406 ft
2
)
ERU, type of
property
$88.50/ERU
(2406 ft
2
)
ERU, type of property
Prince
Georges
$33-62/year ESUc
(2465 ft
2
),
zoned lot size
variable total number of ESU
(2465 ft
2
)
a
IS (impervious surface)
b
ERU(Equivalent Residence Unit) is determined to be the median of impervious surfaces for all
single family homes within the county.
c
ESU (Equivalent Service Unit) is determined to be the median of impervious surfaces for all
single family homes within the county.
As stated in the Introduction, 75% of Maryland voters surveyed were unsure of the fee structure
within their local jurisdiction, with most unwilling to hazard a guess (Raabe 2015). When looking
at the information in Table 3, it is no surprise that confusion reigns. There is no consistency in
the fee structure or the means by which they are assessed.
Some counties base their fee structure on flat rates, while other counties' rates are determined
by a designated amount of impervious surface, again with no uniform structure. In Baltimore
County, the fee structure was set based on analysis of the amount of additional funding (beyond
what is already funded) needed to meet both the anticipated NPDES – MS4 permit
requirements, the anticipated General Industrial Stormwater Discharge Permit requirements for
county owned property, and the reductions needed to meet the Baltimore County stormwater
allocation for the Chesapeake Bay TMDL. (Baltimore County 2014) Carroll County successfully
proposed to MDE that their stormwater mitigation projects be funded through an increase in
property tax. Frederick County has done the same, but has initiated the nominal charge of
$0.01 to satisfy the letter of the law.
17. Given the amount of monies required throughout the state for stormwater mitigation projects, it
is vital that sufficient funds be generated and made available. In the case of Maryland's 10
largest jurisdictions there is an abject failure to do so (Table 4). In every jurisdiction, the funds
generated by current stormwater fees do not meet the budget requirements, resulting in
shortfalls across the board.
Table 4. Comparison of funds generated from application of stormwater mitigation fees to
costs associated with implementation of MS4 programs.
Jurisdiction Approximate Funds
Generated by SW
Fees
Funds Budgeted for
MS4 Programs FY
2014
Approximate Budget
Shortfall
Anne Arundel $22,000,000 $26,500,000 $4,500,000
Baltimore City $24,000,000 $12,870,000 $59,000,000
Baltimore $23,000,000 $62,000,000 $39,000,000
Carroll $0 $3,145,000 (FY 2012) $3,100,000
Charles $2,100,000 $3,400,000 $1,300,000
Frederick $48000 $980,420 $930,000
Harford $1,300,000 $10,000,000 $8,700,000
Howard $10,000,000 $23,727,000 $14,000,000
Montgomery $18,500,000 $51,728,000 $33,500,000
Prince
Georges
$7,900,000 $38,058,000 $30,000,000
Summary Statement
The effects of pollutant loadings on the Chesapeake Bay are well documented. Wholesale
changes in population, land use, and impervious surface are taking place statewide, and are
projected to continue on an upward trend. There are both federal and state policies in place to
address stormwater mitigation and funding, but there are inadequacies and inconsistencies in
the current means of generating funds.
HB 987 was intended to reduce the possibility of inadequate funding for stormwater mitigation.
Table 4 clearly illustrates that that has not happened. The Maryland Department of Legislative
Services found that several of the 10 jurisdictions have long term funding shortfalls for their
stormwater program, even with the established stormwater fee. (Center for Watershed
Protection 2013)
Although HB 987 implements a fee, and is the equivalent of a service charge, opponents quickly
dubbed it as "the rain tax", a title which has been polarizing and very effective in gaining support
18. in efforts to repeal the law. As referenced in the Introduction, 50% of Maryland voters surveyed
believe they will be taxed when it rains. The opponents of HB 987 have done an exceptional job
in mislabeling and misrepresenting the purpose it serves. There has been a failure at multiple
levels, both county and state, in providing effective communication and clarification to the
stakeholders responsible for the fee.
Recommendations
Given the environmental pressures and fiscal challenges facing all jurisdictions within Maryland,
it is not only necessary, but critical, that there be a dedicated means of funding stormwater
mitigation. In order for successful funding efforts to be implemented the following changes
should occur:
A. Current policies and methods for assessing stormwater mitigation fees should be
revamped and uniformly applied throughout the state.
Stormwater runoff and its associated pollutant loadings are statewide problems requiring
statewide solutions. All jurisdictions within Maryland have stormwater runoff reduction goals
that must be met, regardless of population or Phase designation. Jurisdictions should continue
to determine the priority and approach they would like to take in order to implement these
reductions, however the way in which the implementations are funded needs to change.
Frederick County, for example, placing a dedicated $48,000 into stormwater mitigation funding
and relying on monies from increased property taxes and the general fund to meet the lion's
share of associated costs will not suffice. Most applications of price instruments (fees) have
failed to have the incentive effects promised in theory, either because of the structure of the
systems or because of the low levels at which charges have been set. (Parikh et al. 2005)
A more adequate, stable, and understandable fee structure could be set up based on tiered IS
zones within jurisdictions. This would be akin to a topographical IS map. Where standard topo
maps designate zones by elevation, topo IS maps would designate zones and boundaries
based on the percent of IS within an area (Fig. 7).
New policy would be set, authorizing MDE to establish both the zonal, and fee structures for
each jurisdiction. This should not prove difficult, as jurisdictions within the state already provide
MDE with GIS data showing the amount of IS jurisdiction wide, as well as having ample data
readily available for cost and funding analyses. MDE would set threshold, and standard
minimum fees for each zone in each jurisdiction. Fees would be based on the amount of
impervious surface within a designated zone, and a cost analysis of each jurisdiction's
stormwater expenditures. An example of this fee structure can be seen in Table 5.
At the discretion of a jurisdiction, fees within a given zone could be set higher than the standard
minimum, however, they could not be dropped below the minimum zonal value calculated by
MDE. Although zonal rates would not be allowed to decrease, decreases in measured IS
and/or decreased loading rates due to BMPs could result in an IS zonal downgrade and
reduction in fees for all stakeholders within the downgraded zone, thus incentivizing mitigation
efforts. While it is likely there would be a number of legal challenges to this type of action,
questions of sovereignty aside, uniformity of purpose will lead to a more efficient system.
19. Figure 7. Example of proposed tiered IS zone structure. Image attributable to googlemaps:
https://www.google.com/maps
Table 5. Comparative proposed fee structures for stakeholders within an urbanized and rural
county in Maryland
B. Effective educational and economic incentivization plans should be developed so as
to more fully engage all stakeholders.
Besides the fact that having roughly half of the state's population believes they are being taxed
when it rains, 84% of voters in the 14 counties that are not subject to the fee said they were not
sure how much the fee would be in their county (Raabe 2015). . . the correct answer is $0.
There is a disturbing lack of understanding by a large proportion of the populace. This can best
be addressed through a multi-faceted campaign that effectively utilizes traditional and social
media, in combination with educational materials that clearly and concisely define stormwater,
mitigation, and funding issues. Ideally, this would be accomplished through the use of concrete,
"real life" examples that show how stormwater runoff and mitigation directly impacts
IS Zone
(%IS)
Baltimore County Fee
Structure
Resident/Business ($/yr)
Garrett County Fee
Structure
Resident/Business ($/yr)
90-100 50/100 25/50
75-89 40/90 20/45
60-74 30/80 15/40
90-100% IS
75-90% IS
60-75% IS
20. stakeholders, and highlights the benefits gained from successful mitigation efforts. The city of
Philadelphia has taken a number of steps in a similar vein, and are now reaping the benefits of
their efforts: $120 million/year in revenue, development of hundreds of "green infrastructure"
projects, reduction and treatment of stormwater. (Center for Watershed Protection 2013) The
successes seen in Philadelphia could serve as both impetus and catalyst for educational efforts
in Maryland.
Closely linked to both policy and education is incentivization to become a vested participant in
stormwater mitigation. Of the jurisdictions contributing mitigation fees, only a limited number
have initiated rebate or credit programs, while others are in the process of developing such
programs. Reimbursement for implementation of stormwater management practices would
result in some percentage of implementation costs being given back to the stakeholder. In other
areas of the US, this type of policy already exists. It has been shown that if the rebate offered is
high enough to encourage stormwater abatement behavior, a stormwater runoff reduction goal
can be met at a relatively low cost to the utility and at a low cost to the average property owner.
(Roy et al. 2008)
Credits should be offered for practices as long as they are maintained, and effective in reducing
stormwater. This could equate to a zonal reduction in IS and a reduced fee, potentially
generating greater community involvement so as to lower a zonal tier. As credits are offered as
part of the fee structure for stormwater mitigation funding, the ability to reduce damage to the
watershed, protect aquatic habitat, and improve overall water quality, will increase. The end
result would be seen as a decrease in the costs associated with stormwater mitigation. As
further incentive, increasing credit rewards could be offered to those who make improvements
beyond an established minimum. (Doll, Scodari, and Lindsey 1998)
An added benefit to establishing IS zones and educating and incentivizing stakeholders would
be the ease in implementing a flow regime approach to stormwater runoff. The idea behind this
approach is to re-naturalize hydrologic processes on a smaller individual scale, while working to
restore natural low and high flow hydrology at the catchment scale. (Fletcher, Vietz, and Walsh
2014) Effectively implementing stormwater reduction is an important step, one which would
hasten the success in meeting the achievable goals of fishable and swimmable State waters,
and a healthy Chesapeake Bay.
Works Cited
Bahr, Ray, Ted Brown, L J Hansen, Joe Kelly, Jason Papacosma, Virginia Snead, Bill Stack, et
al. 2012. “Recommendations of the Expert Panel to Define Removal Rates for Urban
Stormwater Retrofit Projects Interstate Commission on the Potomac River Basin,” 1–62.
Baltimore County. 2014. “NPDES 2014 Annual Report--Baltimore County, MD.”
http://resources.baltimorecountymd.gov/Documents/Environment/Annual
Reports/2014/11npdesreport150108.pdf.
21. Booth, Derek B and C J Jackson. 1997. “Urbanization of Aquatic Systems - Degredation
Thresholds, Stormwater Detention, and the Limits of Mitigation.” Water Resources Bulletin
33: 1077–90.
Carlson, Toby N, and S Traci Arthur. 2000. “The Impact of Land Use — Land Cover Changes
due to Urbanization on Surface Microclimate and Hydrology: A Satellite Perspective.”
Global and Planetary Change 25 (1-2): 49–65. doi:10.1016/S0921-8181(00)00021-7.
Center for Watershed Protection. 2013. “The Value of Stormwater Fees in Maryland,” no. Figure
1. http://cwp.org/images/stories/PDFs/SW Utility Fact Sheet2.pdf.
Davis, Allen P., Mohammad Shokouhian, and Shubei Ni. 2001. “Loading Estimates of Lead,
Copper, Cadmium, and Zinc in Urban Runoff from Specific Sources.” Chemosphere 44:
997–1009. doi:10.1016/S0045-6535(00)00561-0.
Doll, Amy, Paul Scodari, and Greg Lindsey. 1998. “Credits_as_Incentives.pdf.”
http://www.cues.rutgers.edu/meadowlands-district-
stormwater/pdfs/Doc28_Doll_et_al_1998_Credits_as_Incentives.pdf.
Fletcher, T. D., G. Vietz, and Christopher J Walsh. 2014. “Protection of Stream Ecosystems
from Urban Stormwater Runoff: The Multiple Benefits of an Ecohydrological Approach.”
Progress in Physical Geography. doi:10.1177/0309133314537671.
Gromaire-Mertz, M. C., S. Garnaud, a. Gonzalez, and G. Chebbo. 1999. “Characterisation of
Urban Runoff Pollution in Paris.” Water Science and Technology. doi:10.1016/S0273-
1223(99)00002-5.
Hwang, Hyun-Min, and Gregory D Foster. 2006. “Characterization of Polycyclic Aromatic
Hydrocarbons in Urban Stormwater Runoff Flowing into the Tidal Anacostia River,
Washington, DC, USA.” Environmental Pollution (Barking, Essex : 1987) 140 (3): 416–26.
doi:10.1016/j.envpol.2005.08.003.
King, Dennis, and Patrick Hagan. 2011. “Costs of Stormwater Management Practices In
Maryland Counties.”
Mallin, Michael a., Virginia L. Johnson, and Scott H. Ensign. 2009. “Comparative Impacts of
Stormwater Runoff on Water Quality of an Urban, a Suburban, and a Rural Stream.”
Environmental Monitoring and Assessment 159: 475–91. doi:10.1007/s10661-008-0644-4.
MDE. 2013. “Final Report of the Workgroup on Accounting for Growth ( AfG ) in Maryland.”
http://www.mde.state.md.us/programs/Water/TMDL/TMDLImplementation/Pages/Accounti
ng_For_Growth.aspx.
MDP. 2010a. “A Summary of Land Use Trends in Maryland: The Maryland Department of
Planning 2010 Land Use / Land Cover Product.”
http://planning.maryland.gov/PDF/OurWork/LandUse/MDP2010_LU_Summary.pdf.
22. ———. 2010b. “Impervious Surfaces Maryland 1985 - 2010 USGS.”
http://imap.maryland.gov/Documents/TechnicalCommittee/Presentations/Impervious
Surfaces Visualized (Option B).pdf.
———. 2014. “Historical and Projected Total Population for Maryland’s Jurisdictions.”
http://www.planning.maryland.gov/msdc/S3_Projection.shtml.
Parikh, Punam, Michael a. Taylor, Theresa Hoagland, Hale Thurston, and William Shuster.
2005. “Application of Market Mechanisms and Incentives to Reduce Stormwater Runoff. An
Integrated Hydrologic, Economic and Legal Approach.” Environmental Science and Policy
8 (December 1999): 133–44. doi:10.1016/j.envsci.2005.01.002.
Pickett, Steward T. a., and Kt Belt. 2007. “Watersheds in Baltimore, Maryland: Understanding
and Application of Integrated Ecological and Social Processes.” … Water Research & …
1997 (1): 44–55. doi:10.1111/j.1936-704X.2007.mp136001006.x.
Pitt, Robert., R. Field, M. Lalor, and M. Brown. 1995. “Urban Stormwater Toxic Pollutants:
Assessment, Sources, and Treatability.” Water Environment Research 67 (3): 260–75.
doi:10.2175/106143095X131466.
Raabe, Steve. 2015. “Clean Water Healthy Families Coalition: Maryland Voter Poll on
Stormwater Remediation Fee.” http://www.cleanwaterhealthyfamilies.org/wp-
content/uploads/2015/03/Stormwater-Poll-Memo-3.13.15-1.pdf.
Roy, Allison H., Seth J. Wenger, Tim D. Fletcher, Christopher J. Walsh, Anthony R. Ladson,
William D. Shuster, Hale W. Thurston, and Rebekah R. Brown. 2008. “Impediments and
Solutions to Sustainable, Watershed-Scale Urban Stormwater Management: Lessons from
Australia and the United States.” Environmental Management 42: 344–59.
doi:10.1007/s00267-008-9119-1.
Rügner, Hermann, Marc Schwientek, Marius Egner, and Peter Grathwohl. 2014. “Monitoring of
Event-Based Mobilization of Hydrophobic Pollutants in Rivers: Calibration of Turbidity as a
Proxy for Particle Facilitated Transport in Field and Laboratory.” The Science of the Total
Environment 490 (August): 191–98. doi:10.1016/j.scitotenv.2014.04.110.
Sawyers, Andrew D, Benita Best-wong, Water Division Directors, Robert H Wayland, and A
Hanlon. 2014. “Revisions to the November 22, 2002 Memorandum.”
Schueler, Thomas R. 1987. Controlling Urban Runoff: A Practical Manual for Planning and
Designing Urban BMPs. Department of Environmental Programs; Metropolitan Washington
Council of Governments.
Sillanpää, Nora, and Harri Koivusalo. 2015. “Impacts of Urban Development on Runoff Event
Characteristics and Unit Hydrographs across Warm and Cold Seasons in High Latitudes.”
Journal of Hydrology 521 (February): 328–40. doi:10.1016/j.jhydrol.2014.12.008.
23. US EPA. 1992. “Environmental Impacts of Stromwater Discharges: A National Profile.”
http://nepis.epa.gov/Exe/ZyNET.exe/9100QPUQ.txt?ZyActionD=ZyDocument&Client=EPA
&Index=1991 Thru 1994&Docs=&Query=(urban stormwater maryland) OR
FNAME=“9100QPUQ.txt” AND
FNAME=“9100QPUQ.txt”&Time=&EndTime=&SearchMethod=1&TocRestrict=n&Toc=&.
———. 2010. “MS4GuideR3final07_29_10.pdf.”
http://www.epa.gov/reg3wapd/pdf/pdf_chesbay/MS4GuideR3final07_29_10.pdf.
Wayland, Robert H, and James Hanlon. 2002. “Establishing Total Maximum Daily Load (TMDL)
Wasteload Allocations (WLAs) for Storm Water Sources and NPDES Permit Requirements
Based on Those WLAs.”
Zgheib, Sally, Régis Moilleron, and Ghassan Chebbo. 2012. “Priority Pollutants in Urban
Stormwater: Part 1 - Case of Separate Storm Sewers.” Water Research 46 (20): 6683–92.
doi:10.1016/j.watres.2011.12.012.