
Recommended
Recommended
More Related Content
Similar to Article Discussions1. What ar.docx
Similar to Article Discussions1. What ar.docx (20)
More from joyjonna282
More from joyjonna282 (20)
Recently uploaded
Recently uploaded (20)
Article Discussions1. What ar.docx
- 1. Article Discussions 1. What are the advantages and disadvantages of incremental internationalization? (From the article: Internationalization Process of Fast Fashion Retailers: Evidence of H&M and Zara) Globalization has made many businesses all over the world to adopt strategies that will give them a competitive edge over other similar businesses. Some of them have adopted incremental internationalization, which refers to the behavior of firms to start operations in domestic markets and later expand into new markets. This helps firms to establish themselves in local markets before venturing into new foreign markets. As such, it makes sense for a firm to first raise capital and learn the most efficient business operations locally before it can expand into other countries. Another advantage of incremental internationalization is that firms are facilitated to gather sufficient resources that enable them to come up with effective strategies to enter the new markets. For instance, a firm intending to operate globally should first consider setting up operations in a stable environment that will facilitate for its growth and sustainability. Based on the lessons learnt, it can then identify more effective strategies when operating in other countries. Some may argue that the model has become outdated due to increased competition that has forced companies to seek ways of faster penetration into new markets. However, incremental internationalization is an effective model for firms intending to grow gradually.. this model is also criticized as it encourages firms to have late market entry, which may limit their market share as other early entrants may have already taken over the market. 2. Why are international brands first introduced as premium brands in developing countries?(From the article: Evolution Patterns of Apparel Brands in Asian Countries: Propositions From an Analysis of the Apparel Industry in Korea and India)
- 2. It makes sense to attach higher prices to products so as to earn higher earnings. This concept has been used by many international firms, as premium brands are associated with high quality and well–designed products. This is due to the fact that local apparels are regarded as being inferior in quality and design. Therefore, premium brands fetch better prices, and the firm earns a competitive advantage over other firms producing domestic apparel. For instance, the Tommy Hilfiger brand is considered as a premium brand in India, and it is so costly that the price of one item is twice a worker’s monthly income. To support this point, most developing countries prefer wearing international brands to their own designs. This is due to the mentality that global brands are more superior. However, premium pricing is only a marketing strategy to enhance a company’s competitive advantage. 3. Which is the best method of approaching a consumer for retail clothing? (From the article: International Brand Management and Strategy: Apparel Market in China) The far end of the supply chain is the consumer, who has a big impact on the success of an apparel business. However, approaching consumers is one of the biggest challenges that businesses have to go through. It would help if the were to be aware that multiple methods of communication that are cumulated over time are the best options for approaching consumers. When making decisions regarding clothing items, consumers rely on pre–existing knowledge. Various communication sources should be used to get to the consumers so as to enhance brand awareness. For instance, in China, consumers for apparel do not take time to search for the best clothing items that are available, as their basis for selecting a particular brand is due to the attributes that have been communicated to them via various communication channels. In other parts of the world, this strategy can also be adopted. A company that sends a consistent message about its brand raises consumer awareness, therefore influencing consumer purchase decisions.
- 3. Discussion As seen in the Learning Activities, conducting research can be a time-intensive process. However, there are various methods that may help you conduct research more efficiently. This evidence can be categorized as primary or secondary sources. Primary research is based on first-hand observations and interpretations; in secondary research, you have to rely on another writer’s ability to find and analyze information. It is ideal to have a research strategy or plan in place before jumping into looking for sources. In this Discussion, you will build your research strategy. After completing the unit’s Activities, respond to the following questions in at least two well-developed paragraphs: • Include your thesis statement for an argument for change in your community or workplace, and identify at least three search terms you can use in the KU Library or an Internet search engine to find sources to support that thesis statement. • How will you evaluate the credibility of the sources you find, particularly those on the Internet? • What primary sources might be helpful for addressing questions that your secondary sources cannot answer? Journal of Consumer Marketing Country of origin factors influencing US consumers' perceived price for multinational products Jung Ha-Brookshire So-Hyang Yoon Article information: To cite this document: Jung Ha-Brookshire So-Hyang Yoon, (2012),"Country of origin factors influencing US consumers' perceived price for multinational products", Journal of Consumer Marketing, Vol. 29 Iss 6 pp. 445 - 454
- 4. Permanent link to this document: http://dx.doi.org/10.1108/07363761211259250 Downloaded on: 23 September 2015, At: 12:38 (PT) References: this document contains references to 33 other documents. To copy this document: [email protected] The fulltext of this document has been downloaded 1516 times since 2012* Users who downloaded this article also downloaded: Khalid I. Al-Sulaiti, Michael J. Baker, (1998),"Country of origin effects: a literature review", Marketing Intelligence & Planning, Vol. 16 Iss 3 pp. 150-199 http://dx.doi.org/10.1108/02634509810217309 Ronald Drozdenko, Marlene Jensen, (2009),"Translating country-of-origin effects into prices", Journal of Product & Brand Management, Vol. 18 Iss 5 pp. 371-378 http://dx.doi.org/10.1108/10610420910981855 Gerard P. Prendergast, Alex S.L. Tsang, Cherry N.W. Chan, (2010),"The interactive influence of country of origin of brand and product involvement on purchase intention", Journal of Consumer Marketing, Vol. 27 Iss 2 pp. 180-188 http:// dx.doi.org/10.1108/07363761011027277 Access to this document was granted through an Emerald subscription provided by emerald-srm:146575 [] For Authors If you would like to write for this, or any other Emerald publication, then please use our Emerald for Authors service information about how to choose which publication to write for and submission guidelines are available for all. Please visit www.emeraldinsight.com/authors for more information.
- 5. About Emerald www.emeraldinsight.com Emerald is a global publisher linking research and practice to the benefit of society. The company manages a portfolio of more than 290 journals and over 2,350 books and book series volumes, as well as providing an extensive range of online products and additional customer resources and services. Emerald is both COUNTER 4 and TRANSFER compliant. The organization is a partner of the Committee on Publication Ethics (COPE) and also works with Portico and the LOCKSS initiative for digital archive preservation. *Related content and download information correct at time of download. D ow nl oa de d by C al if or ni a St
- 7. 20 15 ( PT ) http://dx.doi.org/10.1108/07363761211259250 Country of origin factors influencing US consumers’ perceived price for multinational products Jung Ha-Brookshire and So-Hyang Yoon University of Missouri, Columbia, Missouri, USA Abstract Purpose – In response to the popularity of multinational products with limited information on countries of origins, this study aims to explore factors influencing consumers’ perceived prices for multinational products. Design/methodological approach – The study performed a 2 (COP) £ 2 (COM) within-subjects randomized experimental research, using the USA and China as the countries of parts (COP) and the countries of manufacturing (COM) for cotton apparel. A total of 77 US consumers participated. Hierarchical multiple regression analyses were performed. Findings – Consumers’ income level was important for perceived prices on apparel products made in the USA and/or of US cotton. Expertise was also
- 8. important for higher pricing of apparel made in the USA of US cotton, while familiarity with COO labeling laws negatively affected perceived prices when apparel was made in China. Perceived sustainability had the largest impact on consumers’ perceived prices for apparel made in the USA of Chinese cotton. Research limitations/implications – The study used a limited sample size and the data were collected through experimental studies. Generalization must be done with caution. Practical implications – Apparel businesses may want to declare COP, if this country could provide cues to high quality, high price, or excellent design. Apparel businesses that would like to promote US products may want to target those who have a high sense of self-efficacy and educate consumers with COO labeling rules and regulations. Originality value – The findings offer significant factors affecting consumers’ perceived price on multinationl products, providing business practice recommendations surrounding COP and COM. Keywords Country of origin, Perceived price, Multinational products, Hybrid products, United States of America, China, Consumer behaviour Paper type Research paper An executive summary for managers and executive readers can be found at the end of this article. Introduction Today’s economy is extremely complex and intricately
- 9. interwoven with multiple key players in multiple countries. Products that we see in the marketplace are the results of multinational collaborations and trades. Camry, a Toyota automobile, is a no longer a Japanese product as most Camrys currently sold in the US are built in the US and all 2012 model Camrys will be assembled in the US (Timmins, 2011). By contrast, a significant number of the parts used in a Ford or General Motors car are made in foreign countries and imported to be assembled into final products in the US. This does not make it easy to conclude whether or not a Camry is a Japanese or US product. Similarly, a question arises regarding how many foreign parts are allowed in a Ford or General Motors car while still allowing it to claim to be a US product. To some consumers, a Toyota Camry would be still a Japanese product, just as a Ford would be a US product. The concept of country of origin (COO), the country where products or services were manufactured, has recently expanded to country of parts (COP), country of
- 10. manufacturing (COM), country of brand (COB), and country of design (COD). Each COO offers different information, and consumers could use these more specific designations to evaluate product attributes based on different COO information. Consumers are interested in knowing COM to ensure products are safe and made in a safe manner. Others want to know COM to exercise their support for domestic economy and local communities. COP helps consumers make appropriate judgments of a country’s involvement in the overall manufacturing process, while COD and COB help communicate added values contributed by a country that is well known for excellence in the product category. The consumers demand for products made in the USA supports past studies on the COO effect. The COO effect refers to a consumer’s dependency on COO when formingThe current issue and full text archive of this journal is available at www.emeraldinsight.com/0736-3761.htm Journal of Consumer Marketing 29/6 (2012) 445–454
- 11. q Emerald Group Publishing Limited [ISSN 0736-3761] [DOI 10.1108/07363761211259250] This project was completed in part through research grants, Margaret Mangle Research Catalyst Award and Seeding Interdisciplinary Research Collaboration Fund by the College of Human Environmental Sciences, as well as Faculty Research Grant by the Center for the Digital Globe, awarded to the first author at the University of Missouri. 445 D ow nl oa de d by C al if or ni a
- 13. r 20 15 ( PT ) opinions on the quality of a product (Han and Terpstra, 1988). For example, when consumers see a product “Made in USA,” compared to a product “Made in China,” they may perceive the US product to be higher in quality and value. Particularly when price is unknown, certain product attributes, such as brand name or COO, are useful for consumers to form their own opinion on what the product price would be, in return, impacting purchase intention (Bettman et al., 1998; Zeithaml, 1988). Given the relationship between COO and consumers’ perceived price, the study was designed to explore factors influencing consumers’ perceived prices for multinational products. Using the US and China as COP and COM for cotton apparel, the study assessed the effect of consumers’ demographic characteristics, prior knowledge, and perceived sustainability on their perceived price. The study presents a
- 14. literature review of the COO effect and social responsibility, the COO effect and perceived prices, and information processing theory, followed by the research methods. The results are discussed and the study concludes with contributions, implications, limitations, and future research opportunities. Literature review COO effects and social responsibility The literature shows that COO plays a major role in consumers’ decision-making processes and influences how consumers view and evaluate product attributes (Samiee, 1994). The term COO effect refers to a consumer’s dependency upon COO when forming opinions on the quality of a product (Han and Terpstra, 1988). The previous research suggests consumers’ demographic characteristics and the economic development level of the country of origin are important factors in the COO effect. For example, Schooler (1971) found US female consumers evaluated foreign products higher than US male consumers did. Similarly, Wall and Heslop (1986) also found Canadian consumers have a more positive attitude towards foreign products than Canadian male consumers do. Younger consumers tend to evaluate foreign products more favorably than older people do
- 15. (Bailey and Pineres, 1997). Educated consumers with higher income were more likely to accept foreign products than consumers with limited education and lower income were (Bailey and Pineres, 1997). The past research also suggests that consumers rate products as higher quality if those products were produced in countries that are more economically developed and politically free (Wang and Lamb, 1983). Particularly, consumers have pre-conceived ideas for different countries and these stereotypical images of the countries affect consumers’ evaluation on product quality. One of the interesting findings on stereotype and the COO effect is that consumers prefer products from their own country because they believe domestic products have the highest quality and pose the least risk (Hooley et al., 1988). This idea stems from ethnocentrism, the belief in the inherent superiority of one’s own ethnic group or culture (Hooley et al., 1988). Ethnocentrism, coupled with 9/11 and the economic recession in 2008, fueled patriotism among US consumers, resulting in the heightened popularity of the “Buy Made in USA” campaign. These consumers focus on helping domestic economies and local communities, and, by purchasing US- made products, they believe they help fellow Americans (Lee et al., 2003). In this light, the COO effect has been discussed
- 16. in the socially responsible consumer behavior literature (Ha- Brookshire and Norum, 2011). Investigating the COO effect, however, is no longer a simple task. Many of today’s businesses are now producing their products all over the world, using raw materials produced in multiple countries. Thus, hybrid or multinational products (or products with more than one country of origin) are common in today’s marketplace place. Yet, most industries use a “one-country” origin designation that usually refers to the country where the product is manufactured. This practice makes it difficult to determine which country is a true country of origin for a multinational product. Therefore, some researchers have argued that multi-level COO must be declared to reflect today’s complex supply chain systems (Bilkey and Nes, 1982). In this light, the concepts of country of design (COD), country of assembly (COA), country of parts (COP), and country of manufacture (COM) were introduced as they could be useful for consumers’ value judgments (Essoussi and Merunka, 2007;
- 17. Insch and McBride, 1998). COD refers to the country where the final product was initially conceptualized and designed.. COP points out the country where component parts are manufactured. COA describes the country where the product is partially or fully assembled, but not ready to be sold to the end consumer COM refers to the country where the final product is manufactured. These multi-level COO determinations were found to affect consumers’ evaluations on the product quality (Chowdhury and Ahmed, 2009). Compared to a single-country COO designation, the multi-level COO determinations are also expected to help consumers better evaluate the contributions of different countries, so they could choose the products that fit their purchasing goals by using more accurate information. For example, if one sees the US as a COP even if COM is China, he or she may form different perceptions on the product’s social and environmental impact than a simple “Made-in China” label. Thus, multi-level COO designations
- 18. could help consumers better exercise their socially responsible consumption than single-country origin determinations. Despite the important impact of multi-level COO determinations, COM represents COO in the US marketplace (Samiee, 1994). Particularly for the textile and apparel products, COO marking rules enforced by the US Federal Trade Commission (2011) require that products display the country where the most significant assembly process occurred (or COM) as a COO on the finished product (United States Department of Agriculture, 2011). Translating COO effect into prices Among many variables, price is usually discussed in the literature as an influential extrinsic cue in relation to consumers’ evaluations of product alternatives and their purchase decisions (Veale and Quester, 2009). Studies found that consumers use price as a predictor of quality, particularly when they have limited knowledge of product offerings (Veale and Quester, 2009). Consumers often formulate a natural
- 19. ordering of products according to a price scale, believing the higher quality products are more expensive and products of lesser quality are cheaper; or the higher-priced products have higher quality and lower-priced products have lesser quality Country of origin factors influencing US consumers’ perceived price Jung Ha-Brookshire and So-Hyang Yoon Journal of Consumer Marketing Volume 29 · Number 6 · 2012 · 445–454 446 D ow nl oa de d by C al if or ni
- 21. be r 20 15 ( PT ) (Lee and Lou, 1996). This price/quality relationship is described as the price-reliance schema (Lee and Lou, 1996). Although the relationship between quality and price has been highly discussed, how price influences the COO effect has rarely been. To fill this gap, Drozdenko and Jensen (2009) recently attempted to translate the COO effect into prices and found that US consumers were willing to pay a 37 percent premium for US-made shoes and a 105 percent premium for US-made toothpastes, compared to the same products made in China. The authors continued that the more consumers were exposed to negative news concerning Chinese products, the price premiums US consumers were willing to pay increased. Similarly, Ha-Brookshire and Norum (2011) found that US consumers were willing to pay over a 17 percent
- 22. premium for a shirt made of US-grown cotton, compared to cotton without the COO display. All of these studies, however, have focused on consumers’ willingness to pay, rather than how much consumers believe that these products should cost, that is, perceived price. Perceived prices and information processing theory Although previous literature review shows that COO is an important extrinsic cue for consumers’ purchase intention and purchase behavior, the relationship between COO and perceived price has been little explored. Perceived price is defined as what a consumer gives up or sacrifices in order to obtain a product (Zeithaml, 1988). Thus, when actual price is unknown, consumers may use other available product attributes, such as brand name or COO, to form their own opinion on what the product price, and therefore, quality would be (Bettman et al., 1998). That is, when consumers face new product attributes, they generate perceived price and perceived quality, in return, impacting perceived value and purchase intention (Zeithaml, 1988). The thesis that consumers use various cues to construct their preferences is explained by Bettman’s (1979) information processing theory of consumer choice. Based on the notion that decision makers have limitations on their capacity for processing information, information processing theory suggests that consumers do not
- 23. always make perfect decisions. Rather, consumers make decisions based on the limited information available in a given situation. Information processing theory further explains that an act of preference construction is highly dependent on context and individual characteristics. Prior knowledge is one of the important factors in consumers’ preference construction as it is believed to facilitate the acquisition of new information as well as the use of existing information (Rao and Monroe, 1988). Prior knowledge is known to have two dimensions: familiarity and expertise (Alba and Hutchinson, 1987). Familiarity is defined as the number of product-related experiences accumulated by a consumer, and expertise refers to the ability to successfully perform product-related tasks, such as quality, price, and value evaluation. Thus, prior knowledge is defined as information held in memory about product alternatives as well as consumers’ ability to perform product-related tasks (Rao and Monroe, 1988). From the familiarity perspective, consumers are more likely to use extrinsic cues if new product attributes are unfamiliar to them, while they are less likely use extrinsic cues if they are more familiar with new product attributes (Rao and Monroe, 1988). The role of familiarity with new product attributes gets enhanced if consumers have expertise in such product
- 24. attributes (Rao and Monroe, 1988). That is, consumers who are familiar and have expertise in new product attributes are better able to assess product quality and value through an examination of intrinsic cues. However, consumers who are unfamiliar with new product attributes with little expertise in such attributes are more likely dependent on extrinsic cues for their product evaluation. Research questions Given that the COO effect exists and COO, particularly multi-level COO, is an important extrinsic cue for today’s consumers, who want to know where products are made to exercise their support for domestic economy and local communities, the study aimed to explore factors influencing consumers’ perceived prices for multinational products, which are extremely common in today’s marketplace. First, considering its impact on the COO effect, consumers’ demographic characteristics were included in the study as potential factors consumers may consider when forming perceived price. Following the information processing theory, prior knowledge was included in this study as a possible influential factor of consumers’ perceived price. Both familiarity and expertise were considered to characterize
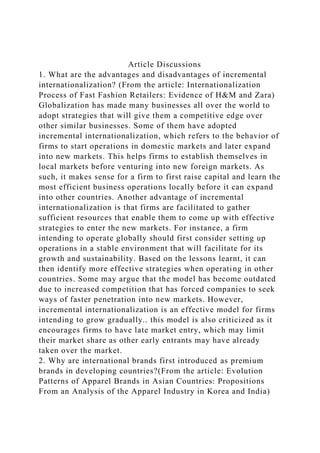
- 25. prior knowledge. Finally, the perception of the social and environmental impact, or perceived sustainability, of the product, suggested by multi-level COO designations, was considered a new product attribute, impacting perceived price. Figure 1 illustrates the study’s conceptual model. Methodology 2 3 2 within-subject randomized experimental design For the purpose of the study, a 2 (COP) £ 2 (COM) within- subjects randomized experimental research was designed. In this study, COP and COM were of interest to represent the multi-level COO designations for hybrid products. It was believed that a separate COP designation along with COM would affect how consumers perceived price. Two-level COO designations were used because the COO effect tends to become weaker if the COO construct is broken down into too many dimensions (Tse and Lee, 1993). Cotton shirts were used as the study manipulations. Cotton is an apparel product’s major part. In addition, cotton meets over half of the world’s apparel needs and almost everyone owns cotton apparel, regardless of income, gender, and age (Kadolph, 2011). For both COP and COM, the US and China were selected for a few reasons. First, these countries are two of the top cotton producing countries in the world. Second, over 50
- 26. percent of today’s cotton produced in the US is shipped to China to be further processed into apparel, making China the leading importer of US-grown cotton (United States Department of Agriculture, 2011). Third, China is the leading cotton apprel exporter to the US, supplying over 27 percent of the entire cotton apparel imported to the US marketplace in 2008 (Cotton Incorporated, 2009). Thus, it was reasonably assumed that a significant portion of US cotton exported to China comes back to the US as final apparel products. Yet, the final products bear only a “Made In China” label, undermining the contribution of US cotton. This phenomenon was particularly important for the study design, because many of today’s US consumers are seeking “Made In USA” products to help domestic economy, show patriotism, and demonstrate their social responsibility. Country of origin factors influencing US consumers’ perceived price Jung Ha-Brookshire and So-Hyang Yoon Journal of Consumer Marketing Volume 29 · Number 6 · 2012 · 445–454 447 D
- 28. dg e A t 1 2: 38 2 3 Se pt em be r 20 15 ( PT ) Sample After approval from the Institutional Review Board, participants were recruited through advertisements in
- 29. university news media and a local newspaper in spring 2011. A large retailer’s gift card for the amount of $5 was given to participants as an incentive. Totally, 77 participants were recruited and completed the study. Because the study was designed to be a set of randomized experiments with each participant as a block, it was possible to collect all 77 responses per cell created by the combination of two COP and two COM. This design met the sample size requirements suggested by Hair et al. (2006). First, the minimum sample size per cell was greater than the number of dependent variables, perceived price. Second, the sample size of 77 exceeded the minimum sample size per cell, 20, for repeated measures design. Third, 77 responses per cell ensured equal sample size per cell. Overall, 54 out of 77 participants were women and the rest were men. This was expected as the recruitment statements included the phrase “apparel shopping behavior” and women seemed more interested in this study than men. A total of 56 participants indicated themselves as Caucasian, 10 as Asian
- 30. and Pacific Islander, 7 as African American, and 4 as others. Participants ranged from 18 years old to 69 years old, with an average age of 30.6 years. A little over half of the participants were single or divorced and the rest were either in a relationship or married. Approximately half of the participants had some college or high school education, while the rest had college degrees or graduate education. Finally, over half of the participants indicated that they had over $30,000 as household income. Table I shows the study sample characteristics. Stimuli Four cards were created to represent four different sets of COP and COM of an apparel product. Each card was 3 inches wide and 2 inches long, and contained the following information in black lettering on a white background: . 100 percent Cotton from USA. Made in USA; . 100 percent Cotton from USA. Made in China; . 100 percent Cotton from China. Made in USA; and . 100 percent Cotton from China. Made in China. Variables
- 31. The price of a cotton shirt estimated by each respondent served as a dependent variable in this study. The dependent variable, perceived price, was measured by a single question asking the participant to estimate the retail price for each of the four types of cotton shirt with different COP and COM combinations. Nine predictor variables were included in this study, following the study’s conceptual model. The first block of predictor variables, demographic variables, served as control variables in our model. Demographic variables included the participants’ age, gender, marital status, education level, and household income. Figure 1 Conceptual model Table I Characteristics of the study sample Characteristic Frequency Percentage Gender Male 22 29.9 Female 54 70.1
- 32. Ethnicity Caucasian 56 72.7 African American/Black 7 9.1 Asian and Pacific Islander 10 13.0 Hispanic/Middle Eastern/Other 4 5.2 Age 21 and Under 24 31.2 22 to 34 31 40.3 35 to 44 6 7.8 45 to 54 9 11.7 55 to 64 5 6.5 65 and Over 2 2.6 Marital status In a relationship 20 26.0 Single/Divorced 39 50.6 Married 18 23.4 Education level Some high school education 1 1.3 High School degree 4 5.2 Some college education 34 44.2
- 33. College degree 22 28.6 Some graduate education 8 10.4 Graduate degree 16 20.8 Income Less than $10,000 18 23.4 $10,000-$29,999 17 22.1 $30,000-$59,999 16 20.8 $60,000-$99,999 15 19.8 $100,000-$119,999 7 9.1 $120,000-$199,999 3 3.9 $2000,000 above 1 1.3 Note: Total number of participants ¼ 77 Country of origin factors influencing US consumers’ perceived price Jung Ha-Brookshire and So-Hyang Yoon Journal of Consumer Marketing Volume 29 · Number 6 · 2012 · 445–454 448 D ow
- 35. e A t 1 2: 38 2 3 Se pt em be r 20 15 ( PT ) http://www.emeraldinsight.com/action/showImage?doi=10.1108/ 07363761211259250&iName=master.img- 000.jpg&w=424&h=90 The two dimensions of prior knowledge, familiarity and expertise, were included as the second block of predictor variables. Familiarity was then divided into two: familiarity
- 36. with COO labeling laws and familiarity with the concept of sustainability. Familiarity of COO labeling laws was measured to assess the participants’ procedural knowledge, while the familiarity of the concept of sustainability was intended to examine whether or not the participants possessed conceptual knowledge related to the study objectives. Conceptual knowledge refers to a person’s representation of major concepts (Reber and Reber, 2001). It is the kind of knowledge that cannot be learned by rote. It must be learned by thoughtful, reflective learning, and may be transferred between situations. Procedural knowledge is knowing the method of manipulating a specific condition or the technique for implementing a task. It is knowing how to control the relevant factors for examining some phenomenon (Reber and Reber, 2001). Responses were recorded on a five- point Likert scale ranging from “not familiar at all, or 1” to “very familiar, or 5.” Expertise was measured by the scale of self-efficacy as it is commonly used in the literature to assess one’s expertise (Schwarzer and Jerusalem, 1995). Self-efficacy is defined as the confidence in one’s coping ability across a wide range of demanding or novel situations (Bandura, 1994). A 30-item scale was adopted from Sherer et al. (1982) and Schwarzer and Jerusalem (1995) to examine the participants’ overall
- 37. confidence or belief that they could perform what they set out to do, or expertise. The third and last block of predictor variables was perceived sustainability for each stimulus card. Perceived sustainability was designed to assess the participants’ subjective judgment on the impact of sustainability of each stimulus when they were exposed to such stimulus. The participants were asked to rank each stimulus in the order of the least sustainable to the most sustainable option among the four cards. Data collection procedures Upon arrival at the university laboratory, participants were asked to complete surveys including demographic characteristics and prior knowledge. Then, the experiment began with the statement, “we are showing you four different cards that represent different country of origins of a cotton t- shirt in random order. Assuming all others are equal, please think about which option would be the most or least sustainable to the environment and society, and organize the cards in order from the most sustainable to the least sustainable. Please take as long as you wish.” Most participants took two to three minutes to respond to the initial instruction. This perceived sustainability of the product
- 38. was recorded from 1 to 4, 1 being the least sustainable to 4 being the most sustainable. Next, the four cards were mixed again and presented to the participants. This time, participants were presented with the statement “now, we found out that a typical cotton t-shirt sold in major stores in the US is made out of 100 percent cotton and has a label of ‘Made in China.’ The average price of this shirt is $40. Compared to a $40 shirt, how much do you believe that other options would cost at a retail store? Please indicate one retail price for each option while considering the sustainability impact of each card.” This procedure was done to obtain perceived price of each card, using a cotton shirt with a “100 percent cotton, Made in China” label as a control. The control card represents what consumers see in the marketplace under the current COO rules. The retail price of $40 was set to represent the medium quality, average- price cotton apparel products in the US marketplace. Participants took approximately two to three minutes to complete this task for all four cards. The responses were recorded as perceived price. Data analysis Four sets of hierarchical multiple regressions were performed. Petrocelli (2003) clarified hierarchical multiple regression
- 39. analysis is useful and powerful when researchers want to test theoretical assumptions and examine the influence of several predictor variables in a sequential way. By doing so, the relative importance of a predictor can be evaluated based on how much each predictor variable could add to the prediction of a dependent variable, over and above other important predictors. For the purpose of the study, hierarchical multiple regression analysis was deemed ideal as the technique would provide the relative importance of demographic characteristics, prior knowledge, and perceived sustainability on the participants’ perceived prices for four different combinations of COP and COM profiles of cotton shirts. In addition, the relationships between independent and dependent variables were hypothesized based on theoretical assumptions and past research. Regression coefficients and changes in R2 were examined throughout the analysis. Results Perceived price for products Made in USA with US cotton The mean perceived price for this card was $56.9 with standard deviation of 25.2. As indicated in Table II, nine predictor variables accounted for 28.0 percent of total variance in dependent variable, perceived price. Among the demographic variables, the respondents’ gender and income
- 40. showed statistically significant impact on the price estimate. First, men (standardized b ¼ 20.19; p , 0.10) and affluent (standardized b ¼ 0.37, p , 0.01) consumers provided a much higher perceived price for the product with this type of COM and COM designation. The incremental R2 for the entire demographic variables was 19.3. Second, participants’ expertise showed a statistically suggestive effect on perceived price (standardized b ¼ 0.21, p , 0.10) with an incremental R2 value of 4.1, after accounting for demographic variables. Third, perceived sustainability of this product has a statistically significant impact on perceived price (standardized b ¼ 0.23, p , 0.05) with an incremental R2 of 4.6, after accounting for demographic and prior knowledge variables. In sum, income, perceived sustainability, gender, and expertise were important factors for the participants perceived price for an apparel product made in USA with US cotton. Perceived price for products Made in China with US cotton For an apparel product made in China with US cotton, participants estimated it to be $46.9 with a standard deviation of 17.6. In addition, nine predictor variables accounted for 31.7 percent of the total variance in perceived price. First, participants’ income level showed a statistically significant
- 41. Country of origin factors influencing US consumers’ perceived price Jung Ha-Brookshire and So-Hyang Yoon Journal of Consumer Marketing Volume 29 · Number 6 · 2012 · 445–454 449 D ow nl oa de d by C al if or ni a St at e U
- 43. PT ) positive impact on perceived price (standardized b ¼ 0.37, p , 0.01), with an incremental R2 value of 18.5. Other demographic variables were not found statistically significant. In terms of prior knowledge, interestingly, participants’ familiarity with COO labeling laws showed a statistically significant, yet negative effect on their perceived price for this product (standardized b ¼ 20.23, p , 0.05), after accounting for demographic variables. That is, the more familiar the participants were with the COO laws, the lower they estimated the value of the product if it was made in China even if US cotton was used. Perhaps, participants put more weight on costs related to manufacturing than on raw materials costs, and thus, they thought the price should be lower if the product is made in China with high-price raw materials. Finally, perceived sustainability also showed a statistically significant impact on perceived price (standardized b ¼ 0.27, p , 0.05) with an incremental R2 of 5.9, after accounting for demographic and prior knowledge variables. Overall, income, perceived sustainability, and familiarity with COO labeling laws were important influencers of perceived price for an apparel product made in China with US cotton.
- 44. Perceived price for products Made in USA with Chinese cotton The mean price estimate for an apparel product made in USA with Chinese cotton was $46.1 with a standard deviation of 18 and nine predictor variables accounting for 37.2 percent (the highest of the four cards) of total variance in perceived price. First, participants’ income level showed a statistically significant positive impact on perceived price (standardized b ¼ 0.24, p , 0.05), with an incremental R2 value of 17.5. Other demographic variables were not found statistically significant. Different from the first two cards, prior knowledge showed no statistical significance on their perceived price, after accounting for demographic variables. Instead, perceived sustainability showed a statistically significant impact on perceived price (standardized b ¼ 0.40, p , 0.01) with an incremental R2 of 15.4, after accounting for demographic and prior knowledge variables. This finding suggested perceived sustainability is the single largest influencing factor on perceived price for the product made in USA with Chinese cotton. In short, income and perceived sustainability were important factors for perceived price for an apparel product made in the USA with Chinese cotton. Perceived price for products Made in China with Chinese cotton The mean price estimate for an apparel product made in
- 45. China with Chinese cotton was $38.2 with a standard deviation of 13. This price estimate was below the control price of an apparel product with a COO label of “Made in China” without any information on the origin of raw materials. In addition, nine predictor variables accounted for only 19.2 percent (the lowest of the four cards) of total variance in perceived price. Age was the only demographic variable with a statistically suggestive positive impact on perceived price (standardized b ¼ 0.27 p , 0.10), with an incremental R2 value of 7.6. Other demographic variables were not found statistically significant. Instead, prior knowledge was found to be significant for their perceived price with an incremental R2 value of 9.4, after accounting for demographic variables. More specifically, participants’ familiarity with COO labeling laws showed a statistically suggestive, yet negative effect on their perceived price (standardized b ¼ 20.21, p , 0.10). Participants’ familiarity with the concept of sustainability showed a statistically suggestive positive effect on perceived price (standardized Table II Results of hierarchical multiple regression for perceived prices 100% Cotton from USA Made in USA 100% Cotton from
- 46. USA Made in China 100% Cotton from China Made in USA 100% Cotton from China Made in China Mean of perceived pricesa (standard deviation) $56.9 (25.2) $46.9 (17.6) $46.1 (18.0) $38.2 (13.0) Demographicsb Age 0.06 20.07 0.18 0.27 * Gender (Female) 20.19 * 20.18 20.15 0.00 Marital status (married) 20.10 20.01 20.09 20.22 Education 0.10 0.15 0.03 0.05 Income 0.37 * * * 0.37 * * * 0.24 * * 0.07 Incremental R2 (%) 19.3 * * * 18.5 * * * 17.5 * * * 7.6 Prior knowledgeb Familiarity with COO labeling laws 20.05 20.23 * * 20.12 20.21
- 47. * Familiarity with sustainability 0.15 0.16 0.18 0.25 * Efficacy 0.21 * 0.17 0.13 0.08 Incremental R2 (%) 4.1 7.2 * 4.4 9.4 * Sustainabilityb Perceived sustainability 0.23 * * 0.27 * * 0.40 * * * 0.17 Incremental R2 (%) 4.6 * * 5.9 * * * 15.4 * * * 2.6 Total R2 (%) 28.0 31.7 37.2 19.5 Note: n ¼ 77; aControl price was $40 for a cotton shirt with the “Made in China” label; bEntries are standardized regression coefficients; *Indicates p , 0.10; * *Indicates p , 0.05; * * *Indicates p , 0.01 Country of origin factors influencing US consumers’ perceived price Jung Ha-Brookshire and So-Hyang Yoon Journal of Consumer Marketing Volume 29 · Number 6 · 2012 · 445–454 450 D ow nl oa
- 49. t 1 2: 38 2 3 Se pt em be r 20 15 ( PT ) b ¼ 0.25, p , 0.10). Different from the rest of the three cards, perceived sustainability had no impact on perceived price, after accounting for demographic and prior knowledge variables. Overall, age, familiarity with COO labeling laws and familiarity with the concept of sustainability were important influencers of perceived price for an apparel product made in China with Chinese cotton.
- 50. Conclusions and managerial implications In response to the large quantity of multinational products with limited information on countries of origins, the study explored factors influencing consumers’ perceived prices for multinational products. Particularly, given the US imports over 90 percent of its apparel from the rest of the world and China is the leading exporter of such products, the study used the US and China as the countries of parts and manufacturing to assess consumers’ perceived prices. Demographic variables, prior knowledge, and perceived sustainability were included in the study as potentially influential factors for consumers’ perceived price. The hierarchical multiple regression results from a 2 (COP) £ 2 (COM) within-subjects randomized experimental research of 77 participants in the US showed several interesting findings. First, even for a product made in China, consumers believe it would be more costly if the label includes the US as the origin of the cotton origin and less costly if the label includes China as the cotton origin. This indicates that where raw materials were produced does matter to consumers’ perceived prices, even if the country of
- 51. manufacturing is the same. Thus, businesses may want to declare the origins of the countries in which raw materials produced, if this country could provide cues to high quality, high price, or excellent design. This added information to the current COO would help raise the value of the products in consumers’ mind. The government also may want to consider establishing requirements of declaring COP in addition to COM, as some products without COM could be deceiving or confusing to consumers. Second, the results showed the different factors affecting consumers’ perceived prices for products with multi-level COO designations. For example, male consumers with high income, who believe they have expertise, tend to have higher perceived sustainability on products made in USA with US cotton, resulting in higher perceived price for such products. Consumers with little knowledge of COO labeling laws tend to have higher perceived sustainability on products made in China, regardless of fiber origins. Thus, businesses that would like to promote US products may want to target those who have a high sense of self-efficacy and educate consumers with COO labeling rules and regulations. The more they are familiar with COO labeling laws and the more confident they
- 52. are in themselves, the more consumers would value US products. Third, the study finding showed the explanatory power (15.4 percent) of perceived sustainability on products made in the USA with Chinese cotton is very powerful. In addition, it was 3.4 times greater than that on products made in USA with US cotton. Today’s marketplace in the US is full of cotton apparel made in China with US cotton, rather than made in the USA with Chinese cotton. This trend can be seen by the trade data, showing the US rarely imports Chinese cotton while it exports a great amount of cotton to China where most cotton is processed into apparel before being re- exported back to the US. Given the fact of the abundance of products made in China with US cotton in the US marketplace, this finding offer important implications for businesses whether they should communicate COP, COM, or both. Finally, overall, demographic variables had the most explanatory powers over perceived price across the study stimuli, ranging from 17.5 percent to 19.3 percent. Particularly, except for products made in China with
- 53. Chinese cotton, consumers’ income was the most or second most important factor for their perceived price of products with US involvement as COP, COM, or both. Prior knowledge or perceived sustainability have relatively lower power than demographic variables, and this finding poses challenges to businesses as to how to influence consumers for additional values that COP might provide. After all, if consumers do not have high income, the value of sustainability alone may not be significant enough to change consumers’ purchase behavior. Limitations and future research opportunities As most other research, this study also has limitations and, therefore, future research opportunities. First, although the study findings showed interesting consumer profiles for products with different COP and COM combinations, the study did not examine why consumers have such high perceived value for US-made products using US raw materials – almost twice as high as Chinese-made products using Chinese raw materials. If we could understand why this phenomenon occurs and what type of consumers overvalue US-made products, businesses, policy makers, researchers,
- 54. and consumer advocacy groups would be able to help inform consumers of the fair value of US-made products. This would help consumers be less affected by fraud or deception that may occur from incomplete COO labels and less turned off by the high price of US-made products. Second, although experimental research design was useful to keep participants fully engaged in the study and produce good quality data from the participants’ responses, because of the laboratory setting, some participants might have provided what they perceived to be socially acceptable answers. Thus, further studies in a natural shopping environment are recommended, where researchers are not intrusive and participants may not feel judged by answers they provide during the study. Third, a greater sample size in a larger population is recommended to help generalize the study findings. Finally, given the fact that US-made products have different meanings for consumers from different countries and cultures, cross-cultural studies investigating the effect of COP and COM on perceived prices of domestic products and foreign products would be fruitful to further our knowledge
- 55. on the COO effect. References Alba, J. and Hutchinson, J. (1987), “Dimensions of consumer expertise”, Journal of Consumer Research, Vol. 13, pp. 411-54. Bailey, W. and Pineres, S. (1997), “Country of origin effects on product evaluation”, Journal of International Consumer Marketing, Vol. 9 No. 3, pp. 25-41. Country of origin factors influencing US consumers’ perceived price Jung Ha-Brookshire and So-Hyang Yoon Journal of Consumer Marketing Volume 29 · Number 6 · 2012 · 445–454 451 D ow nl oa de d by C
- 57. 3 Se pt em be r 20 15 ( PT ) http://www.emeraldinsight.com/action/showLinks?crossref=10.1 300%2FJ046v09n03_03 http://www.emeraldinsight.com/action/showLinks?crossref=10.1 300%2FJ046v09n03_03 http://www.emeraldinsight.com/action/showLinks?crossref=10.1 086%2F209080&isi=A1987G554200001 Bandura, A. (1994), “Self-efficacy”, in Ramachaudran, V. (Ed.), Encyclopedia of Human Behavior, Academic Press, New York, NY, pp. 71-81. Bettman, J. (1979), An Information Processing Theory of Consumer Choice, Addision-Wesley, Reading, MA. Bettman, J., Luce, M. and Payne, J. (1998), “Constructive
- 58. consumer choice processes”, Journal of Consumer Research, Vol. 25, pp. 187-217. Bilkey, W. and Nes, E. (1982), “Country of origin effects on product evaluation”, Journal of International Business Studies, Vol. 1, pp. 89-99. Chowdhury, H. and Ahmed, J. (2009), “An examination of the effects of partitioned country of origin on consumer product quality perceptions”, International Journal of Consumer Studies, Vol. 33, pp. 496-502. Cotton Incorporated (2009), “Supply chain insights: the economy and apparel sourcing trends”, available at: http:// lifestylemonitor.cottoninc.com/Supply-Chain-Insights/ Economy-and-Apparel-Sourcing-Trends-02-09/ (accessed 28 June 2011). Drozdenko, R. and Jensen, M. (2009), “Translating country- of-origin effects into prices”, Journal of Product & Brand Management, Vol. 18 No. 5, pp. 371-8. Essoussi, L. and Merunka, D. (2007), “Consumers’ product evaluations in emerging markets: does country of design, country of manufacture, or brand image matter?”, International Marketing Review, Vol. 24 No. 4, pp. 409-26.
- 59. Ha-Brookshire, J. and Norum, P. (2011), “Willingness to pay for socially responsible products: case of cotton apparel”, Journal of Consumer Marketing, Vol. 28 No. 5, pp. 344-53. Hair, J.J., Black, W.C., Babin, B.J. and Anderson, R.E. (2006), Multivariate Data Analysis, 6th ed., Prentice Hall, Upper Saddle River, NJ. Han, C. and Terpstra, V. (1988), “Country of origin effects for uni-national and bi-national products”, Journal of International Business Studies, Vol. 19, pp. 235-55. Hooley, G., Shipley, D. and Krieger, N. (1988), “A method for modelling consumer perceptions of country of origin”, International Marketing Review, Vol. 5 No. 3, pp. 67-76. Insch, G. and McBride, J. (1998), “Decomposing the country-of-origin construct: an empirical test of county- of-design, country-of-parts, and country-of-assembly”, Journal of International Consumer Marketing, Vol. 10 No. 4, pp. 69-91. Kadolph, S. (2011), Textiles, 11th ed., Prentice Hall, Upper Saddle River, NJ. Lee, M. and Lou, C.-C. (1996), “Consumer reliance on intrinsic and extrinsic cues in product evaluations:
- 60. a conjoint approach”, Journal of Applied Business Research, Vol. 12 No. 1, pp. 21-30. Lee, W.-N., Hong, J.-Y. and Lee, S.-J. (2003), “Communicating with American consumers in the post 9/ 11 climate: an empirical investigation of consumer ethnocentrism in the United States”, International Journal of Advertising, Vol. 22, pp. 487-510. Petrocelli, J. (2003), “Hierarchical multiple regression in counseling research: common problems and possible remedies”, Measurement and Evaluation in Counseling and Development, Vol. 36, pp. 9-22. Rao, A. and Monroe, K. (1988), “The moderating effect of prior knowledge on cue utilization in product evaluations”, Journal of Consumer Research, Vol. 15, pp. 253-64. Reber, A.S. and Reber, E. (2001), The Penguin Dictionary of Psychology, 3rd ed., Penguin Books, London. Samiee, S. (1994), “Customer evaluation of products in global markets”, Journal of International Business Studies, Vol. 25 No. 3, pp. 579-604. Schooler, R. (1971), “Bias phenomena attendant to the marketing of foreign goods in the US”, Journal of
- 61. International Business Studies, Vol. 2 No. 1, pp. 71-81. Schwarzer, R. and Jerusalem, M. (1995), “Generalized self- efficacy scale”, in Weinman, J., Wright, S. and Johnston, M. (Eds), Measures in Health Psychology: A User’s Portfolio. Casual and Control Beliefs, NFER-Nelson, Windsor, pp. 35-7. Sherer, M., Maddux, J.E., Mercandante, B., Prentice-Dunn, S., Jacobs, B. and Rogers, R.W. (1982), “The self-efficacy scale: construction and validation”, Psychological Reports, Vol. 51, pp. 663-71. Timmins, B. (2011), “All 2012 Toyota Camrys sold in US will be built in US”, Motor Trend, available at: http:// wot.motortrend.com/all-2012-toyota-camrys-sold-in-u-s- will-be-built-in-u-s-114803.html (accessed 30 September 2011). Tse, D. and Lee, W. (1993), “Removing negative country images: effects of decomposition, branding and product experience”, Journal of International Marketing, Vol. 1 No. 4, pp. 25-48. United States Department of Agriculture (2011), “US export sales for week ending 6/16/2011”, available at: www.fas. usda.gov/export-sales/cottfax.htm (accessed 30 June 2011).
- 62. United States Federal Trade Commission (2011), “Textile, wool, fur, apparel and leather matters”, available at: www. ftc.gov/os/statutes/textilejump.shtm (accessed 20 June 2011). Veale, R. and Quester, P. (2009), “Do consumer expectations match experience? Predicting the influence of price and country of origin on perceptions of product quality”, International Business Review, Vol. 18, pp. 134-44. Wall, M. and Heslop, L. (1986), “Consumer attitudes toward Canadian-made versus imported products”, Journal of Academy of Marketing Sciences, Vol. 14, pp. 27-36. Wang, C. and Lamb, C. (1983), “The impact of selected environmental forces upon consumers’ willingness to buy foreign products”, Journal of Academy of Marketing Science, Vol. 11 No. 2, pp. 71-84. Zeithaml, V. (1988), “Consumer perceptions of price, quality and value: a means-end model and synthesis of evidence”, Journal of Marketing, Vol. 52, pp. 2-22. About the authors Jung Ha-Brookshire, PhD, is an Assistant Professor in the Department of Textile and Apparel Management at the
- 63. University of Missouri. Her research interests include global supply chain and sourcing strategies, sustainable production and consumption of textile and apparel, and firm/industry identity issues. Jung Ha-Brookshire is the corresponding author and can be contacted at: [email protected] So-Hyang Yoon, PhD, is a research fellow at the Center for Digital Globe in the School of Journalism, University of Missouri-Columbia. Her research interests include marketing communication, branding strategies, consumer behaviors in multicultural settings, participatory behaviors, and the roles of communication in social engagements. Country of origin factors influencing US consumers’ perceived price Jung Ha-Brookshire and So-Hyang Yoon Journal of Consumer Marketing Volume 29 · Number 6 · 2012 · 445–454 452 D ow nl oa
- 67. http://www.emeraldinsight.com/action/showLinks?crossref=10.1 007%2FBF02722154 Executive summary and implications for managers and executives This summary has been provided to allow managers and executives a rapid appreciation of the content of this article. Those with a particular interest in the topic covered may then read the article in toto to take advantage of the more comprehensive description of the research undertaken and its results to get the full benefits of the material present. Plenty evidence exists to show that consumer purchase decisions are significantly influenced by country-of-origin (COO) effects. Various studies have found that demographic characteristics and the level of economic development within the COO are especially significant. Of particular relevance is research indicating a more positive attitude towards foreign products among females, younger consumers and educated individuals earning high salaries. In comparison, males, older consumers and less educated, low earning people displayed a lower tendency to accept these products.
- 68. Many nations have become stereotyped and consumers typically rely on these images to evaluate products from certain countries. There is also a strong indication that people regard products as being of higher quality when they are manufactured in more economically advanced nations. COO research has likewise noted that domestic products are typically regarded as being superior to those manufactured abroad. For individuals with ethnocentric tendencies, this is likelier still. The notion of COO being a simple construct has traditionally prevailed. However, this is no longer the case because it has become the norm for many organizations to source materials and manufacture their products in different countries around the world. It is consequently feasible to regard many products as “hybrid or multinational” in nature. Nevertheless, the propensity remained in certain industries to use COO as a reference to where the product was made. This resulting lack of clarity prompted academics to clamor for a “multi-level COO” and has given rise to additional labels
- 69. that include country of design (COD), country of assembly (COA), country of parts (COP) and country of manufacture (COM). Use of multi-level COO definitions can impact on how consumers measure product quality, some academics have discovered. The assumption is that people are able to more accurately assess how different nations have contributed. However, in the US the issue is complicated by stipulations in certain industries that COO should refer to the COM or the country responsible for the “most significant assembly process”. The “Made in” label may not be fully informative and consumer decisions could well be different if they, for instance, know which country supplied the parts. Providing additional information is also likely to help those whose consumption is driven by a desire to behave in a socially responsible manner. Plenty research has identified that consumers frequently use price as a quality indicator. When knowledge of products is limited, this extrinsic cue becomes even more relevant.
- 70. Consumers invariably assume that positive correlation exists between price and quality levels. The relationship between price and the COO effect has in comparison received little attention. However, studies have found a willingness among US consumers to pay substantially more for product made in the US as opposed to the same goods manufactured in China. These and other studies producing similar findings addressed consumer willingness to pay rather than their perception of how much the products should cost. In this context, it is supposed that consumers who are unaware of the price may use brand name or COO information to determine their perceived price and to evaluate product quality. Prior knowledge in the shape of familiarity and expertise are used in a similar vein. According to different research sources, people with prior knowledge of new product attributes are more likely to use intrinsic cues to judge quality and value. A reliance of extrinsic cues is characteristic among consumers lacking familiarity or expertise.
- 71. Ha-Brookshire and Yoon address consumer perceived prices for common multinational products and aim to identify which factors influence their evaluations. Subjects were recruited through newspaper and university news media campaigns. Given the focus on clothing shopping activities, that 54 of the 77 participants were women did not surprise. Various ethnic groups were represented in the sample containing respondents aged between 18 and 69. Cotton shirts were selected for the research in which subjects were exposed to one of four COP-COM designs. The selection of China and the US for COP and COM was determined by their involvement in cotton manufacturing, apparel production and the import and export of the raw materials and products. Participants were exposed to cards depicting four types of cotton shirt with different combinations of COP and COM. They were asked to estimate the retail price of each one. The study considered a range of demographic variables along with familiarity and expertise. Familiarity was used in relation to
- 72. COO labeling regulations and to the concept of sustainability. In addition, subjects had to rank the cards in order based on levels of perceived sustainability and consider this while determining the retail price. The control card used stated that the shirt contained 100 percent cotton and was made in China. This reflected current COO laws and what customers see in the marketplace. The $40 price tag was deemed appropriate for this quality of product sold in the US. Analysis revealed that shirts: . Made in the US with US cotton had a mean perceived price of $56.9. perceived price was most influenced by income, perceived sustainability, gender and expertise. . Made in China with US cotton were on average perceived to cost $46.9. Variables which mainly impacted on perceived price were income, perceived sustainability and familiarity with COO labeling laws. . Made in the USA with Chinese cotton had an average perceived price of $46.1. Income and perceived sustainability were the most important factors. . Made in China using Chinese cotton had a mean
- 73. perceived price of $38.2. The main determinants of perceived price were age, familiarity with COO labeling laws and familiarity with the sustainability concept. Consumers seem to believe products made in China will cost more when the label identifies the US as the origin of the cotton used. When China is specified at the COP, the product is assumed to be cheaper. Therefore, companies should perhaps include COP information on labels when the country in question is associated with superior quality or design and Country of origin factors influencing US consumers’ perceived price Jung Ha-Brookshire and So-Hyang Yoon Journal of Consumer Marketing Volume 29 · Number 6 · 2012 · 445–454 453 D ow nl oa de
- 75. 2: 38 2 3 Se pt em be r 20 15 ( PT ) high price. The likelihood exists that consumer would value products more highly in such circumstances. Marketers are encouraged to educate consumers about the regulations which govern COO labeling. This can help in their promotion of US products, since individuals without knowledge of these regulations appear to rate goods made in China as being more sustainable. Targeting those high in
- 76. “self-efficacy” is recommended. Demographic variables were overall more influential than perceived sustainability on perceived price of product where the US was either or both COP or COM. A high income appears particularly significant. However, marketers face a challenge where lower earners are concerned. Ha-Brookshire and Yoon assume that purchase behavior among these consumers may not change on the basis of sustainability value alone. That perceived sustainability is higher for shirts made in the US with Chinese cotton is another potential dilemma. Since most cotton apparel sold in the US is manufactured in China using cotton from the US, companies face a difficult decision of what COO information to relay on clothing labels. Future research could identify reasons for the high perceived value of products made in the USA. Larger sample sizes and cross-cultural studies comparing domestic and foreign products are also suggested. (A précis of the article “Country of origin factors influencing US consumers’ perceived price for multinational products”. Supplied by Marketing Consultants for Emerald.) Country of origin factors influencing US consumers’ perceived price
- 77. Jung Ha-Brookshire and So-Hyang Yoon Journal of Consumer Marketing Volume 29 · Number 6 · 2012 · 445–454 454 To purchase reprints of this article please e-mail: [email protected] Or visit our web site for further details: www.emeraldinsight.com/reprints D ow nl oa de d by C al if or ni a St at
- 79. 15 ( PT ) This article has been cited by: 1. Gargi Bhaduri, Jung Ha-Brookshire. 2015. Gender differences in information processing and transparency: cases of apparel brands’ social responsibility claims. Journal of Product & Brand Management 24:5, 504-517. [Abstract] [Full Text] [PDF] 2. Subir Bandyopadhyay. 2015. Investigating Quality Perceptions of International Services by Chinese Consumers. Thunderbird International Business Review n/a-n/a. [CrossRef] D ow nl oa de d by C al if
- 81. pt em be r 20 15 ( PT ) http://dx.doi.org/10.1108/JPBM-08-2014-0683 http://www.emeraldinsight.com/doi/full/10.1108/JPBM-08- 2014-0683 http://www.emeraldinsight.com/doi/pdfplus/10.1108/JPBM-08- 2014-0683 http://dx.doi.org/10.1002/tie.21746 Industrial Management & Data Systems Strategic sourcing in the textile and apparel industry Jin Su Article information: To cite this document: Jin Su, (2013),"Strategic sourcing in the textile and apparel industry", Industrial Management & Data Systems, Vol. 113 Iss 1 pp. 23 - 38 Permanent link to this document: http://dx.doi.org/10.1108/02635571311289647
- 82. Downloaded on: 23 September 2015, At: 12:38 (PT) References: this document contains references to 37 other documents. To copy this document: [email protected] The fulltext of this document has been downloaded 2007 times since 2013* Users who downloaded this article also downloaded: Ruth K. Shelton, Kathy Wachter, (2005),"Effects of global sourcing on textiles and apparel", Journal of Fashion Marketing and Management: An International Journal, Vol. 9 Iss 3 pp. 318-329 http:// dx.doi.org/10.1108/13612020510610444 Jin Su, Vidyaranya B. Gargeya, (2012),"Strategic sourcing, sourcing capability and firm performance in the US textile and apparel industry", Strategic Outsourcing: An International Journal, Vol. 5 Iss 2 pp. 145-165 http://dx.doi.org/10.1108/17538291211257592 S. Gary Teng, Hector Jaramillo, (2005),"A model for evaluation and selection of suppliers in global textile and apparel supply chains", International Journal of Physical Distribution & Logistics Management, Vol. 35 Iss 7 pp. 503-523 http://dx.doi.org/10.1108/09600030510615824 Access to this document was granted through an Emerald subscription provided by emerald-srm:146575 [] For Authors If you would like to write for this, or any other Emerald publication, then please use our Emerald for Authors service information about how to choose which publication to write for and submission guidelines are available for all. Please visit www.emeraldinsight.com/authors for more information.
- 83. About Emerald www.emeraldinsight.com Emerald is a global publisher linking research and practice to the benefit of society. The company manages a portfolio of more than 290 journals and over 2,350 books and book series volumes, as well as providing an extensive range of online products and additional customer resources and services. Emerald is both COUNTER 4 and TRANSFER compliant. The organization is a partner of the Committee on Publication Ethics (COPE) and also works with Portico and the LOCKSS initiative for digital archive preservation. D ow nl oa de d by C al if or ni a S ta
- 85. r 20 15 ( P T ) http://dx.doi.org/10.1108/02635571311289647 *Related content and download information correct at time of download. D ow nl oa de d by C al if or ni a
- 87. m be r 20 15 ( P T ) Strategic sourcing in the textile and apparel industry Jin Su The Department of Human Development and Environmental Studies, Indiana University of Pennsylvania, Indiana, Pennsylvania, USA Abstract Purpose – The purpose of this paper is to investigate performance outcomes of strategic sourcing, specifically examining how strategic sourcing affects buyer- supplier relationship, supplier evaluation, and sourcing performance from the buying firm’s perspective in the context of the US textile and apparel industry. Design/methodology/approach – This study provides an
- 88. empirical investigation of a theory-based model integrating the resource-based view and the relational view of strategic management. The model is tested using data from 180 US textile and apparel firms by structural equation modeling. Findings – The survey results indicate that strategic sourcing significantly impacts buyer-supplier relationships, supplier evaluation, and sourcing performance of buying companies. The study also shows that supplier evaluation significantly influences buyer- supplier relationship. Research limitations/implications – Given that the data are from a specific industry, the generalizability of current findings to other industries may require additional investigation. Practical implications – Sourcing becomes a key strategic consideration for textile and apparel firms to sustain or improve their competitiveness. Originality/value – The study contributes to the literature by developing a research model based on a multi-theoretical perspective and conducting a large-scale empirical survey in the textile and apparel industry and analyzing the model by structural equation modeling. The dynamic textile and apparel industry is a classical representation of global supply chain, characterized by the industry’s significant contribution to the world economy and international trade, the extremely worldwide spread supply network, and the tremendous competition in global market. Examining strategic sourcing’s influences in this important industry provides many valuable implications for industrial practitioners.
- 89. Keywords United States of America, Textile industry, Buyers, Suppliers, Channel relationships, Sourcing, Buyer-supplier relationship, Performance, Strategic sourcing, Supplier evaluation, Textile and apparel Paper type Research paper 1. Introduction Strategic sourcing in the textile and apparel industry has received increasing attention over the last decade due to two important developments. First, textile and apparel firms have increasingly been competing in dynamic and complex world marketplace, considering continual changes and uncertainties in product availability, prices, and competition (MacCarthy and Jayarathne, 2012; Bruce and Daly, 2011; Kumar and Arbi, 2008; Åkesson et al., 2007). Second, the prominence of effectively managing global textile and apparel supply chain has increased. Business managers are thinking of new strategies and implementing new practices to increase firm performance. The textile and apparel industry is a classical representation of global supply chain, which is characterized by the significant contribution to world economy and international trade, the numerous steps and the diverse activities in the chain, the extremely worldwide spread supply network, the tremendous competition in global
- 90. The current issue and full text archive of this journal is available at www.emeraldinsight.com/0263-5577.htm Strategic sourcing 23 Received 25 May 2012 Revised 10 June 2012 15 June 2012 Accepted 16 June 2012 Industrial Management & Data Systems Vol. 113 No. 1, 2013 pp. 23-38 q Emerald Group Publishing Limited 0263-5577 DOI 10.1108/02635571311289647 D ow nl oa de d
- 92. 12 :3 8 23 S ep te m be r 20 15 ( P T ) market, the varying product and quality specifications being managed and the volatility of consumer preferences (MacCarthy and Jayarathne, 2012; Bruce and Daly, 2011; Abernathy et al., 2006). The textile and apparel industry not only includes industrial segments of fiber, fabric, and apparel production, but also consists of marketing, distribution, and retail operations of apparel and textile products. The nature of the textile
- 93. and apparel industry and the increased pressures from fickle consumers and uncertain business environment are making more and more firms to recognize the strategic role that sourcing can play in achieving sustainable competitive advantage (MacCarthy and Jayarathne, 2012; Bruce and Daly, 2011; Kumar and Arbi, 2008). One method of improving a firm’s competitiveness in managing the globally extended textile and apparel supply chain is through the strategic approaches to worldwide suppliers. Going far beyond cost considerations, sourcing decisions affect the production, marketing, distribution and financial strategies that a firm can put into effect. Top management in textile and apparel firms are developing and implementing more proactive sourcing strategies to deal with environmental changes, risks and uncertainties. The objective of this paper is to investigate the role of strategic sourcing in improving textile and apparel firms’ performance, specifically the effect of strategic sourcing on buying firm’s buyer-supplier relationship, supplier evaluation, and sourcing performance. In the following section, the relevant literature review is presented; then, the research conceptual framework and the hypotheses are developed. Subsequently, the research methodology is described, followed by the data analysis and results. The paper discusses the results and implications in Section 6. Finally, the paper provides conclusions and future study directions.
- 94. 2. Literature review This section presents the literature on the theoretical background of this study and the research constructs, specifically strategic sourcing, buyer- supplier relationship, and supplier evaluation. 2.1 Theoretical background Previous research suggests that strategic sourcing and buyer- supplier relationship are multifaceted phenomena that can only be explained by a multi- theoretical perspective. Terpend et al. (2008) advocate that future research needs to recognize the limitations of a single theoretical perspective and adopt a multidimensional view to explain how buyer practices and the influence of buyer-supplier mutual efforts. In reviewing the body of literature, we utilize multiple-theory studies, including specifically the resource-based view (RBV) and the relational view. 2.1.1 Resource-based view. The RBV theory (Barney, 1996; Wernerfelt, 1984) focuses on explaining how firm-specific resources and capabilities characterized by value, rareness, imitability, and non-substitutability form the basis of sustained competitive advantage. A firm’s resources include tangible and intangible assets and capabilities such as employment of skilled personnel, trade contacts, in- house knowledge of technology, efficient procedures, etc. (Barney, 1996; Wernerfelt, 1984). From a theoretical perspective, strategic sourcing is viewed by top management as an important resource
- 95. of a firm which can be utilized to create or develop the firm’s unique and inimitable resources and capabilities to maintain or increase the firm’s competitiveness (Dobrzykowski et al., 2010; Shook et al., 2009; Chen et al., 2004). IMDS 113,1 24 D ow nl oa de d by C al if or ni a S ta te
- 97. 20 15 ( P T ) 2.1.2 Relational view of strategic management. The increasing importance of strategic role of purchasing in supply chain management and the rapid growth of strategic buyer-supplier relationships across many industries has attracted a great deal of scholarly attention to recognize the issue of how relational competencies generate sustainable strategic advantage (Chen et al., 2004). Dyer and Singh (1998, p. 660) argue that “an increasingly important unit of analysis for understanding competitive advantage is the relationship between firms”. The relational view of strategic management argues that firms should view their ability to manage their inter-organizational relationships as a strategic resource for building strategic advantage (Cousins et al., 2008; Paulraj et al., 2008; Dyer and Singh, 1998). Relational view highlights the idea that inter-organizational relationships potentially provide a firm with access to key resources from its environment. Strategic sourcing requires a long-term orientation and may ultimately create collaborative
- 98. advantage and bring about greater benefits of collaborative advantage than a traditional non-strategic sourcing based approach to competition (Chen et al., 2004). 2.2 Strategic sourcing Previous literature addresses the need for sourcing to assume a more strategic role (Su and Gargeya, 2012; Kang et al., 2009; Paulraj and Chen, 2007; Gottfredson et al., 2005) in this age of ever-increasing world competition. Chan and Chin (2007) maintain that strategic sourcing has been increasingly recognized as an integral part of business strategies and practices. Carr and Pearson (2002) define strategic sourcing as the process of planning, evaluating, implementing, and controlling highly important sourcing decisions in an effort to meet a firm’s long-range plans and goals. Kocabasoglu and Suresh (2006) identify the four key elements of strategic sourcing: elevation of purchasing function to a strategic level, effective cross- functional communication and support within an organization, information sharing with key suppliers, and development of key suppliers. Chiang et al. (2012, p. 53) defines strategic purchasing as “a demonstration of the strategic role of purchasing in the firm’s long-term planning and this is posited to have a bearing on supply chain agility”. Incorporating previous literature and considering the purpose of this study, the theoretical construct of strategic sourcing in this research is conceptualized by being proactive as well as long-term focus,
- 99. having top management support, and strategically managing supplier relationships. 2.3 Buyer-supplier relationship In strategic sourcing, in order to manage suppliers as assets and integrate suppliers into the supply chain, buying firms need to make considerable effort to develop beneficial buyer-supplier relationship. Buying firms attempt to interact closely with their key supply partners to manage environmental uncertainties. The development of relationship-specific capabilities can lead to collaborative advantages for both supplier and buyer firms in the dynamic marketplace. There has been an impressive increase in the number of publications on buyer-supplier relationships over the past two decades (Miocevic and Crnjak- Karanovic, 2012; Terpend et al., 2008). Cousins et al. (2008, p. 238) argue that “close link between buyers and suppliers are increasingly cited as a critical differentiator of high and low performers in global supply chains”. Terpend et al. (2008) provide a comprehensive review of the studies of buyer-supplier relationships between 1986 and 2005. Terpend et al. (2008, p. 28) Strategic sourcing 25 D ow
- 101. dg e A t 12 :3 8 23 S ep te m be r 20 15 ( P T ) reveal that scholars have primarily investigated performance outcomes and value derived from buyer-supplier relationship and “researchers
- 102. considered more buyer-supplier mutual efforts since 1996 than the earlier decade”. Among the mechanisms used by both buyers and suppliers to increase the value derived from their relationships, communication, information sharing, and trust are three prominent contributors for successful buyer-supplier relationships (Terpend et al., 2008). 2.4 Supplier evaluation Since suppliers represent a critical resource to a firm, the perceptions of the buying organization regarding its suppliers’ current and expected performance affect the performance of the buying firm directly and indirectly. Supplier evaluation is a quantification process that is linked to not only the evaluating buyer company’s decision process, but also the evaluated supplying company’s behavior (Hald and Ellegaard, 2011). Supplier evaluation is a tool to communicate the buyer firm’s perceptions of supplier performance and capabilities (Prahinski and Fan, 2007). Buying organizations can utilize supplier evaluation for supplier selection, supply base reduction decisions, supplier development and benchmarking, and development of strong and collaborative relationship with a group of key preferred suppliers (Cormican and Cunningham, 2007; Prahinski and Fan, 2007). It is important for evaluating buying companies to have a formal program or system for evaluating and recognizing suppliers and tracking the
- 103. performance of the existing suppliers. Supplier evaluation program or system can be used as an effective way to quantify and communicate the measurements and targets to the supplier so that the supplier is made aware of the discrepancy between its current performance and the buying firm’s expectations (Modi and Mabert, 2007; Prahinski and Fan, 2007; Prahinski and Benton, 2004). Buying firms use formal supplier evaluation to communicate their perceptions of supplier’s strengths and weaknesses and expectations of supplier performance and capabilities to maintain capable and high performance supply bases (Modi and Mabert, 2007; Prahinski and Fan, 2007). 3. Conceptual framework and hypotheses 3.1 Linking strategic sourcing to buyer-supplier relationship Firms that consider sourcing to be strategic are likely to appreciate buyer-supplier cooperative relationships. In strategic sourcing, sourcing managers play a pivotal role in developing working relationship and effective communication with suppliers (Chiang et al., 2012; Kocabasoglu and Suresh, 2006; Chen et al., 2004). A collaborative buyer-supplier relationship is more desirable for the buying firm in the supply market which is full of uncertainty, risk, and turbulence. As an important resource of a firm, strategic sourcing drives the firm to access, acquire, or develop additional resources through buyer-supplier cooperation. According to this line of reasoning, the following hypothesis is developed:
- 104. H1. Strategic sourcing has a positive impact on buyer-supplier relationship. 3.2 Linking strategic sourcing to supplier evaluation Strategic sourcing recognizes the important role that suppliers play in the buying firm’s sourcing decision making (Chiang et al., 2012; Kocabasoglu and Suresh, 2006). Strategic sourcing helps the firm to identify the most appropriate supply base for its IMDS 113,1 26 D ow nl oa de d by C al if or ni a
- 106. m be r 20 15 ( P T ) needs in today’s dynamic global market (Chiang et al., 2012). Measuring supplier performance is an important result of strategic sourcing decision. Decisions regarding the sourcing requirements and sourcing strategy will define the set of suppliers for initial consideration. The supplier evaluation then becomes a matter of highly rigorous assessment of potential supplier candidates. Strategic sourcing influences how the buying firms identify their key suppliers and how the supplier evaluation programs are designed, implemented, and used. Thus, the following hypothesis is proposed: H2. Strategic sourcing has a positive impact on supplier evaluation. 3.3 Linking supplier evaluation to buyer-supplier relationship One of the largest resources for a company is its supply base.
- 107. Strategically managing suppliers from evaluating, recognizing, and tracking suppliers through supplier certification provides information about the buying firm’s perceptions regarding the supplier’s performance, which in turn will influence the supplier’s commitment to the buying firm and the buying firm’s effort in supplier development program (Prahinski and Fan, 2007; Prahinski and Benton, 2004). Supplier evaluation is an effective communication strategy that a buyer undertakes to improve a supplier’s performance and/or capabilities to meet the buyer’s short- or long-term supply needs. The practice of supplier evaluation is aimed at improving communication between buyers and suppliers and strengthening the buying firm’s relationships with key suppliers so that risk of opportunistic behavior is limited. Therefore, the following hypothesis is formally stated: H3. Supplier evaluation has a positive impact on buyer-supplier relationship. 3.4 Linking buyer-supplier relationship to sourcing performance The value of buyer-supplier relationship is well documented in the supply chain literature. The RBV and the relational view of strategic management explain value extraction in buyer-supplier relationships (Terpend et al., 2008). Strong relationship with suppliers benefits the buying firm in the long run, fostering an environment of mutual support, improving flexibility and responsiveness among supply
- 108. chain partners, and providing value to the ultimate customer (Miocevic and Crnjak- Karanovic, 2012; Terpend et al., 2008; Paulraj and Chen, 2007). Better information sharing and higher levels of collaborative communication between a firm and its suppliers can increase both buyer and supplier performance (Paulraj et al., 2008) due to increased operational efficiency and better coordination from both buyer and supplier firms. Therefore, this leads to the following hypothesis: H4. Buyer-supplier relationship has a positive impact on sourcing performance. 3.5 Linking supplier evaluation to sourcing performance Measuring supplier performance is an important approach to modifying a buyer firm’s managerial behavior, and aligning the relationship with the strategic and operational goals of the buyer firm (Cousins et al., 2008). Based on RBV, it is apparent that supplier’s capability, skills, and technologies can be an inimitable resource that has a significant impact on business performance. Supplier evaluation will help change supplier behavior which is aligned with the evaluating company’s interests and improve supplier capabilities and performance; furthermore this in turn will benefit the Strategic sourcing 27
- 111. evaluating buyer firm (Prahinski and Benton, 2004). Therefore, based on this logic, we propose the following hypothesis: H5. Supplier evaluation has a positive impact on sourcing performance. 3.6 Linking strategic sourcing to sourcing performance Chen et al. (2004) demonstrate robust support for the links between strategic purchasing, customer responsiveness, and financial performance of the buying firm. Paulraj and Chen (2007) provide empirical support that there is a positive link between environmental uncertainties and strategic supply management initiatives (strategic sourcing is a key ingredient of strategic supply management), and their findings further support the link between strategic supply management and buyer performance. Chiang et al. (2012) find that strategic sourcing is significantly related to the firm’s supply chain agility. Following the preceding discussion, we expect the following hypothesis: H6. Strategic sourcing has a positive impact on sourcing performance. 3.7 Conceptual model Grounded on the RBV and the relational view, the research conceptual model was developed based on the linkages between strategic sourcing, buyer-supplier relationship, supplier evaluation, and sourcing performance. The theoretical model postulated is shown in Figure 1, which includes the above six
- 112. hypotheses. 4. Methodology 4.1 Research design A survey instrument was used to collect the data and test the proposed hypotheses. The items tapping the theoretical constructs were developed based on an extensive Figure 1. Model integrating the structural and measurement models – SEM representation H6 H5 H4 H3 H2 H1 E8 E13 E12 E11 E1
- 113. Strategic Sourcing V1 V2E2 E3 V9 V10 E9 E10 E4 E5 E6 E7 V3 V4 V5 V6 V7 V8 V11 V12 V13 Buyer- Supplier Relationship Supplier Evaluation Sourcing
- 116. T ) literature review of the managerial and scholarly literature to establish the content validity of each construct and associated scales. Feedback on the initial design was then obtained from academics familiar with empirical research in study domain and senior managers. A revised survey instrument was finally pre-tested by nine purchasing managers for content validity. Where necessary, questions were reworded to improve validity and clarity. Our discussions with academic and industrial professionals strengthened the fact that the choice of the indicators adequately measured each construct. To increase measurement accuracy, multiple indicators were used for each latent variable considered (Raykov and Marcoulides, 2000) and existing scales were employed where possible. A five-point Likert scale was used with “1 – strongly disagree” and “5 – strongly agree”. The three items that measure strategic sourcing were developed by referring to Carr and Pearson (2002). They capture the key concept of strategic sourcing including strategic orientation, relationship development with key suppliers, and top management support. The four items of buyer-supplier relationship construct was adopted from Carr and Pearson (1999) including buyer-
- 117. supplier loyalty, frequent face-to-face communications with key suppliers, high corporate level communication on important issues with key suppliers, and the buyer’s influence on key supplier’s responsiveness. The measure of supplier evaluation was adopted from Carr and Pearson (1999). The three items in the construct include formal supplier certification program, formal system to track the performance of the suppliers, and formal program for evaluating and recognizing suppliers. The three items measuring sourcing performance were developed from discussion with industrial managers and literature review, focusing on contributions of sourcing to the overall success of the firm and to the firm’s bottom-line profit, and sourcing’s value-creating outcomes. 4.2 Data collection Dillman’s (2000) “tailored survey methodology” was followed for data collection from a random sample of 660 firms in the US textile and apparel industry in order to increase the response rate. All the recipients of the survey were selected carefully and were believed to be the most knowledgeable about sourcing of textile or apparel products for their companies with titles such as purchasing/sourcing manager, buyer, etc. The cover letter of the survey also stated: If you feel that you are not the most qualified individual at your company to fill out the survey, please forward this to that person and encourage him or
- 118. her to complete the survey. To ensure that the most appropriate professionals fill out the survey. Multiple contacts by mail, e-mail and follow-up phone calls were implemented for each firm during data collection. A thank you e-mail message or a thank you letter was sent to every company who returned their survey. During the data collection, 21 firms reported that they were not in the textile and apparel industry any more. Finally, a total of 181 questionnaires were returned by mail, e-mail or fax, representing 28.3 percent response rate. 180 were usable responses for examining the relationships in the research model. 5. Analysis and results A comparison was made between the respondents who responded immediately with those who responded after follow-up steps were implemented to examine non-response bias. t-tests were performed on the items included in the research model. No statistically Strategic sourcing 29 D ow nl oa
- 120. A t 12 :3 8 23 S ep te m be r 20 15 ( P T ) significant differences were found among the early and late respondents, indicating that non-response bias was not a problem in this study. To investigate the relationships in the conceptual model, structural equation modeling (SEM) analysis based on the maximum likelihood estimation method was
- 121. carried out using LISREL 8.8. 5.1 Descriptive statistics Table I presents a summary of the descriptive statistics of the respondents. About 45.3 and 54.7 percent of the respondents were from the textile industry and the apparel industry, respectively. About 49.2 percent of the responding firms had annual gross sales less than $100 million, about 27.6 percent had annual gross sales $100-$500 million, and about 14.4 percent had annual gross sales over $500 million. 5.2 The measurement model Table II provides the correlation matrix and the descriptive statistics of the variables in the measurement model. Evaluation of the measurement model was conducted using confirmatory factor analysis to examine the relationships between the indicator variables and their respective underlying factors. Table III shows the fit indexes used in assessing measurement model fit. A satisfactory fit is achieved for the measurement Characteristics Frequency Percentage Industrial sector Textile industry 82 45.3 Apparel production 66 36.5 Apparel retailer/wholesaler/distributor 33 18.2 Geographic areas distribution (top eight states) North Carolina 55 30.4 California 26 14.4 Georgia 18 9.9
- 122. Pennsylvania 10 5.5 South Carolina 9 5.0 Ohio 9 5.0 New York 8 4.4 Massachusetts 8 4.4 Number of employees Less than 100 28 15.5 100-249 39 21.5 250-499 29 16.0 500-1,000 32 17.7 Over 1,000 51 28.2 Missing 2 1.1 Annual gross sales (US$) Less than 5 million 13 7.2 8-24.9 million 31 17.1 25-49.9 million 19 10.5 50-99.9 million 26 14.4 100-500 million 50 27.6 Over 500 million 26 14.4 Missing 16 8.8 Note: Total respondents n ¼ 181 Table I. Descriptive statistics of the respondent firms IMDS 113,1 30 D ow nl