SOC391/FAS361: Research Methods
PROJECT PIECE #2:
WRITING A LITERATURE REVIEW
OVERVIEW
A literature review is a formal way of gathering relevant and trustworthy information
about a topic of interest. In APA-formatted research papers, the literature review is
often incorporated into the introduction. It serves to introduce your reader to your
topic, convey your research question, justify the need and relevance of your topic, and
present your hypotheses.
A key part of a literature review is synthesizing information (not just presenting the
information)! This concept might be foreign to many students (and difficult to grasp at
first), but it is something that will help you be better able to seek out information from
multiple sources and then present it in an organized way to convey your goal or
purpose (again, something that will likely be needed for a future job or research). Be
sure to review the video and posted resources on the Blackboard course site for a more
detailed discussion of a literature review!
INSTRUCTIONS
1. This project piece will center on the research question that you selected in
Project Piece 1. For your remaining project pieces (and your final project), you
will work on developing, investigating, and writing about this topic.
2. Carefully review the information about finding sources and creating literature
reviews on Blackboard.
3. Conduct a review of the literature on your selected topic. Become familiar with
research available on your topic and variables of interest (outcome and
predictor variables).
a. You will want to focus your search on materials that are appropriate for
an academic paper, including journal articles and books. (Review
distinguishing scholarly articles and other types of information and how to
search for scholarly articles on Blackboard). As discussed in the literature
reviews lecture, searching through materials is often a two-step process.
At the beginning of your research process, you will likely gather more
information and references than you will include in your final paper!
Cutting down these sources and integrating/synthesizing them for your
paper will be a very important step!
4. Once you have reviewed the literature, develop a hypothesis! Do you think both
independent variables will be related to your dependent variable? Or just one?
What direction do you think those relationships will be? Review pages 56-59 of
SOC391/FAS361: Research Methods
your textbook for more information on how to construct a hypothesis. You will
integrate this hypothesis into your literature review, but it can be helpful to think
about what you expect before you write your literature review!
5. Write a 3-4 page literature review in APA 6 format (size 10-12 Times New Roman
font with 1-inch margins) that introduces your topic, describes what research has
been done on your outcome variable, discusses what research ha.
Russian Escort Service in Delhi 11k Hotel Foreigner Russian Call Girls in Delhi
SOC391FAS361 Research Methods PROJECT PIECE #2 WRI.docx
1. SOC391/FAS361: Research Methods
PROJECT PIECE #2:
WRITING A LITERATURE REVIEW
OVERVIEW
A literature review is a formal way of gathering relevant and
trustworthy information
about a topic of interest. In APA-formatted research papers, the
literature review is
often incorporated into the introduction. It serves to introduce
your reader to your
topic, convey your research question, justify the need and
relevance of your topic, and
present your hypotheses.
A key part of a literature review is synthesizing information
(not just presenting the
information)! This concept might be foreign to many students
(and difficult to grasp at
first), but it is something that will help you be better able to
seek out information from
multiple sources and then present it in an organized way to
2. convey your goal or
purpose (again, something that will likely be needed for a future
job or research). Be
sure to review the video and posted resources on the Blackboard
course site for a more
detailed discussion of a literature review!
INSTRUCTIONS
1. This project piece will center on the research question that
you selected in
Project Piece 1. For your remaining project pieces (and your
final project), you
will work on developing, investigating, and writing about this
topic.
2. Carefully review the information about finding sources and
creating literature
reviews on Blackboard.
3. Conduct a review of the literature on your selected topic.
Become familiar with
research available on your topic and variables of interest
(outcome and
predictor variables).
a. You will want to focus your search on materials that are
appropriate for
3. an academic paper, including journal articles and books.
(Review
distinguishing scholarly articles and other types of information
and how to
search for scholarly articles on Blackboard). As discussed in
the literature
reviews lecture, searching through materials is often a two-step
process.
At the beginning of your research process, you will likely
gather more
information and references than you will include in your final
paper!
Cutting down these sources and integrating/synthesizing them
for your
paper will be a very important step!
4. Once you have reviewed the literature, develop a hypothesis!
Do you think both
independent variables will be related to your dependent
variable? Or just one?
What direction do you think those relationships will be?
Review pages 56-59 of
SOC391/FAS361: Research Methods
4. your textbook for more information on how to construct a
hypothesis. You will
integrate this hypothesis into your literature review, but it can
be helpful to think
about what you expect before you write your literature review!
5. Write a 3-4 page literature review in APA 6 format (size 10-
12 Times New Roman
font with 1-inch margins) that introduces your topic, describes
what research has
been done on your outcome variable, discusses what research
has found with
regards to how your predictor variables may influence the
outcome variable,
and presents your study hypothesis. You must integrate AT
LEAST FIVE scholarly
sources. This should naturally flow in paragraph form. Be
careful not to “stack
abstracts”! Include your hypothesis toward the end of your
literature review (be
sure to watch the literature review lecture for more information
on how to
structure a lit review!).
6. Include a cover page (1 page) with title of your paper, name,
5. and running
head. Format the first page of your literature review as if you
were writing an
introduction, which means you should include a title at the top
of the page. Be
sure to include a final paragraph that introduces the reader to
YOUR
hypotheses/research questions!
7. Provide a references page in APA format. An abstract is
NOT required at this
time. Your cover page and references page are not included in
the 3-4 page
requirement.
USEFUL TIPS
MATION IN
YOUR OWN WORDS!
organize your literature
review.
offering your opinion.
be
unable to do a truly
6. comprehensive literature review, but you can do your best to
present the most
relevant information (in a synthesized form) within the page
limit. This means that
every reference counts! Be picky, find the best references to fit
your topic!
Sage Publications, Inc. and American Educational Research
Association are collaborating with JSTOR to digitize, preserve
and extend access to Educational Researcher.
http://www.jstor.org
Measuring Learning Outcomes in Higher Education: Motivation
Matters
Author(s): Ou Lydia Liu, Brent Bridgeman and Rachel M. Adler
Source: Educational Researcher, Vol. 41, No. 9 (DECEMBER
2012), pp. 352-362
Published by: American Educational Research Association
Stable URL: http://www.jstor.org/stable/23360359
Accessed: 22-01-2016 19:20 UTC
REFERENCES
Linked references are available on JSTOR for this article:
http://www.jstor.org/stable/23360359?seq=1&cid=pdf-
reference#references_tab_contents
7. You may need to log in to JSTOR to access the linked
references.
Your use of the JSTOR archive indicates your acceptance of the
Terms & Conditions of Use, available at
http://www.jstor.org/page/
info/about/policies/terms.jsp
JSTOR is a not-for-profit service that helps scholars,
researchers, and students discover, use, and build upon a wide
range of content
in a trusted digital archive. We use information technology and
tools to increase productivity and facilitate new forms of
scholarship.
For more information about JSTOR, please contact
[email protected]
This content downloaded from 129.219.247.33 on Fri, 22 Jan
2016 19:20:39 UTC
All use subject to JSTOR Terms and Conditions
http://www.jstor.org
http://www.jstor.org/publisher/aera
http://www.jstor.org/stable/23360359
http://www.jstor.org/stable/23360359?seq=1&cid=pdf-
reference#references_tab_contents
http://www.jstor.org/page/info/about/policies/terms.jsp
http://www.jstor.org/page/info/about/policies/terms.jsp
http://www.jstor.org/page/info/about/policies/terms.jsp
Feature Articles
Measuring Learning Outcomes in Higher Education:
Motivation Matters
Ou Lydia Liu1, Brent Bridgeman1, and Rachel M. Adler1
8. With the pressing need for accountability in higher education,
stan
dardized outcomes assessments have been widely used to
evaluate
learning and inform policy. However, the critical question on
how
scores are influenced by students' motivation has been
insufficiently
addressed. Using random assignment, we administered a
multiple
choice test and an essay across three motivational conditions.
Students' self-report motivation was also collected. Motivation
sig
nificantly predicted test scores. A substantial performance gap
emerged between students in different motivational conditions
(effect size as large as .68). Depending on the test format and
condi
tion, conclusions about college learning gain (i.e., value added)
varied
dramatically from substantial gain (d
=
0.72) to negative gain (d
=
9. -0.23).The findings have significant implications for higher
education
stakeholders at many levels.
Keywords: accountability; assessment; higher education; moti
vation; outcomes assessment; regression analyses
Accountability
and learning outcomes have received
unprecedented attention in U.S. higher education over
the past 5 years. Policymakers call for transparent dem
onstration of college learning (U.S. Department of Education,
2006). Accrediting associations have raised expectations for
insti
tutions to collect evidence of student learning outcomes and use
such information for institutional improvement. For instance,
the Council for Higher Education Accreditation (CHEA), the
primary organization for voluntary accreditation and quality
assurance to the U.S. Congress and Department of Education,
has focused on the role of accreditation in student achievement
by establishing the CHEA Award for Outstanding Institutional
10. Practice in Student Learning Outcomes (http://www.chea.org/
chea%20award/CA_2011.02-B.html). Various accountability
initiatives press higher education institutions to provide data on
academic learning and growth (Liu, 201 la; Voluntary System of
Accountability, 2008). Facing mounting pressure, institutions
turn to standardized outcomes assessment to fulfill accountabil
ity, accreditation, and strategic planning requirements.
Outcomes
assessment provides a direct measure of students' academic
ability
and is considered a powerful tool to evaluate institutional
impact
352 EDUCATIONAL RESEARCHER
on students (Kuh, Kinzie, Buckley, Bridges, & Hayek, 2006).
Research on outcomes assessment has generated strong interest
from institutional leaders, state officials, and policymakers.
Based
on outcomes assessment data, researchers are making
conclusions
about the current state of U.S. higher education and are offering
policy recommendations (e.g., Arum & Roksa, 2011). However,
11. a frequently discussed yet insufficiently researched topic is the
role of students' performance motivation when taking low-
stakes
outcomes assessments. Although highly relevant to institutions,
the test scores usually have no meaningful consequence for indi
vidual students. Students' lack of motivation to perform well on
the tests could seriously threaten the validity of the test scores
and
bring decisions based on the scores into question. The current
study is intended to contribute to the understanding of how
motivation may affect outcomes assessment scores and, in par
ticular, affect conclusions about U.S. higher education based on
outcomes assessment results. The study also suggests practical
ways to increase test takers' motivation on higher performance
on
low-stakes tests.
Outcomes Assessment in Higher Education
A systematic scrutiny of U.S. higher education was marked
by the establishment of the Spellings Commission in 2005.
The Commission lamented the remarkable lack of accountability
12. mechanisms to ensure college success and the lack of
transparent
data that allow direct comparison of institutions (U.S. Depart
ment of Education, 2006). As a result, several accountability ini
tiatives (e.g., Voluntary System of Accountability [VSA],
Transparency by Design, Voluntary Framework of
Accountability)
were launched by leading educational organizations
representing
different segments of U.S. higher education (e.g., public institu
tions, for-profit institutions, community colleges). A core com
ponent of these accountability initiatives is the requirement that
participating institutions provide evidence of student learning
that is scalable and comparable. Take the VSA as an example:
Among other requirements, it asks institutions to use one of
three
nationally normed measures (ETS® Proficiency Profile,1
Collegiate Learning Assessment [CLA], or Collegiate
Assessment
of Academic Proficiency) to report college learning (VSA,
2008).
Both criticized and acclaimed, outcomes assessment has been
14. is an emerging line of research focusing on the interpretation of
college learning using outcomes assessment data (Liu, 2008),
identifying proper statistical methods in estimating learning
gain,
or value-added (Liu, 201 lb; Steedle, 2011), and comparing find
ings from outcomes assessments of different contents and for
mats (Klein et al., 2009).
Among recent research on outcomes assessment, a most note
worthy finding came from the book Academically Adrift (Arum
& Roksa, 2011). The authors claimed that CLA data indicated
that students gained very little academically from their college
experience. By tracking the CLA performance of a group of
fresh
men to the end of their sophomore year, the authors found that
on average, students made only a 7 percentile point gain (.18 in
effect size) over the course of three college semesters. More
than
45% of the students failed to make any progress as measured by
the CLA. In addition, the performance gap tended to increase
between racial/ethnic minority students and White students. The
15. findings attracted wide attention from researchers and policy
makers and were frequently cited when U.S. students' minimal
college learning was mentioned (Ochoa, 2011). However, this
study was not accepted without criticism. Astin (2011) provided
a substantial critique of this study, questioning its conclusion of
limited college learning based on several major drawbacks: lack
of basic data report, making conclusions about individual stu
dents without student-level score reliabilities, unsound
statistical
methods for determining improvement, and incorrect interpreta
tion of Type I and Type II errors. What Astin didn't mention
was
the study's failure to consider the role of motivation when stu
dents took the CLA. Prior research found that the year-to-year
consistency in institutional value-added scores was fairly low
(0.18 and 0.55 between two statistical methods) when the CLA
was used (Steedle, 2011). It seems likely that motivation may
play a significant role in the large inconsistency in institutional
rankings.
16. Research on Test-Taking Motivation
Students' motivation in taking low-stakes tests has long been a
source of concern. In the context of outcomes assessment in
higher education, institutions differ greatly in how they recruit
students for taking the assessments. Some institutions set up spe
cific assessment days and mandate students to take the test.
Other
institutions offer a range of incentives to students (e.g., cash
rewards, gift certificates, and campus copy cards) in exchange
for
participation. However, because the test results have little
impact
on students' academic standing or graduation, students' lack of
motivation to perform well on the tests could pose a serious
threat to the validity of the test scores and the interpretation
accuracy of the test results (Banta, 2008; Haladyna & Downing,
2004; Liu, 201 lb; S. L. Wise & DeMars, 2005, 2010; V. L.
Wise,
Wise, & Bhola, 2006).
A useful theoretical basis for evaluating student test taking
motivation is the expectancy-value model (Pintrich & Schunk,
17. 2002). In this model, expectancy refers to students' beliefs that
they can successfully complete a particular task and value refers
to the belief that it is important to complete the task. Based on
this theoretical model, researchers have developed self-report
surveys to measure student motivation in taking low-stakes
tests.
For example, the Student Opinion Survey (SOS; Sundre, 1997,
1999; Sundre & Wise, 2003) is one of the widely used surveys
that capture students' reported effort and their perception of the
importance of the test. A general conclusion from studies inves
tigating the relationship between student motivation and test
performance is that highly motivated students tend to perform
better than less motivated students (Cole & Osterlind, 2008;
O'Neil, Sugrue, & Baker, 1995/1996; Sundre, 1999; S. L. Wise
& DeMars, 2005; V. L. Wise et al., 2006). A meta-analysis of
12
studies consisting of 25 effect size statistics showed that the
mean performance difference between motivated and unmoti
vated students could be as large as .59 standard deviations (S.
18. L.
Wise & DeMars, 2005). Besides relying on student self-report,
researchers have also examined response time effort (RTE)
for computer-based, unspeeded tests to determine student
motivation (S. L. Wise & DeMars, 2006; S. L. Wise & Kong,
2005). Results show that RTE is significantly correlated with
student self-reported motivation, but not with measures of
student ability, and is also a significant predictor of their test
performance.
To eliminate the impact of low performance motivation on
test results, researchers have explored ways to filter responses
from unmotivated students identified through either their self
report or response time effort (S. L. Wise & DeMars, 2005,
2006; S. L. Wise & Kong, 2005; V. L. Wise et al., 2006). The
findings are consistent; after controlling for students' general
ability (e.g., SAT scores), motivation filtering helps improve
the
validity of the inferences based on the test results (S. L. Wise &
DeMars, 2005, 2010; V. L. Wise et al., 2006; Wolf & Smith,
19. 1995).
Realizing the important impact of motivation on test results,
researchers have explored ways to enhance student motivation
to
maximize their effort in taking low-stakes tests. Common prac
tices include increasing the stakes of the tests by telling
students
that their scores contribute to their course grades (Sundre, 1999;
Wolf & Smith, 1995), providing extra monetary compensation
for higher performance (Baumert & Demmrich, 2001; Braun,
Kirsch, & Yamamoto, 2011 ; Duckworth, Quinn, Lynam,
Loeber,
& Stouthamer-Loeber, 2011; O'Neil, Abedi, Miyoshi, &
Mastergeorge, 2005; O'Neil et al., 1995/1996), and providing
feedback after the test (Baumert & Demmrich, 2001; Wise,
2004). Increasing the stakes and providing extra payment for
per
formance have been shown to be effective ways to motivate stu
dents (Duckworth etal., 2011; O'Neil et al., 1995/1996; Sundre,
1999). For instance, through a meta-analysis of random assign
20. ment experiments, the Duckworth et al. (2011) study found that
monetary incentives increased test scores by an average of .64
standard deviations. Despite the intuitive appeal of providing
feedback, it does not appear to have an impact on either student
motivation or their test performance (Baumert & Demmrich,
2001; V.L. Wise, 2004).
DECEMBER 2012 353
This content downloaded from 129.219.247.33 on Fri, 22 Jan
2016 19:20:39 UTC
All use subject to JSTOR Terms and Conditions
http://www.jstor.org/page/info/about/policies/terms.jsp
Table 1
Descriptive Statistics by Institution
Test Scores3 College CPA
N Female (%) M SD Part-time (%) Language1" (%) White (%)
M SD
Rl 340 54 1,213 154 2 72 74 3.16 .81
Ml 299 63 1,263 145 1 73 81 3.33 .52
CC 118 59 168 30 24 76 48 3.21 .61
Note. RI = research university; Ml = master's university; CC =
community college.
21. aThe numbers represent composite SAT scores or converted
ACT scores for the research and master's institutions and
composite placement test scores
(reading and writing) for the community college.
bEnglish as better language.
Rationale and Research Questions
Although motivation on low-stakes tests has been studied in
higher education, there is a compelling need for such a study for
widely used standardized outcomes assessment. Prior studies
that
experimentally manipulated motivational instructions examined
locally developed assessments that were content-based tests in
specific academic courses as opposed to large-scale
standardized
tests (Sundre, 1999; Sundre & Kitsantas, 2004; Wolf &C Smith,
1995). It is unclear whether conclusions drawn from these
course-based assessments can be extended to widely used stan
dardized tests used for outcomes assessments. The distinction
between these two types of examinations is critical because of
the
types of motivational instructions that are feasible differ by test
22. type. In a course-based test, the instruction that the score will
contribute to the course grade is believable. But for a general
reasoning test of the type used for value-added assessments in
higher education, an instruction indicating that the score would
contribute to the grade in a specific course would not be plausi
ble. In addition, most previous studies relied on data from a
single program or single institution (Sundre & Kitsantas, 2004;
S. L. Wise & Kong, 2005; V. L. Wise et al., 2006; Wolf &
Smith,
1995), which may limit the generalizability of the findings.
Furthermore, most previous studies either used self-report or
item response time to determine examinees' motivation and use
that information to investigate the relationship between motiva
tion and performance. Very few studies created motivational
manipulation to understand the magnitude of effect motivation
may have on test scores.
By creating three motivational conditions that were plausible
for a general reasoning test, we addressed three research
questions
23. in this study: What is the relationship between students' self
report motivation and test scores? Do motivational instructions
affect student motivation and performance? Do conclusions
drawn about college learning gain change with test format (i.e.,
multiple choice vs. essay) and motivational instruction?
Existing literature has addressed some discrete aspects of these
questions, but no study has provided a complete answer to all of
these questions for a large-scale standardized outcomes assess
ment. In sum, this study is unique on three aspects; (1) a focus
on a large-scale general reasoning assessment, (2) the inclusion
of
multiple institutions in data collection, and (3) the creation of
plausible motivational conditions with random assignment.
Methods
Participants
A total of 757 students were recruited from three higher educa
tion institutions (one research institution, one master's institu
tion, and one community college) in three states. See Table 1
for
24. participants' demographic information. The student profiles
were similar between the research and master's institutions. The
community college had a significantly larger percentage of part
time and non-White students than the two 4-year institutions.
Participants were paid $50 to complete the tests and the survey.
We obtained information from each institution's registrar's
office
on the percentage of females, ethnic composition, and mean
admission/placement test scores; the volunteer participants were
representative of their home institutions in terms of gender, eth
nicity, and admission/placement test scores.
Since first-year students may be more intimidated (and there
fore more motivated) by taking even a low-stakes test, we
recruited only students with at least 1 year of college
experience
at the 4-year institutions and students who had taken at least
three courses at the community college.
Instruments
We administered the ETS Proficiency Profile, including the
25. optional essay, to the 757 college students. The Proficiency
Profile
measures college-level skills in critical thinking, reading,
writing,
and mathematics and has been used by over 500 institutions as
an
outcomes assessment for the past 5 years. The reliabilities for
the subscales are over .78 for student-level data and over .90 for
institution-level data (Klein et al., 2009). Abundant research has
been conducted examining the test's construct validity, content
validity, predictive validity, and external validity (Belcheir,
2002;
Hendel, 1991; Klein et al., 2009; Lakin, Elliott, & Liu, in press;
Liu, 2008; Livingston & Antal, 2010; Marr, 1995). Students
with
higher Proficiency Profile scores tend to have gained more
course
credits (Lakin et al., in press; Marr, 1995). Students'
Proficiency
Profile performance is consistent with the skill requirements of
their major fields of study, with humanities majors scoring
higher
than other students on critical thinking and writing and mathe
26. matics and engineering students scoring higher on mathematics
(Marr, 1995). Proficiency Profile scores are also highly
correlated
with scores from tests that measure similar constructs (Hendel,
1991; Klein et al., 2009). In addition, the Proficiency Profile is
354 EDUCATIONAL RESEARCHER
This content downloaded from 129.219.247.33 on Fri, 22 Jan
2016 19:20:39 UTC
All use subject to JSTOR Terms and Conditions
http://www.jstor.org/page/info/about/policies/terms.jsp
able to detect performance differences between freshmen and
seniors after controlling for college admission scores (e.g.,
SAT)
(Liu, 2011 b). Although researchers have examined various
aspects
of validity for the Proficiency Profile, one less explored aspect
is
how the test scores predict post-college performance in various
academic, workforce, and community settings. Such evidence is
also scarce for other types of outcomes assessment. The only
study
27. that we are aware of is the follow-up study to Arum and Roksa's
(2011) study, which we discuss at the end of the article under
"A
Cautionary Note."
There are two versions of the Proficiency Profile, a 108-item
test intended to yield valid scores at the individual student level
and a 36-item short form intended primarily for group-level
score reporting (ETS, 2010). Because of the limited amount of
testing time, we used the short form, which can be completed in
40 minutes.
An essay, which measures college-level writing ability, is an
optional part of the Proficiency Profile. The essay prompt asks
students to demonstrate their writing ability by arguing for or
against a point of view. For example, the prompt may provide
one
point of view and solicit students' opinions about it. Students
are
asked to support their position with justifications and specific
reasons from their own experiences and observations. It took
the
28. students about 30 minutes to complete the essay. In each testing
session, students took the online version of the Proficiency
Profile
and the essay with a proctor monitoring the testing room.
After completing the tests, students filled out the SOS by
hand (Sundre, 1997, 1999; Sundre & Wise, 2003). The SOS is
a 10-item survey that measures students' motivation in test tak
ing. The survey has been widely used in contexts of outcomes
assessment similar to this study.
Following the test administration, undergraduate admission
test scores were obtained for the students at the research and
mas
ter's institutions, and placement test scores were obtained for
the
students from the community college. All test scores were
obtained from the registrars' offices.
Experimental Conditions
To address the three research questions described in the
introduc
tion, we designed an experiment with three motivational condi
29. tions, represented by three different consent forms. Within each
testing session, students were randomly assigned to conditions
before they took the tests. The consent forms were identical for
the three conditions, except that the following instructions were
altered based on the different motivational conditions:
Control condition: Your answers on the tests and the survey will
be
used only for research purposes and will not be disclosed to any
one except the research team.
Personal condition: Your answers on the tests and the survey
will
be used only for research purposes and will not be disclosed to
anyone except the research team. However, your test scores may
be released to faculty in your college or to potential employers
to
evaluate your academic ability.
Institutional condition: Your answers on the tests and the survey
will be used only for research purposes and will not be
disclosed
to anyone except the research team. However, your test scores
will
be averaged with all other students taking the test at your
college.
30. Only this average will be reported to your college. This average
may be used by employers and others to evaluate the quality of
instruction at your college. This may affect how your institution
is viewed and therefore affect the value of your diploma.
The three instructions were highlighted in bold red letters so
students would likely notice them before giving their consent.
After the data collection was completed, students in the treat
ment conditions were debriefed that their test scores would not
be shared with anyone outside of the research team. Among the
three conditions, we expected the personal condition to have the
strongest effect on students' motivation and performance as it is
associated with the highest stakes for individual students. We
also
expected the institutional condition to have some impact on stu
dents' motivation and performance as maintaining their institu
tion's reputation could be a motivator for students to take the
test
more seriously than usual. The conditions were approved by the
Institutional Review Board at both the researcher's institution
31. and the three institutions where the data collection took place.
The students in the institutional and personal conditions were
debriefed after the data collection was completed and were
assured that their scores would not actually be reported to
faculty
or potential employers.
Because students were randomly assigned to the conditions
within a testing room, before the testing they were instructed to
raise their hand if they had a question instead of asking that
ques
tion in front of the class; thus, no student could realize that
other
students in their room had different instructions.
Analyses
Multiple linear regression analyses were used to investigate the
relationship between self-reported motivation and test scores.
The predictors were SOS scores and admission (or placement)
test scores, and the outcome variables were the Proficiency
Profile
and essay scores, respectively. For students from the two 4-year
32. institutions, the admission scores were the composite SAT
critical
reading and mathematics scores (or converted ACT scores based
on the concordance table provided by ACT and the College
Board at http://www.act.org/aap/concordance/). For students
from the community college, the placement scores were the com
posite reading and writing scores from the eCompass, an
adaptive
college placement test. The regression analysis was conducted
separately for each institution and each dependent variable. The
admission (or placement test) scores were entered into the equa
tion first, followed by mean SOS. The change in R1 was
examined
to determine the usefulness of the predictors. Pearson correla
tions were also calculated among test scores, admission scores,
and SOS scores.
An ANOVA was conducted to investigate the impact of the
motivational conditions on self-reported motivation and on test
scores. The Bonferroni correction was used for post hoc com
parisons between conditions to adjust the Type I error rate for
33. multiple comparisons. Standardized mean differences were com
puted between the three motivational conditions on the SOS, the
Proficiency Profile, and essay scores. A separate analysis was
con
ducted for each measure and each institution. Two-way
ANOVAs
were also conducted to investigate any interaction between the
three institutions and the motivational instructions.
DECEMBER 2012 355
This content downloaded from 129.219.247.33 on Fri, 22 Jan
2016 19:20:39 UTC
All use subject to JSTOR Terms and Conditions
http://www.jstor.org/page/info/about/policies/terms.jsp
Table 2
Pearson Correlations Among Test Scores and Predictors
Self-Report
Test Score3 SATb Motivation
Rl
Test score
SAT
Self-report motivation
34. Ml
Test score
SAT
Self-report motivation
CC
Test score
Placement
Self-report motivation
— 0.71** 0.29**
0.34** — 0.18*
0.25** 0.18* —
— 0.61** 0.39**
0.27** — 0.16*
0.32** 0.16* —
— 0.31** 0.24**
0.51** — 0.07
0.27** 0.07 —
Note. RI = research university; Ml = master's university; CC =
community
college.
aUpper diagonal values are the Proficiency Profile total scores
and lower
35. diagonal values are the essay scores.
bFor the community college this is the placement test scores.
*p< .05. **p< .01.
A general linear model (GLM) analysis was used to address the
research question on college learning gain in SPSS. In the GLM,
the Proficiency Profile and essay scores were used as separate
out
comes variables, with motivational condition and class status
being fixed factors, and SAT scores as a covariate. In the case
of
this study, the GLM analysis is equivalent to a two-way analysis
of
covariance. A homoscedasticity test was conducted to evaluate
the
homogeneity assumption for the GLM. Note that only students
from the two 4-year institutions were included for this analysis
since the learning gain was indicated by the performance
between
sophomores and seniors. The class status was classified based
on
number of credits completed: sophomore (30-60 credits), junior
36. (60-90 credits), and senior (more than 90 credits). The analyses
were done separately for the Proficiency Profile and the essay.
Results
Reliabilities
The Cronbach's alpha for the abbreviated Proficiency Profile
was
.83 for the research institution, .86 for the master's institution,
and .85 for the community college. The Cronbach's alpha for the
SOS motivation scale was .84 for the research institution, .85
for
the master's institution, and .84 for the community college.
Relationship Between Self-Report Motivation and Test
Performance
Pearson correlations among SAT (or placement) scores,
Proficiency Profile test scores (multiple choice and essay), and
SOS scores, separately for each institution, are in Table 2.
Multiple choice test scores are above the diagonal and essay
scores
below. All correlations were significant (p < .05) except for the
correlation between SOS and placement scores at the
37. community
college.
After controlling for SAT or placement scores, self-report
motivation was a significant predictor of both the Proficiency
356 EDUCATIONAL RESEARCHER
Profile and essay scores, and the finding was consistent across
the
three institutions (see Table 3). The standardized coefficients
ranged from .17 to .26 across institutions. After the variable
mean SOS was added to the equation, the change in R2 was sig
nificant across institutions and tests. The R2 values were consis
tently higher for the multiple-choice Proficiency Profile
questions
than for the essay.
The Impact of the Motivational Instructions
Motivational instructions had a significant impact on SOS
scores
(Table 4). At all three institutions, students in the personal
condi
tion reported significantly higher levels of motivation than stu
dents in the control group, and the average difference was .31
38. SD
between the control and institutional conditions and .43 SD
between the control and the personal conditions. The largest dif
ference was .57 SD between the control and personal conditions
for students at the community college. No statistically
significant
differences were observed between the institutional and
personal
conditions across the three institutions.
Motivational condition also had a significant impact on the
Proficiency Profile scores. Students in the personal group per
formed significantly and consistently better than those in the
control group at all three institutions and the largest difference
was .68 SD. The average performance difference was .26 SD
between the control and institutional conditions and .41 SD
between the control and the personal conditions. No statistically
significant differences were observed between the institutional
and personal conditions across the three institutions.
Similarly, students in the personal condition had consistently
39. higher essay scores than students in the control condition across
all three institutions. The largest effect size was .59 SD. Again,
no statistically significant differences were observed between
the institutional and personal conditions across the three
institutions.
Results from the two-way ANOVAs showed that the interac
tion between institutions and motivational conditions was not
statistically significant (F
= .51, df
= 4, p = .73 on mean SOS
scores; F = .86, df= 4, />
= .49 on Proficiency Profile scores; and
F= .83, df= A, p
- .51 on essay scores). Given that the institutions
did not interact with the conditions, we combined all students
for additional analyses and included the results in Table 4.
When
all the students were included, the performance difference was
.23 SD between the control and institutional conditions and .41
SD between the control and personal conditions.
40. Sophomore to Senior Learning Gain
A homoscedasticity test was provided to examine the homogene
ity assumption of general linear regression. The Levene's test of
equality of error variances was not significant (F
= 1.25, df
= 8,
df = 557,/> = .27 for the Proficiency Profile; and F = 1.18, df =
8, df = 557, p = .31 for the essay), which suggests that the data
were suitable for this analysis. Table 5 presents the results from
the GLM analyses. After controlling for SAT, motivation condi
tion was a significant predictor for both tests (p
= .001 for both).
Class status was a significant predictor of the Proficiency
Profile
scores, but not significant for the essay. The interaction
between
motivation condition and class status was not significant for
either test.
This content downloaded from 129.219.247.33 on Fri, 22 Jan
2016 19:20:39 UTC
All use subject to JSTOR Terms and Conditions
41. http://www.jstor.org/page/info/about/policies/terms.jsp
Table 3
Standardized Regression Coefficients With Self-reported
Motivation and Standardized
Test Scores Predicting Proficiency Profile and Essay Scores
Proficiency Profile Essay
Rl Ml CC Rl Ml CC
Self-report motivation 17*** 2^*** 22** 20*** 25*** .17*
SAT (or placement .68*** 54*** .50*** .31*** .32*** .29**
test)3
bA R2 .03 .06 .05 .04 .04 .04
F(A/?2) 15.87*** 24.81*** 6.36** 13.57*** 12.13*** 6.05**
R2 .53 .42 .31 .16 .13 .11
Note. RI = research university; Ml = master's university; CC =
community college.
aThe regression analysis was conducted separately for each
institution by test. For both the research and master's
institutions, composite SAT scores or
converted ACT scores were used as a covariate. For the
community college, composite placement test scores were used
as a covariate.
bAR2 is the change in R2 after the variable mean Student
Opinion Survey was added to the regression equation.
42. *p < .05. **p < .01. ***p < .001.
Table 4
Comparison by Motivational Condition and by Institution
Self-Report Motivation Score
Control Institution Personal
n M SD n M SD n M SD da dcp d/P F P
Rl 111 3.65 .59 116 3.80 .59 113 3.88 .64 .25 .37* .13 4.43 .010
Ml 99 3.59 .60 99 3.76 .60 98 3.88 .61 .28 .48** .20 5.81 .003
CC 40 3.57 .69 42 3.93 .65 36 3.95 .65 .54* .57* .03 4.06 .02
Total 250 3.61 .63 257 3.81 .60 247 3.89 .63 .31** ^^ *** .14
13.68 <.001
Proficiency Profile Score
Control Institution Personal
n M SD n M SD n M SD da dcp d/p F P
Rl 111 453 18.13 116 460 20.66 113 461 21.79 .37* .40** .04
5.37 .005
Ml 99 460 20.19 99 462 19.27 98 467 19.64 .13 .37* .25 3.5
.032
CC 40 435 20.74 42 443 18.48 36 450 21.08 .37 .68** .35 4.79
.010
Total 250 453 21.11 257 458 20.84 247 462 21.62 .26* 41 ***
.16 11.19 <.001
Essay Score
43. Control Institution Personal
n M SD n M SD n M SD da dcp d/p F P
Rl 111 4.20 .84 116 4.46 .82 113 4.60 .93 .31 .45* .16 6.24 .002
Ml 99 4.19 .88 99 4.30 .93 98 4.53 .83 .12 .39* .26 3.73 .025
CC 40 3.30 1.18 42 3.81 .99 36 3.97 1.08 .47 .59* .15 4.04 .020
Total 250 4.07 .96 257 4.29 .93 247 4.46 .95 .23* .41*** .18
12.93 <.001
Note. RI = research university; Ml = master's university; CC =
community college. da = standardized mean difference (d)
between the control and
institutional conditions. dCp = standardized mean difference (d)
between the control and personal conditions. dtP = standardized
mean difference
(d) between the Institutional and Personal conditions.
*p < .05. **p < .01. ***p < .001.
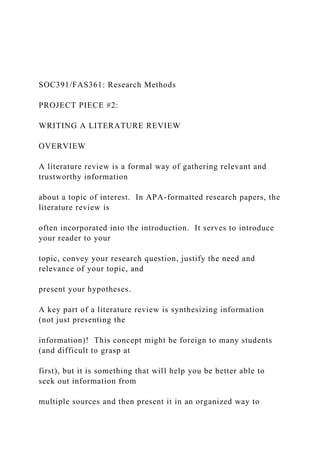
Figures 1 a and 1 b illustrate the estimated Proficiency Profile
and essay scores by motivational condition and class status
(soph
omores, juniors, seniors), after controlling for SAT scores.
Within
each class status group, students in the personal condition
scored
highest on the Proficiency Profile and on the essay, followed by
students in the institutional condition, with the control group
44. showing the lowest performance. The only exception was the
seniors in the institutional and control groups, who had equal
DECEMBER 2012] fÜ7
This content downloaded from 129.219.247.33 on Fri, 22 Jan
2016 19:20:39 UTC
All use subject to JSTOR Terms and Conditions
http://www.jstor.org/page/info/about/policies/terms.jsp
Table 5
Results From the General Linear Models
Proficiency Profile
Source
Type III Sum of
Squares df Mean Square F P
Partial Eta
Squared
Corrected model 110,882.23 9 12,320.25 59.34 <.001 .49
Intercept 1,041,497.58 1 1,041,497.58 5016.10 <.001 .90
SAT 99,110.37 1 99,110.37 477.34 <.001 .46
Condition3 3,232.73 2 1,616.36 7.78 <.001 .03
Class 4,088.74 2 2,044.37 9.85 <.001 .03
45. Condition x Class 399.67 4 99.92 .48 .750 .00
Error 115,442.80 556 207.63
Total 121,140,988 566
Corrected total 226,325.04 565
Essay
Corrected model 48.50 9 5.39 8.74 <.001 .12
Intercept 51.46 1 51.46 83.43 <.001 .13
SAT 32.40 1 32.40 52.54 <.001 .09
Condition 8.67 2 4.34 7.03 <.001 .02
Class 3.32 2 1.66 2.69 .069 .01
Condition x Class 2.88 4 .72 1.17 .324 .01
Error 341.09 553 .62
Total 11,562.00 563
Corrected total 389.60 562
Note. R2 was .49 for the Proficiency Profile and .13 for the
essay.
als the motivation condition.
469 (20)
466(19)
455 (19)
454 (18)
B
4.80
4.60
46. 4.40
4.20
Sophomore Junior Senior
(n = 210) (n = 201) (n = 189)
460(21) a
UJ
4.00
Personal
Institutional 3.80
Control
3.60
4.55 (.88)
4.55 (.82)
4.75 (.88)
— Personal
— Institutional
— Control
Sophomore Junior Senior
(n = 210) (n = 201) (n = 189)
47. FIGURE 1. Proficiency Profile (EPP) and essay scores (and
standard deviations) by condition and by class
status, adjusted by college admission SAT!ACT scores.
essay scores. Although the interaction between class status and
motivation condition was not statistically significant, there was
a larger score difference between the personal and control
groups for juniors and seniors than for sophomores on the
Proficiency Profile (Figure la). On the essay (Figure lb), the per
sonal condition demonstrated a substantial impact across all
classes as compared to the control group: .41 SD for
sophomores,
.53 SD for juniors, and .45 SD for seniors.
358 EDUCATIONAL RESEARCHER
Based on the estimated means produced from the GLM anal
yses, sophomore to senior year score gain was calculated. The
standardized mean differences were used as the effect size
(Figures
2a and 2b). Within the same motivational condition (Figure 2a),
the control group showed comparable learning gains on the
48. Proficiency Profile and the essay (.25 vs. 23 in SD). However,
the
difference was striking for the institutional condition: While no
learning gain (.02 SD) was observed on the essay, the gain was
This content downloaded from 129.219.247.33 on Fri, 22 Jan
2016 19:20:39 UTC
All use subject to JSTOR Terms and Conditions
http://www.jstor.org/page/info/about/policies/terms.jsp
Sophomore to Senior Score Gain
(within motivation condition, in adjusted effect size)
0.41 0.80
EPP (multiple-choice) q.60
Essay
0.40
0.20
0.00
•0,20
-0.40
Sophomore to Senior Score Gain
(across motivation condition, in adjusted effect size)
49. 0.72
■ EPP (multiple-choice)
■ Essay
Least motivated sophomores, Most motivafc
most motivated seniors least motiv.
-0.23
Control Institutional Personal
FIGURE 2. Sophomore to senior score gain (value-added) in
effect size adjusted for SAT scores, within and
across motivation conditons. EPP = Proficiency Profile.
substantial using the Proficiency Profile (.41 SD). The personal
condition also showed a considerable difference in value-added
learning between the multiple-choice and the essay tests: .23 SD
on the essay and .42 SD on the Proficiency Profile.
In most value-added calculations, it is assumed that the levels
of motivation remain somewhat equal between the benchmark
class (e.g., freshmen or sophomores) and the comparison class
(e.g., juniors or seniors). However, students in lower classes
may
50. be more motivated than their upper-class peers for multiple rea
sons, such as still being intimidated by tests or being less busy.
Here we illustrated two extreme cases where least motivated
sophomores and most motivated seniors were compared, and
vice
versa. Substantial gains on both the Proficiency Profile (.72 SD)
and the essay (.65 SD) were observed when groups of least moti
vated sophomores and most motivated seniors were tested
(Figure
2b). However, little or even negative gain (-.23 SD) was
observed
when groups of most motivated sophomores and least motivated
seniors were considered.
Conclusions
We draw three conclusions from this random assignment experi
ment. First, self-report motivation has a significant and consis
tent relationship with test scores, for both multiple-choice and
essay tests, even after controlling for college admission scores
or
placement test scores. Second, manipulation of motivation could
51. significantly enhance student motivation in taking low-stakes
outcomes assessments and in turn increase their test scores on
both multiple-choice and essay tests. The results also confirmed
researchers' concern (e.g., Banta, 2008; Liu, 201 la) that
students
do not exert their best effort in taking low-stakes outcomes
assess
ments. Students in the two treatment conditions performed sig
nificantly better than students in the control condition. Between
the two treatment conditions, there was no statistically signifi
cant performance difference, but students in the personal condi
tion showed a small advantage as compared to the students in
the
institutional condition (d= .16 for the Proficiency Profile and d
= .18 for the essay). Last, when using outcomes assessment
scores
to determine institutional value-added gains, one has to take
into
consideration students' levels of motivation in taking the assess
ment and the format of the assessment instrument (i.e., multiple
choice or constructed response). As shown in this study, conclu
52. sions about value-added learning changed dramatically depend
ing on the test of choice and the motivation levels. These
findings
are fairly consistent with findings from previous studies using
course-based assessments (e.g., Sundre, 1999; Sundre &
Kitsantas, 2004; Wolf & Smith, 1995). To summarize, motiva
tion plays a significant role in low-stakes outcomes assessment.
Ignoring the effect of motivation could seriously threaten the
validity of the test scores and make any decisions based on the
test
scores questionable.
Although previous studies (e.g., Duckworth et al., 2011) have
demonstrated the value of monetary incentives, such incentives
are not a practical alternative for most institutional testing pro
grams given the fiscal challenges institutions currently face.
This
study demonstrated that once institutions recruit students to
take
the test, they can use motivational strategies that do not involve
extra financial costs to produce significant effects on student
performance.
53. One potential limitation of this study is that the administra
tion of the multiple-choice and essay tests was not counterbal
anced due to logistic complications with the random assignment
within a testing session. All students took the multiple-choice
test
first, which may have impacted their overall motivation in
taking
the following essay test. However, our results showed that stu
dents' self-report motivation predicted both tests to about the
same degree (Tables 2 and 3), and the effect of the motivational
instructions was comparable on the two tests (Table 4), which
suggests that the impact of the order of the test administration
was probably minimal. A potential explanation is that both the
multiple-choice and the essay test were pretty short (40 and 30
minutes) and therefore students were not exhausted by the end
of the first test.
Implications
Implications for Researchers, Administrators, and Policymakers.
Findings from this study have significant implications for
54. DECEMBER 2012 359
This content downloaded from 129.219.247.33 on Fri, 22 Jan
2016 19:20:39 UTC
All use subject to JSTOR Terms and Conditions
http://www.jstor.org/page/info/about/policies/terms.jsp
higher education stakeholders at many levels. For educational
researchers, the limited college learning reported from prior
research is likely an underestimate of true student learning due
to
students' lack of motivation in taking low-stakes tests. The book
Academically Adrift (Arum & Roksa, 2011) surprised the nation
by reporting that overall, students demonstrated only minimal
learning on college campuses (.18 SD), and at least 45% of
the students did not make any statistically significant gains.
They
concluded that "in terms of general analytical competencies
assessed, large numbers of U.S. college students can be
accurately
described as academically adrift" (p. 121). The Arum and Roksa
study analyzed the performance of a group of students when
55. entering their freshman year and at the end of their sophomore
year using the CLA, a constructed-response test.
We want to bring it to the readers' attention that the limited
learning gain reported in the Arum and Roksa (2011) study
(.18 SD) is very similar to the small learning gain (.23 SD,
Figure 2a) observed in this study for students in the control
group on the essay. However, we've shown in this study that
with higher levels of motivation, students can significantly
improve their test performance and demonstrate a much larger
learning gain (Figure 2a). In addition, conclusions about col
lege learning can also change with the test of choice. Findings
from this study show that more learning gain was consistently
observed on the multiple-choice test than on the essay test
(Figures 2a and 2b). The reason could be that it takes more
effort and motivation for students to construct an essay than to
select from provided choices. Figure 1 b shows that the institu
tional condition was not able to motivate the seniors on the
essay test. It may take a stronger reason than caring for one's
56. institutional reputation for seniors to be serious about writing
an essay.
In sum, for both multiple-choice and constructed-response
tests, students' performance motivation could dramatically
change
the conclusions we make about college learning. The limited col
lege learning as reported in the Arum and Roksa (2011) study,
as
well as that found in this study for the students in the control
condition, is likely an underestimation of students' true college
learning. It is dangerous to make conclusions about the quality
of
U.S. higher education based on learning outcomes assessment
data
without considering the role of motivation.
For institutions, this study provides credible evidence that
motivation has a significant impact on test scores. Without moti
vational manipulation, the performance difference between
sophomores and seniors was 5 points (Figure 1 a, control condi
tion). With motivational manipulation, sophomores were able to
57. gain 5 points in the personal condition, which suggests that the
motivational effect for sophomores was as large as 2 years of
col
lege education. When administering outcomes tests, institutions
should employ effective strategies to enhance student
motivation
so that students' abilities will not be underestimated by the low
stakes tests. Although we paid students $50 to take the test in
the
study, the motivational instructions used to boost student perfor
mance did not involve any additional payment. Institutions can
use other incentives (e.g., offering extra credits) to recruit stu
dents to take the tests and use practical strategies to motivate
them, such as stressing the importance of the test results to the
institution and emphasizing potential consequences of the
results
to individual students. This way, students' scores are likely to
be
improved at no extra financial cost to the institutions.
An important message to policymakers is that institutions
that employ different motivational strategies in testing the stu
58. dents should be compared with great caution, especially when
the
comparison is for accountability purposes. Accountability initia
tives involving outcomes assessment should also take into
account
the effect of motivation when making decisions about an institu
tion's instructional effectiveness. Institutions doing a good job
of
motivating students could achieve significantly higher rankings
than institutions doing a poor job of motivating students, even
though their students may have comparable academic abilities.
Figure 2b illustrates how significant the effect of motivation
could be: If we compare the most motivated (personal
condition)
sophomores to the least motivated (control condition) seniors on
the Proficiency Profile, we would come to the conclusion that
students did not learn anything during the 2 years time.
However,
if we compare the least motivated sophomores with the most
motivated seniors also on the Proficiency Profile, we would
come
59. to a radically different conclusion, that students gained substan
tial knowledge (0.72 SD). The difference is starker on the essay.
A comparison of the most motivated sophomores with the least
motivated seniors leads to the conclusion that not only did stu
dents not make any progress, but that they were even set back
by a college education as indicated by the negative gain score
(-0.23 SD).
The importance of the findings extends well beyond the
United States as outcomes assessment is being used in interna
tional studies assessing college learning across multiple
countries.
For example, the Assessment of Higher Education Learning
Outcomes (AHELO) project sponsored by the Organization of
Economic and Cooperation Development (OECD) tests what
college graduates know and can do in general skills such as
critical
thinking, writing, and problem solving and has attracted partici
pation from 17 countries. Although AHELO does not endorse
ranking, the higher education systems of the participating coun
60. tries will likely be compared once the data are available.
Differential motivation across countries is likely to
significantly
impact how U.S. students stand relative to their international
peers (Barry, Horst, Finney, Brown, & Kopp, 2010; S. L. Wise
&
DeMars, 2010). As S. L. Wise and DeMars (2010) noted, results
from international comparative studies such as PISA may be
questionable as the level of mean student motivation may vary
across countries. In fact, differential motivation between fresh
men and sophomores, in addition to the low motivation in gen
eral, was likely the key factor responsible for the limited
learning
reported in the Arum and Roksa study (2011).
A Cautionary Note. We wanted to make a cautionary note that
college learning outcomes are much broader than what's
captured
by learning outcomes assessments. College learning covers
learn
ing in disciplinary subjects, interdisciplinary domains, general
skills, and in many other aspects. Although students' scores on
61. outcomes assessments are in general valid predictors of their
course work preparation (Hendel, 1991; Lakin et al., in press;
Marr, 1995), they only reflect a fraction of what students know
and can do. Generalizing outcomes scores to college learning
or even to the quality of higher education is questionable. In
360 EDUCATIONAL RESEARCHER
This content downloaded from 129.219.247.33 on Fri, 22 Jan
2016 19:20:39 UTC
All use subject to JSTOR Terms and Conditions
http://www.jstor.org/page/info/about/policies/terms.jsp
addition, sampling issues could further thwart the validity of the
conclusion about an institution's instructional quality using out
comes assessment (Liu, 201 la).
In addition, although research has been conducted concern
ing other aspects of validity for outcomes assessment, little is
known about its consequential validity (Messick, 1995), in this
case, whether outcomes assessment can assist administrators bet
ter prepare students for performance in the workforce. The fol
62. low-up study to Arum and Roksa's (2011) study found that
graduates scoring in the bottom quintile are more likely to be
unemployed, living at home, and having amassed credit card
debt
(Arum, Cho, Kim, & Roksa, 2012). However, graduates in the
top quintile were only making $97 more than those in the bot
tom quintile ($35,097 vs. $35,000), and graduates in the middle
three quintiles were making even less than the bottom quintile
cohort ($34,741). The consequential validity of learning out
comes assessments awaits further confirmation.
Next Steps
In future research, efforts should be made to identify effective
and robust strategies that institutions can adopt to boost student
motivation in taking low-stakes tests. We are particularly inter
ested in further exploring the function of the institutional condi
tion used in this study. Although not producing effects as large
as
the personal condition, in general this condition was effective in
motivating students. In addition, as what is said about the per
sonal condition (that students' scores will be used by potential
63. employers to evaluate their academic ability) may not be true,
what is described for the institutional condition is often true
given many institutions do rely on outcomes learning data for
improvement and accountability purposes. This strategy can be
easily customized or even enhanced by individual institutions.
For instance, instead of including it in the consent form, institu
tions can train proctors to motivate students with a short speech
emphasizing the importance of the test scores to their institution
and the relevance of the test results to students.
The reason underlying the effect of the personal condition lies
in the relevance of the test scores to students. A possible
solution
along the same line is for the test sponsors to provide a
certificate
to students attesting to their performance. Students then can
choose to present the certificate to potential employers in evalu
ating their academic ability. With a certificate, results from
learn
ing outcomes assessment are not only important for institutions,
but are meaningful for students as well.
64. In this study, although we are able to observe consistent motiva
tion effects across the participating institutions, only three
institu
tions were included. It is important to see whether the findings
from this study can be replicated with more institutions.
Knowledge
about effective and practical strategies that institutions can use
to
enhance student motivation will greatly help improve the
validity
of outcomes assessment and largely contribute to the evidence
based, data-driven, and criterion-referenced evaluation system
that
U.S. higher education is currently developing.
NOTE
'Formerly known as the Measure of Academic Proficiency and
Profile
(MAPP).
REFERENCES
Arum, R., Cho, E., Kim, J., & Roksa, J. (2012). Documenting
uncertain
65. times: Post-graduate transitions of the academically adrifi
cohort.
Brooklyn, NY: Social Science Research Council.
Arum, R., & Roksa, J. (2011). Academically adrift: Limited
learning on
college campuses. Chicago, IL: University of Chicago Press.
Astin, A. W. (2011, February 14). In "Academically Adrift,"
data don't
back up sweeping claim. The Chronicle of Higher Education.
Retrieved
from http://chronicle.com/article/Academically-Adrift-a/126371
Banta, T. (2008). Trying to clothe the emperor. Assessment
Update, 20,
3-4, 16-17.
Barry, C. L., Horst, S. J., Finney, S. J., Brown, A. R., & Kopp,
J.
(2010). Do examinees have similar test-taking effort? A high-
stakes
question for low-stakes testing. InternationalJournal of Testing,
10(A),
342-363.
Baumert, J., & Demmrich, A. (2001). Test motivation in the
assessment
66. of student skills: The effects of incentives on motivation and
perfor
mance. European Journal of Psychology of Education, 16, 441-
462.
Belcheir, M. J. (2002). Academic profile results for selected
nursing students
(Report No. 2002-05). Boise, ID: Boise State University.
Braun, H., Kirsch, I., & Yamamoto, K. (2011). An experimental
study
of the effects of monetary incentives on performance on the
12th
grade NAEP reading assessment. Teachers College Record, 113,
2309
2344.
Cole, J. S., & Osterlind, S. J. (2008). Investigating differences
between
low- and high-stakes test performance on a general education
exam.
The Journal of General Education, 57, 119-130.
Duckworth, A. L., Quinn, P. D., Lynam, D. R., Loeber, R., &
Stouthamer-Loeber, M. (2011). Role of test motivation in intelli
gence testing. Proceedings of the National Academy of
Sciences, 108,
7716-7720.
Educational Testing Service. (2010). Market research of
67. institutions that
use outcomes assessment. Princeton, NJ: Author.
Haladyna, T. M., & Downing, S. M. (2004). Construct-
irrelevant vari
ance in high-stakes testing. Educational Measurement: Issues
and
Practice, 23, 17-27.
Hendel, D. D. ( 1991 ). Evidence of convergent and
discriminant validity
in three measures of college outcomes. Educational and
Psychological
Measurement, 51, 351-358.
Klein, S., Liu, O. L., Sconing, J., Bolus, R., Bridgeman, B.,
Kugelmass,
... Steedle, J. (2009). Test validity study report. Retrieved from
http://
www.voluntarysystem.org/docs/reports/TVSReport_Final.pdf
Kuh, G. D., & Ikenberry, S. O. (2009). More than you think,
less than we
need: Learning outcomes assessment in American higher
education.
Urbana, IL: University of Illinois and Indiana University,
National
Institute for Learning Outcomes Assessment.
68. Kuh, G. D., Kinzie, J., Buckley, J. A., Bridges, B. K., & Hayek,
J. C.
(2006). What matters to student success: A review of the
literature
(Report commissioned for the National Symposium on
Postsecondary
Student Success: Spearheading a Dialog on Student Success).
Washington, DC: National Postsecondary Education
Cooperative.
Lakin, J., Elliott, D., & Liu, O. L. (in press). Investigating the
impact of
ELL status on higher education outcomes assessment.
Educational
and Psychological Measurement.
Liu, O. L. (2008). Measuring learning outcomes in higher
education using
the Measure of Academic Proficiency and Progress (MAPP™)
(ETS
Research Report Series RR-08-047). Princeton, NJ: Educational
Testing Service.
Liu, O. L. (201 la). An overview of outcomes assessment in
higher edu
cation. Educational Measurement: Issues and Practice, 30, 2-9.
69. Liu, O. L. (2011 b). Value-added assessment in higher
education: A com
parison of two methods. Higher Education, 61, 445-461.
DECEMBER 2oTT] [ÜT
This content downloaded from 129.219.247.33 on Fri, 22 Jan
2016 19:20:39 UTC
All use subject to JSTOR Terms and Conditions
http://www.jstor.org/page/info/about/policies/terms.jsp
Livingston, S. A., & Antal, J. (2010). A case of inconsistent
equatings:
How the man with four watches decides what time it is. Applied
Measurement in Education, 23(1), 49-62.
Marr, D. (1995). Validity of the academic profile. Princeton,
NJ:
Educational Testing Service.
Messick, S. (1995). Validity of psychological assessment:
Validation of
references from persons' responses and performances on
scientific
inquiry into score meaning. American Psychologist, 50, 741-
749.
Ochoa, E. M. (2011, March). Higher education and
accreditation: The
view from the Obama administration. Career Education Review.
70. Retrieved from http://www.careereducationreview.net/featured
-articles/docs/201 l/CareerEducationReview_Ochoa0311 .pdf
O'Neil, H. F., Abedi, J., Miyoshi, J., & Mastergeorge, A.
(2005).
Monetary incentives for low-stakes tests. Educational
Assessment, 10,
185-208.
O'Neil, H. E, Sugrue, B., & Baker, E. L. (1995/1996). Effects of
motivational interventions on the National Assessment of
Educational
Progress mathematics performance. Educational Assessment, 3,
135-157.
Pintrich, P. R., & Schunk, D. H. (2002). Motivation in
education:
Theory, research, and applications (2nd ed.). Upper Saddle
River, NJ:
Prentice Hall.
Steedle, J. (2011). Selecting value-added models for
postsecondary insti
tutional assessment. Assessment and Evaluation in Higher
Education,
1-16.
Sundre, D. L. (1997, April). Differential examinee motivation
71. and valid
ity: A dangerous combination. Paper presented at the annual
meeting
of the American Educational Research Association, Chicago, IL.
Sundre, D. L. (1999, April). Does examinee motivation
moderate the rela
tionship between test consequences and test performance? Paper
presented
at the annual meeting of the American Educational Research
Association, Montreal.
Sundre, D. L., & Kitsantas, A. L. (2004). An exploration of the
psychol
ogy of the examinee: Can examinee self-regulation and test-
taking
motivation predict consequential and non-consequential test
perfor
mance? Contemporary Educational Psychology, 29(1), 6-26.
Sundre, D. L„ & Wise, S. L. (2003, April). Motivation filtering:
An
exploration of the impact of low examinee motivation on the
psychometric
quality of tests. Paper presented at the annual meeting of the
National
Council on Measurement in Education, Chicago, IL.
U.S. Department ofEducation. (2006). A test of leadership:
72. Chartingthe
future of American higher education (Report of the commission
appointed by Secretary ofEducation Margaret Spellings).
Washington,
DC: Author.
Voluntary System of Accountability. (2008). Information on
learning
outcomes measures. Author.
Wise, S. L„ & DeMars, C. E. (2005). Low examinee effort in
low-stakes
assessment: Problems and potential solutions. Educational
Assessment,
10( 1), 1-17.
Wise, S. L., & DeMars, C. E. (2006). An application of item
response
time: The effort-moderated IRT model. Journal of Educational
Measurement, 43(1), 19-38.
Wise, S. L., & DeMars, C. E. (2010). Examinee noneffort and
the valid
ity of program assessment results. Educational Assessment, 15,
27-41.
Wise, S. L., & Kong, X. (2005). Response rime effort: A new
measure
of examinee motivation in computer-based tests. Applied
73. Measurement
in Education, 18(2), 163-183.
Wise, V. L. (2004). The effects of the promise of test feedback
on examinee
performance and motivation under low-stakes testing conditions
(Unpublished doctoral dissertation). University of Nebraska-
Lincoln,
Lincoln, NE.
Wise, V. L., Wise, S. L., & Bhola, D. S. (2006). The
generalizability of
motivation filtering in improving test score validity.
Educational
Assessment, 11( 1), 65-83.
Wolf, L. E, & Smith, J. K. (1995). The consequence of
consequence:
Motivation, anxiety, and test performance. Applied
Measurement in
Education, 8, 227-242.
AUTHORS
OU LYDIA LIU is a senior research scientist at ETS, 660
Rosedale Road,
Princeton, NJ 08540; [email protected] Her research focuses on
74. learning out
comes assessment in higher education and innovative science
assess
ment.
BRENT BRIDGEMAN is a distinguished presidential appointee
at
Educational Testing Service, 660 Rosedale Rd., Princeton, NJ
08540;
[email protected] His research focuses on validity research, in
particu
lar threats to score interpretations from construct irrelevant
variance.
RACHEL M. ADLER is a research assistant at ETS, 660
Rosedale Road,
Mailstop 9R, Princeton, NJ 08541; [email protected] Her
research focuses
on validity issues related to assessments for higher education
and English
Language Learners.
Manuscript received April 12,2012
Revisions received June 1,2012, and July 23,2012
Accepted July 24,2012
362 EDUCATIONAL RESEARCHER
75. This content downloaded from 129.219.247.33 on Fri, 22 Jan
2016 19:20:39 UTC
All use subject to JSTOR Terms and Conditions
http://www.jstor.org/page/info/about/policies/terms.jspArticle
Contentsp. 352p. 353p. 354p. 355p. 356p. 357p. 358p. 359p.
360p. 361p. 362Issue Table of ContentsEducational Researcher,
Vol. 41, No. 9 (DECEMBER 2012) pp. 339-412Front MatterAre
Minority Children Disproportionately Represented in Early
Intervention and Early Childhood Special Education? [pp. 339-
351]Measuring Learning Outcomes in Higher Education:
Motivation Matters [pp. 352-362]Special Section: Mobility and
Homelessness in School Aged-ChildrenIntroduction to Special
Section: Risk and Resilience in the Educational Success of
Homeless and Highly Mobile Children: Introduction to the
Special Section [pp. 363-365]Early Reading Skills and
Academic Achievement Trajectories of Students Facing Poverty,
Homelessness, and High Residential Mobility [pp. 366-
374]Executive Function Skills and School Success in Young
Children Experiencing Homelessness [pp. 375-384]The
Longitudinal Effects of Residential Mobility on the Academic
Achievement of Urban Elementary and Middle School Students
[pp. 385-392]The Unique and Combined Effects of
Homelessness and School Mobility on the Educational
Outcomes of Young Children [pp. 393-402]CommentsEducation
Research on Homeless and Housed Children Living in Poverty:
Comments on Masten, Fantuzzo, Herbers, and Voight [pp. 403-
407]Back Matter
Sage Publications, Inc. and American Educational Research
Association are collaborating with JSTOR to digitize, preserve
and extend access to Educational Researcher.
76. http://www.jstor.org
Students' Motivation for Standardized Math Exams
Author(s): Katherine E. Ryan, Allison M. Ryan, Keena
Arbuthnot and Maurice Samuels
Source: Educational Researcher, Vol. 36, No. 1 (Jan. - Feb.,
2007), pp. 5-13
Published by: American Educational Research Association
Stable URL: http://www.jstor.org/stable/4621063
Accessed: 22-01-2016 19:21 UTC
REFERENCES
Linked references are available on JSTOR for this article:
http://www.jstor.org/stable/4621063?seq=1&cid=pdf-
reference#references_tab_contents
You may need to log in to JSTOR to access the linked
references.
Your use of the JSTOR archive indicates your acceptance of the
Terms & Conditions of Use, available at
http://www.jstor.org/page/
info/about/policies/terms.jsp
JSTOR is a not-for-profit service that helps scholars,
researchers, and students discover, use, and build upon a wide
range of content
in a trusted digital archive. We use information technology and
tools to increase productivity and facilitate new forms of
scholarship.
For more information about JSTOR, please contact
[email protected]
This content downloaded from 129.219.247.33 on Fri, 22 Jan
2016 19:21:43 UTC
All use subject to JSTOR Terms and Conditions
78. cognitive
processes. The authors present excerpts from interviews with
eighth-grade test takers to illustrate these different
achievement-
related motivational beliefs, affect, and cognitive processing.
Implications for future research studying the situational
pressures
involved in high-stakes assessments are discussed.
Keywords: accountability; high-stakes testing; motivation
he No Child Left Behind Act (NCLB; 2002) has defined
a vital role for large-scale assessment in determining
whether students are learning. Assessment results are
being used for "high-stakes" purposes such as grade promotion,
certification, and high school graduation as well as holding
schools accountable to improve instruction and student learning.
NCLB reflects a particular perspective on how teaching and
learning take place and the role of testing in this process.
Specifically, the high-stakes nature of these tests is intended to
motivate students to perform to high standards, teachers to
teach
better, and parents and local communities to make efforts to
improve the quality of local schools (Committee on Education
and the Workforce, 2004; Herman, 2004; Lee & Wong, 2004;
Stringfield & Yakimowski-Srebnick, 2005). Within this view,
motivation is a unidimensional trait that does not vary in the
stu-
dent population. The premise is that rewards (e.g., passage to
the
79. next grade) and threats of sanctions (e.g., grade retention or the
denial of a high school diploma) will boost students' motivation
(Clarke, Abrams, & Madaus, 2001).
This kind of assessment environment raises important issues.
There is a fundamental assumption that test taking is a singular
experience for students. That is, the assessment context (high
stakes vs. low stakes) will not influence or influence in a
similar
way how individuals and groups of students engage the test-
taking process (Heubert & Hauer, 1999). Our perspective chal-
lenges this assumption. Not only knowledge but individuals'
per-
sonal beliefs and goals influence performance. Understanding
the
variability of engagement and achievement of students with
sim-
ilar "abilities" or "background knowledge" is at the heart of
much
motivational research (Pintrich & Schunk, 2002). Individuals'
beliefs and goals form qualitatively distinct motivational frame-
works leading to differential trajectories of cognitive
engagement,
affect, and performance (Brophy, 1999; Covington, 1992;
Dweck, Mangels, & Good, 2004; Maehr & Meyer, 1997;
Pintrich & Schunk, 2002; Stipek, 2002; Wigfield, Eccles,
Schiefele, Roeser, & Davis-Kean, 2006).
Two Students' Beliefs About Math Test Taking
When taking [math] tests, I know that I know this stuff so I
really
80. don't worry about it even though I know it will determine if I
pass
or fail to the next grade ... if you're more confident on the test,
you
will perform better. I wanted to do well [on this math test]
because ... I want to do well at everything I do. (Martin, male
African American eighth grader, moderate math achiever, May
2003)
I wanted to do well on this test. ... I don't want to have my name
out there and it say she did the worse stuff.... Well probably,
this
is a really bad reason, it's probably not the reason I should have
[for
doing well] but my dad is very good at math, and my brother, I,
and my mom aren't good at math at all, we inherited the "not
good
at math gene" from my mom and I am good in English but I am
not good in math so I can make my dad happy and make myself
feel better about math in general. (Sarah, female White eighth
grader, moderate math achiever, March 2003)
These brief vignettes illustrate some of the different self-
perceptions students bring to the context of math test taking.
For
instance, when we asked Martin about his experiences taking
math
tests, he told us that doing well on the test was one of his goals.
Furthermore, Martin wants to do well at everything. He is very
confident about what he thinks he knows. Martin understands
that it is important to be confident and to maintain that confi-
dence when taking a test. Sarah presented a very different
picture
of herself and how she engages the math domain and testing.
She
81. also wanted to do well on the test, but for a different reason: so
that she would not be known as someone who does the "worst."
Educational Researcher, Vol. 36, No. I, pp. 5-13
DOI: 10.3102/0013189X0629800 1
JANUARY/FEBRUARY 2007 1K
This content downloaded from 129.219.247.33 on Fri, 22 Jan
2016 19:21:43 UTC
All use subject to JSTOR Terms and Conditions
http://www.jstor.org/page/info/about/policies/terms.jsp
She perceives herself as not being good at math. Although she
would like to feel better about math and make her father happy,
inheriting her mother's "not good at math gene" presents a for-
midable obstacle to reaching those goals as well as improving
her
math achievement.
We propose that it is these kinds of differences in students'
motivational beliefs, affect, and cognitive processing that may
be
important in understanding students' math test performance.
There is a substantial amount of research showing that such
beliefs
are important to achievement, especially in the classroom
(Pintrich
& Schunk, 2002; Weiner, 1990; Wigfield et al., 2006).
However,
these beliefs have not been examined as fully in the high-stakes
standardized testing situation, particularly the circumstantial
pres-
82. sures created in recent years with these kinds of assessments. In
this
article, we focus on standardized math test taking because
mathe-
matics plays a crucial gatekeeper role to educational and
economic
opportunities. However, other critical and important domains
could be examined (e.g., English, science, social studies).
To examine how these individual and/or group differences in
student beliefs may influence standardized math performance,
we briefly review both the theoretical and the empirical litera-
ture on key motivation constructs. Most major theories of moti-
vation address individuals' beliefs about why they want to do a
task or beliefs about whether they can do a task (Pintrich &
Schunk, 2002; Wigfield et al., 2006). We focus on several lead-
ing theories of achievement motivation in achievement settings
that encompass these aspects of motivation: goals and value
(i.e.,
students' beliefs about why they take standardized tests) and
self-
concept and self-efficacy (i.e., students' beliefs about whether
they
can do well on standardized tests). Furthermore, we consider
two other psychological processes, test anxiety and cognitive
pro-
cessing (specifically cognitive disorganization), that are likely
to
show individual differences and affect students' achievement.
We comment on gender and ethnic differences when research
has shown differences in processes and how these differences
affect achievement.
After briefly reviewing these motivational, affective, and cog-
83. nitive processes, we present excerpts from interviews with stu-
dents to illustrate the extent to which these psychological
processes vary during standardized test situations. The students
participated in semistructured interviews in which they were
asked to talk about their experiences in math test taking. These
students were moderate and high math achievers1 in the eighth
grade (n = 33; 40% male, 60% female) from six schools in the
Midwest.2 We selected eighth-grade students because by early
adolescence, students have sophisticated conceptions of
academic
ability (Dweck, 2001; Nicholls, 1990). The interview excerpts
are
intended to provide a context for considering how these
processes
may influence math test taking, not as study results. We
conclude
with a brief discussion about whether test taking is likely to be
the
same for all students.
Achievement Goals
Achievement goal theory addresses the purpose and meaning
that
students ascribe to achievement behavior. Identified as "a major
new direction, one pulling together different aspects of achieve-
ment research" (Weiner, 1990, p. 620), it is now the most
frequently used approach to understanding students' motivation
(Pintrich & Schunk, 2002). Within achievement goal theory,
goals are conceptualized as an organizing framework or schema
regarding beliefs about purpose, competence, and success that
influence an individual's approach, engagement, and evaluation
of performance in an achievement context (Ames, 1992; Dweck
84. & Leggett, 1988; Elliot & Church, 1997; Nicholls, 1989;
Pintrich, 2000b). Achievement goals go beyond task-specific
tar-
get goals (i.e., get 8 of 10 correct on an exam) and embody an
inte-
grated system of beliefs focused on the purpose or reason
students
engage in behavior (i.e., why does a student want to get 8 of 10
correct?) (Pintrich, 2000a). Although there are personality
differ-
ences, achievement goals are situation specific (Ames, 1992;
Pintrich, 2000a; Urdan, 1997). There is growing evidence that
cues in the environment influence individuals' goals, which set
into motion achievement-related affect and cognitions that
affect
achievement. (Pintrich & Schunk, 2002).
Achievement goals capture meaningful distinctions in how
individuals orient themselves to achieving competence in
academic
settings (Elliot & Harackiewicz, 1996; Middleton & Midgley,
1997; Pintrich, 2000b; Skaalvik, 1997). Two dimensions are
important to understanding achievement goals: how a goal is
defined and how it is valenced (Elliot & Harackiewicz, 1996;
Middleton & Midgley, 1997; Pintrich, 2000b; Skaalvik, 1997).
A goal is defined by a focus on either absolute or intrapersonal
standards for performance evaluation on a given academic task
(mastery goal) or on normative standards for performance
evalu-
ation on a given academic task (performance goal). Valence is
85. dis-
tinguished by either promoting positive or desired outcomes
(approach success) or preventing negative or undesired
outcomes
(avoiding failure). Thus, four achievement goal orientations can
be distinguished within this framework. We provide examples
of
each and then define each goal.
Mastery-Approach Goals
Um usually I don't look at the score; usually I see how many I
got
right and what I need to do to think about it. (Andy, male White
eighth grader, high math achiever, September 2003)
[When facing a difficult problem], I didn't really get frustrated,
but
I did want to just get it right, just to challenge myself, I guess.
(Ray,
male African American eighth grader, moderate math achiever,
January 2004)
[I was] feeling like I was just gonna try to do good on the math
test,
and see what happened afterwards. (Bill, male White eighth
grader,
moderate math achiever, September 2003)
A mastery-approach goal is characterized by a focus on
mastering
a task, striving to accomplish something challenging, and pro-
moting success on the task, often in reference to one's previous
86. achievement. Bill's, Andy's, and Ray's comments about math
tests reflect this kind of orientation. Bill concerns himself with
doing as well as possible (approach success) on the test (task at
hand). Andy claims not to look at the test score. He is
concerned
with what he got correct (approach success) on the test (task)
and
what he might need to do next. Both are interested in becoming
more competent, improving their skills and knowledge. Ray sees
difficult items as a way to challenge himself.
•1 EDUCATIONAL
RESEARCHER
This content downloaded from 129.219.247.33 on Fri, 22 Jan
2016 19:21:43 UTC
All use subject to JSTOR Terms and Conditions
http://www.jstor.org/page/info/about/policies/terms.jsp
Mastery-Avoid Goals
I wanted to do well ... [on the math test] Um just to see what I
know so I don't feel like I don't know anything. (Natalie, female
White eighth grader, moderate math achiever, September 2003)
I wasn't nervous or anything ... it's not the end of the world if I
don't do great on the test, but I wouldn't want to fail it or
anything.
(Beth, female African American eighth grader, high math
achiever,
May 2004)
A mastery-avoid goal is distinguished by a focus on avoiding
any
87. misunderstanding or errors and preventing a negative outcome
on a task, specifically in reference to one's previous
achievement
(but, it is important to note, not in reference to others' achieve-
ment or others impressions of one's achievement). Natalie's
char-
acterization of how she engaged the math test reflects this kind
of
goal. She is not focused on herself or what other people think
about her. Instead, she concentrates on the test (task at hand).
However, the way she values her performance reflects a concern
with avoiding a negative outcome (that she does not know any-
thing). Beth's orientation toward tests reflects a similar orienta-
tion. She also is focused on avoiding failure on the task, in this
case the math test.
Performance-Approach Goals
I want to do well so I can show it to my grandmother for her
praise.
(Martin, male African American eighth grader, moderate math
achiever, May 2003)
[I want to see] How good I'm compared to other kids in the
nation.
(Amanda, female White eighth grader, high math achiever,
April
2003)
I always try to do well, I guess it makes me look good ... builds
up
my reputation. (George, male African American eighth grader,
high
achiever, May 2004)
On the other hand, aperformance-approach goal concerns a
88. focus
on demonstrating high ability and looking smart. Martin wants
to do well so that his grandmother will think he is smart. He is
concerned about his grandmother's judgment of his ability.
When Amanda says that she wants to see how well she did in
comparison with the rest of the nation, there is a clear
normative
focus (a focus on self in comparison with others, not on the
task).
There is an implication that this student probably expects to be
successful, given the national comparison group selected,
although this is not stated directly. George's motivation orienta-
tion is similar to Amanda's. He wants to look good and to
develop a reputation for being "good."
Performance-Avoid Goals
[My math test score means] alot because if I did bad I would
feel
really like embarrassed. (April, female White eighth grader,
mod-
erate to high math achiever, September 2003)
I just didn't want to do bad. I mean I don't think anyone wants
to
do bad on anything. I don't want to be like... I don't know. I
don't
want to be like stupid or anything... that is why I try to do good
on things. (Maxwell, male African American eighth grader,
mod-
erate math achiever, May 2004)
A performance-avoid goal concerns a focus on avoiding
negative
judgments of one's ability and avoiding looking dumb. April's
89. comments about why her math test score means a lot illustrates
a
performance-avoid goal. She is oriented toward how she will
appear (performance, not the task). April is also concerned
about
avoiding a negative outcome: not being embarrassed by her
math
test score (avoiding failure). In the excerpt at the beginning of
this
article, Sarah's achievement goal also reflects this orientation.
She
does not want to be named (focus on self) as the person who did
the worst on this test (avoid failure). Maxwell's view also
reflects
a concern about how he will look if does not do well. Unlike
April, who is concerned about being embarrassed, Maxwell is
concerned about what a poor performance would say about his
ability: that he is "stupid."
These achievement goals represent disparate purposes for
involvement regarding academic tasks and have been linked to
different achievement beliefs and behaviors (Elliot &
McGregor,
2001). There is a large literature that identifies achievement
goals
as critical in understanding students' academic outcomes (e.g.,
Pintrich & Schunk, 2002; Weiner, 1990; Wigfield et al., 2006).
Furthermore, performance-avoid goals have consistently been
linked to lower levels of performance (Elliot & Church, 1997;
Elliot & McGregor, 1999, 2001; Elliot, McGregor, & Gable,
1999; Harackiewicz, Pintrich, Barron, Elliot, & Thrash, 2002;
90. Middleton & Midgley, 1997; Skaalvik, 1997).
In addition to achievement goals, there are other important
motivational processes that contribute to understanding
students'
test performance. In the next section, we consider additional
the-
ory and evidence regarding value (Eccles, 1983, 1993; Wigfield
& Eccles, 1992).
Value
Like goals, value also concerns the reasons why students want,
or
do not want, to do something. Currently, the model used most
frequently to understand students' value is derived from Eccles
and Wigfield's work (Eccles, 1983, 1993; Eccles & Wigfield,
1995; Wigfield & Eccles, 1992). In their model, value encom-
passes students' perceptions of importance and utility as well as
interest in a given task. Importance refers to the importance of
doing well and is further defined as the extent to which perfor-
mance on a task allows an individual to confirm or disconfirm a
central part of his or her identity (Eccles, 1993; Pintrich &
Schunk, 2002). Utility refers to the usefulness of a task for stu-
dents in terms of future aspirations. Interest refers to intrinsic
rea-
sons students might engage in a task, such as enjoyment and
inherent challenge of a task. Several other theories have also
dis-
cussed the nature and consequences of interest and intrinsic
value
for engagement and performance on achievement tasks (e.g.,
Deci & Ryan, 2005). The students' quotations presented below
91. distinguish differences in how students value math and some of
the reasons why they value it.
It's [math tests are] not very important to me but I know it is
essen-
tial for me as I grow up so I just pay attention and do what I
need
to do now for later. (Cassie, female African American eighth
grader,
moderate math achiever, May 2004)
JANUARY/FEBRUARY 2007 7I
This content downloaded from 129.219.247.33 on Fri, 22 Jan
2016 19:21:43 UTC
All use subject to JSTOR Terms and Conditions
http://www.jstor.org/page/info/about/policies/terms.jsp
I know if I don't pass math I don't graduate and it is like very
serious because I know I want to graduate. (Regina, female
White
eighth grader, high achiever, May 2003)
It's somewhat important but it's somewhat, like I don't really
give that much thought to it . . . I want to do well because
I am in sports and you have to have good grades for eligibility.
(April, female White eighth grader, moderate achiever,
September 2003)
[Math tests] ... It's important because I need a good grade in
math.
(Owen, male White eighth grader, moderate math achiever,
September 2003)
92. Math is pretty close to my favorite subject. (Amanda, female
White
eighth grader, high achiever, April 2003)
Well, I want to be a doctor when I grow up and someone told
me
that doctors have to be pretty good at math. (Heidi, female
White
eighth grader, high achiever, September 2003)
I want to do well because I just love math so much. (Terah,
female
African American eighth grader, moderate math achiever,
January
2004)
Amanda characterizes math as her favorite subject, suggesting
that she values math as a discipline or content area, like Terah.
On the other hand, students who are successful or moderately
successful at math may value math and math test performance
for
different reasons, such as the consequences of performing
poorly.
For instance, Heidi's reasons for valuing math are related to her
career choice, a desire to be a physician, instead of an intrinsic
valuing, unlike Terah and Amanda. Cassie does not value math
tests much, although she thinks that she will need math later, so
she does pay attention and try.
Others students have more immediate concerns about math
test performance and consequences. Regina describes herself as
someone who sees math as "serious" because you have to pass
math to graduate. April does not value math or math tests much,
although she does want to do well so she can remain eligible for
93. sports. Owen thinks that math tests are important because he
wants a good grade in the subject. Unlike Amanda, Heidi,
Cassie,
Rebecca, and Owen value math in relationship to a consequence
instead of an intrinsic valuing of math.
As these students' responses suggest, students value math and
math test taking for a wide variety of reasons. The extent to
which
students value math and math test taking is also likely to be
related to their views about their math competence. In the next
section, we examine current research on self-concept.
Self-Concept
Research in achievement motivation distinguishes between
acad-
emic self-concept, domain self-concept (math self-concept or
English self-concept), and self-efficacy (task-specific self-
concept)
(Bandura, 1997; Bong & Clark, 1999; Pajares, 1996b; Schunk
& Pajares, 2001). Most individuals have a generalized view of
their competence in academics (academic self-concept) as well
as
more domain-specific beliefs about their competence (domain-
specific self-concept in English vs. math) (Bandura, 1997; Bong
& Clark, 1999; Pajares, 1996b; Schunk & Pajares, 2001). Math
self-concept has been linked to subsequent math grades and
math
standardized test scores (Eccles, 1983; Marsh & Yeung, 1998).
Furthermore, there are contradictions concerning the relation-
ships between math self-concept and academic outcomes.
Although female students' math grades were higher, their self-
94. reported math self-concepts and math test scores were lower
(1988 National Education Longitudinal Survey data; Marsh &
Yeung, 1998) than their male counterparts. The excerpts below
illustrate differences in students' math self-concepts.
Well, I'm really not good at math. ... I don't generally do well in
math even though I try. (Sarah, female White eighth grader,
mod-
erate math achiever, March 2003)
I know I know this stuff.... I'm usually confident about what I
am
doing in math. (Cassie, female African American eighth grader,
moderate math achiever, May 2004)
[I have ] the confidence of knowing that I usually do [score]
very
high [on math tests]. (Regina, female White eighth grader, high
achiever, May 2003)
Math is like my best subject, and I just listen in class and
remem-
ber everything. (Bill, male White eighth grader, moderate
achiever,
September 2003)
Math is annoying. ... I am not very good at it. ... I think math is
my worst subject so a test is a big deal. (Jeanette, female White
eighth grader, moderate math achiever, September 2003)
I do other tests better than math.... I am not that good at math.
It's not my best subject. (Norman, male African American
eighth
grader, moderate math achiever, January 2004)
95. Bill, Cassie, and Regina are confident about how good they are
at
mathematics. They are certain that they are very knowledgeable
about the math domain. Regina is sure that she will score very
high on math tests. All of these students engage math test taking
with a great deal of confidence, feeling very sure of themselves.
This is not the case for Sarah, Jeanette, and Norman. They do
not
see themselves as being able to do well. Instead, there is a mis-
match between their achievement levels (moderate) and how
they
see themselves performing on math tests (Ford, 1992). Although
Sarah works hard at math, she does not expect to do very well
on
math tests in spite of her efforts, because she does not see
herself
as good at math. Similarly, Jeanette and Norman do not see
themselves as "good" at math, in spite of the fact they are mod-
erate math achievers. As a consequence, they do not expect to
do
well on a math test. Furthermore, for Jeanette, a math test
becomes a significant challenge.
Students' math self-concepts are likely to be important in con-
sidering how individuals and groups of students engage the test-
taking process. In addition, individuals make more situation-
specific
assessments regarding their capabilities to successfully execute
behaviors to bring about certain outcomes, referred to as self-
efficacy (Bandura, 1997; Pajares, 1996b). Below, we distinguish
domain-specific self-concept from self-efficacy and review
litera-
ture on self-efficacy and math achievement.
Self-Efficacy
96. Individuals make more situation-specific assessments regarding
their capabilities to successfully execute behaviors to bring
about
certain outcomes, referred to as self-efficacy (Bandura, 1997).
As
described by Bandura (1986, 1997), self-efficacy is dynamic
and
81 EDUCATIONAL
RESEARCHER
This content downloaded from 129.219.247.33 on Fri, 22 Jan
2016 19:21:43 UTC
All use subject to JSTOR Terms and Conditions
http://www.jstor.org/page/info/about/policies/terms.jsp
evolves as an individual gains experience with a task. Students'
self-perceptions about math (e.g., math value and competence)
are likely to shape their self-efficacy when difficulty is experi-
enced. Students who are unsure about whether they can
complete
tasks will avoid them or give up more easily (Snow, Douglas, &
Corno, 1996). The excerpts below illustrate how math self-
efficacy
can influence students' test-taking performance, including some
of the strategies students use to maintain their self-efficacy in
the
face of difficulties.
Through other parts of it, I was reassured about the questions
that
I absolutely thought I knew so it kind of helped me feel better
about
97. the rest of it. (Sarah, female White eighth grader, moderate
math
achiever, March 2003)
[When taking the test] ... I was like oh, this is easy and then it
started to get harder. (Cassie, female African American eighth
grader, moderate math achiever, May 2004)
[When I saw those difficult problems], I figured I would get
them
wrong.... Yeah, because if I know I'm going to get them wrong I
just kind of think why bother trying. (April, female White
eighth
grader, moderate to high math achiever, September 2003)
When I don't know how to go about an answer [on a math test]
... I
try to be optimistic. I can start freaking out, getting frustrated,
or I can
be creative and try to create an answer... ifI find myself
frustrated, I'm
like "Stop and create a system" ... so I just find a way. (Maggie,
female
African American eighth grader, high math achiever, May 2004)
These just aren't hard at all. I kinda enjoy these. . . . I don't
know
they just seem kind of easy. (Shawn, male African American
eighth
grader, high math achiever, May 2004)
Well, at first I felt confident [about the math problem], but
when
I started not to get it I felt frustrated. (Susan, female African
American eighth grader, moderate math achiever, January 2004)