Cloud Automation Savings Calculator
•
0 likes•232 views

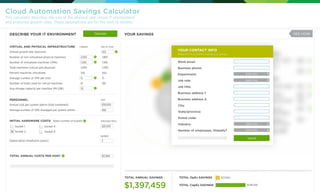
This calculator assessed the size of physical and virtual IT environments and projected growth rates for the next 12 months.

Recommended
Recommended
More Related Content
Viewers also liked
Viewers also liked (20)
Similar to Cloud Automation Savings Calculator
Similar to Cloud Automation Savings Calculator (20)
More from Jennifer Stern
More from Jennifer Stern (13)
Recently uploaded
Recently uploaded (20)
Cloud Automation Savings Calculator
- 1. TOTAL ANNUAL COSTS PER HOST YOUR CONTACT INFO Work email: Business phone: Department: Job role: Job title: Business address 1: Business address 2: City: State/province: Postal code: Industry: Number of employees, Globally? Select One Select One Select One Select One Please fill this out before viewing your savings. Submit $110,000 400 $20,500 VIRTUAL AND PHYSICAL INFRASTRUCTURE Select number of sockets PURCHASE PRICE COSTPERSONNEL INITIAL HARDWARE COSTS Socket 1 Socket 2 Socket 4 Socket 8 Annual cost per system admin (fully burdened) Average number of VMs managed per system admin $12,960 10% 2,000 1,800 1,000 1,500 3,000 3,300 33% 45% 15 15 67 100 50 CURRENT END OF YEAR Annual growth rate (percent) Number of non-virtualized physical machines Number of virtualized machines (VMs) Total machines (virtual and physical) Percent machines virtualized Average number of VMs per host Number of hosts used for virtual machines Avg storage capacity per machine VM (GB) 3 NUMBER Depreciation timeframe (years) Calculate Cloud Automation Savings Calculator This calculator describes the size of the physical and virtual IT environment and projected growth rates. These assumptions are for the next 12 months. DESCRIBE YOUR IT ENVIRONMENT YOUR SAVINGS SEE HOW TOTAL ANNUAL SAVINGS $1,397,459 TOTAL OpEx SAVINGS TOTAL CapEx SAVINGS $211,864 $1,185,595
- 2. INCREASE OPERATIONAL EFFICIENCY: OPTIMIZE RESOURCE UTILIZATION: ACCELERATE VIRTUAL DEPLOYMENTS 50% 80% 10% 10% 33% 10% Machines provisioned unnecessarily (CapEx) Machines over provisioned (CapEx) Average percent over provisioned (CapEx) Percent of temp. and perm. VMs that are inactive and could be reclaimed (CapEx & OpEx) Improvement in admin efficiency (OpEx) Percent of admin time spent on "service delivery" (OpEx) 5% Accelerate Virtual Server Deployments $751,704 $113,898 Automatically Reusing Remporary Resource TOTAL ANNUAL COSTS PER HOST $110,000 400 $20,500 VIRTUAL AND PHYSICAL INFRASTRUCTURE Select number of sockets PURCHASE PRICE COSTPERSONNEL INITIAL HARDWARE COSTS Socket 1 Socket 2 Socket 4 Socket 8 Annual cost per system admin (fully burdened) Average number of VMs managed per system admin $12,960 10% 2,000 1,800 1,000 1,500 3,000 3,300 33% 45% 15 15 67 100 50 CURRENT END OF YEAR Annual growth rate (percent) Number of non-virtualized physical machines Number of virtualized machines (VMs) Total machines (virtual and physical) Percent machines virtualized Average number of VMs per host Number of hosts used for virtual machines Avg storage capacity per machine VM (GB) 3 NUMBER Depreciation timeframe (years) Re-calculate Cloud Automation Savings Calculator This calculator describes the size of the physical and virtual IT environment and projected growth rates. These assumptions are for the next 12 months. DESCRIBE YOUR IT ENVIRONMENT YOUR SAVINGS SEE HOW SAVINGS ASSUMPTIONS TOTAL ANNUAL SAVINGS $1,397,459 TOTAL OpEx SAVINGS TOTAL CapEx SAVINGS $211,864 $1,185,595
- 3. Percent of virtual machines that are provisioned on an annual basis without appropriate business justification. The default value of 5% represents and average based on the customers we have worked with combined with input from industry analysts. ACCELERATE VIRTUAL DEPLOYMENTS 5% Accelerate Virtual Server Deployments $751,704 $113,898 Automatically Reusing Remporary Resource TOTAL ANNUAL COSTS PER HOST $110,000 400 $20,500 VIRTUAL AND PHYSICAL INFRASTRUCTURE PURCHASE PRICE COSTPERSONNEL Socket 1 Socket 2 Socket 4 Socket 8 Annual cost per system admin (fully burdened) Average number of VMs managed per system admin $12,960 10% 2,000 1,800 1,000 1,500 3,000 3,300 33% 45% 15 15 67 100 50 CURRENT END OF YEAR Annual growth rate (percent) Number of non-virtualized physical machines Number of virtualized machines (VMs) Total machines (virtual and physical) Percent machines virtualized Average number of VMs per host Number of hosts used for virtual machines Avg storage capacity per machine VM (GB) 3 NUMBER Depreciation timeframe (years) Assumptions: Initial hardware costs based on averages from Intel, VMware, and Microsoft virtualization savings calculators. Select number of socketsINITIAL HARDWARE COSTS Cloud Automation Savings Calculator This calculator describes the size of the physical and virtual IT environment and projected growth rates. These assumptions are for the next 12 months. DESCRIBE YOUR IT ENVIRONMENT YOUR SAVINGS SEE HOW INCREASE OPERATIONAL EFFICIENCY: OPTIMIZE RESOURCE UTILIZATION: 50% 80% 10% 10% 33% 10% Machines provisioned unnecessarily (CapEx) Machines over provisioned (CapEx) Average percent over provisioned (CapEx) Percent of temp. and perm. VMs that are inactive and could be reclaimed (CapEx & OpEx) Improvement in admin efficiency (OpEx) Percent of admin time spent on "service delivery" (OpEx) SAVINGS ASSUMPTIONS Re-calculate TOTAL ANNUAL SAVINGS $1,397,459 TOTAL OpEx SAVINGS TOTAL CapEx SAVINGS $211,864 $1,185,595
- 4. QUANTITATIVE SAVINGS: SERVICE DELIVERY IMPROVEMENTS: QUALITATIVE BENEFITS: SAVINGS $672,750 3 admins 5% of machines 10% of machines 10% of machines $692,350 $228,476 $1,327,321 $2,920,897 ASSUMPTIONS Weeks Weeks 80% improvement50% time Over provisioned by 30% 4 2 95% Improvements in operational efficiency Reduce machines provisioned unnecessarily Reduce over provisioning Reclaim inactive resources Total savings Current service delivery times Anticipated service delivery times Percent improvements Increase developer productivity by __% Reduce Application Development cycles by __% from ____ to ____ Enable new Business opportunity. Days Days Hours Hours Minutes Minutes TOTAL ANNUAL COSTS PER HOST $110,000 400 $20,500 VIRTUAL AND PHYSICAL INFRASTRUCTURE Select number of sockets PURCHASE PRICE COSTPERSONNEL INITIAL HARDWARE COSTS Socket 1 Socket 2 Socket 4 Socket 8 Annual cost per system admin (fully burdened) Average number of VMs managed per system admin $12,960 10% 2,000 1,800 1,000 1,500 3,000 3,300 33% 45% 15 15 67 100 50 CURRENT END OF YEAR Annual growth rate (percent) Number of non-virtualized physical machines Number of virtualized machines (VMs) Total machines (virtual and physical) Percent machines virtualized Average number of VMs per host Number of hosts used for virtual machines Avg storage capacity per machine VM (GB) 3 NUMBER Depreciation timeframe (years) Cloud Automation Savings Calculator This calculator describes the size of the physical and virtual IT environment and projected growth rates. These assumptions are for the next 12 months. DESCRIBE YOUR IT ENVIRONMENT SAVINGS ASSUMPTION SUMMARY YOUR SAVINGSRe-calculate SAVE TOTAL ANNUAL SAVINGS $1,397,459 TOTAL OpEx SAVINGS TOTAL CapEx SAVINGS $211,864 $1,185,595