
Recommended
More Related Content
What's hot
What's hot (20)
Viewers also liked
Viewers also liked (12)
Similar to Molly Reynolds presentation on Amendments in the Senate and House
Similar to Molly Reynolds presentation on Amendments in the Senate and House (15)
Recently uploaded
Recently uploaded (20)
Molly Reynolds presentation on Amendments in the Senate and House
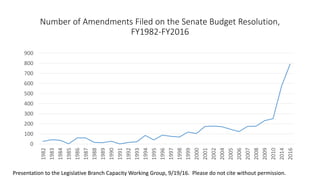
- 1. Number of Amendments Filed on the Senate Budget Resolution, FY1982-FY2016 0 100 200 300 400 500 600 700 800 900 1982 1983 1984 1985 1986 1987 1988 1989 1990 1991 1992 1993 1994 1995 1996 1997 1998 1999 2000 2001 2002 2004 2005 2006 2007 2008 2009 2010 2014 2016 Presentation to the Legislative Branch Capacity Working Group, 9/19/16. Please do not cite without permission.
- 2. Share of Symbolic Amendments on the Budget Resolution with Sponsors on Committee Handling Issue, FY1982-FY2016 0 0.1 0.2 0.3 0.4 0.5 0.6 0.7 0.8 0.9 1982 1983 1984 1985 1986 1987 1988 1989 1990 1991 1992 1993 1994 1995 1996 1997 1998 1999 2000 2001 2002 2004 2005 2006 2007 2008 2009 2010 2014 2016 % of Filed % of Proposed Notes: “Symbolic amendments” are sense of the Senate amendments and amendments creating Deficit Neutral Reserve Funds.
- 3. Average “Amendment Demand” Per Appropriations Bill, House, FY2004- 2017 0 20 40 60 80 100 120 2004 2005 2006 2007 2008 2009 2010 2011 2012 2013 2014 2015 2016 2017 “Amendment demand” is calculated by dividing the total number of amendments proposed on the floor (for bills considered under open rules) plus the total number of amendments filed with the Rules Committee (for bills considered under structured rules) by the total number of appropriations bills considered on the floor in each year. Blue dotted line removes an outlier (553 amendments filed on the FY2010 Defense Appropriations bills by then-Rep. Jeff Flake (R-AZ)) from the time series.