SlideShare a Scribd company logo
1 of 155
Download to read offline
Plastics to oil products
Final report
Plastic to oil IFM002 final report 2
Zero Waste Scotland works with businesses, individuals,
communities and local authorities to help them reduce waste,
recycle more and use resources sustainably.
Find out more at www.zerowastescotland.org.uk
Written by: Sam Haig, Liz Morrish, Roger Morton, Uchenna Onwuamaegbu, Peter Speller and Simon
Wilkinson
Plastic to oil IFM002 final report 3
Executive summary
The Zero Waste Plan published by the Scottish Government in 2010 sets targets of 70% of all waste to
be recycled and 5% to be landfilled by 2025. In order to help deliver this plan, The Waste (Scotland)
Regulations 2012 require that all dry recyclables are collected separately and that disposal of
separately collected dry recyclables to landfill or incineration is banned from 1 January 2014.
Plastic items that enter the waste stream are made in a wide range of formats and from a variety of
polymer types. According to the market research of material recovery facilities (MRFs), and other
waste-processing facilities, conducted as part of this project, there is currently around 18,000–27,000
tonnes per annum (tpa) of low-quality mixed waste plastic film in Scotland which cannot be recovered
by current mechanical recycling techniques. The bulk of this material is plastic film from commercial
and domestic packaging sources, and arises from municipal MRFs, with the remainder from
composting and anaerobic digestion facilities. It is estimated that this volume will increase to up to
50,000tpa as the Zero Waste Plan is implemented. There is the potential to use chemical and thermal
processing methods to recover these low-grade mixed waste plastics as useful materials.
The purpose of this report is to review the current state of development of processes for conversion of
mixed waste plastic to oil and to compare the technical, commercial and environmental potential of the
leading process options for implementation in Scotland. The report also reviews the regulatory and
fiscal issues relating to implementation of these technologies in Scotland and makes recommendations
for changes which could encourage uptake of these technologies.
Processes for conversion of plastics and other solid hydrocarbon materials to oil are not new.
Gasification and pyrolysis techniques for coal were commercialised in Germany during the Second
World War and developed further in South Africa during the Apartheid years. Plastic depolymerisation
techniques were developed actively during the 1980s and 1990s, but none was adopted commercially
as mechanical recycling methods developed rapidly. Over the past 10 years there has been an increase
in the amount of research into the conversion of plastic into oil, as oil prices have increased and waste
collection and sorting methods have improved. There are now several processes operating close to
commercial viability in different parts of the world.
The processes that have the most technical and commercial potential fall into three categories:
 fast gas phase pyrolysis to make synthetic crude oil mixtures;
 liquid-phase catalytic depolymerisation to make mixed distillates; and
 gasification, followed by chemical or biological synthesis, to make high-quality fuels.
The pyrolysis and catalytic depolymerisation processes are limited in scale by the need for external
heating of the material to be treated. This means that it is difficult to build these plants with a capacity
of more than about 1,000kg/h (approximately 8,000tpa) per individual process unit; for sites
processing larger tonnages, several units running in parallel are needed.
4 Plastic to oil IFM002 final report
These pyrolysis and catalytic depolymerisation processes have a relatively low capital cost and a
relatively high yield (60–70% of the feedstock is converted to a liquid). However, the quality of these
oil products is low and further processing is required to give a fuel product. Despite this, the high yield
improves the environmental and economic viability of these processes.
In comparison, gasification processes with downstream synthesis of high-quality fuels are much more
capital intensive, requiring larger economies of scale. These processes have lower product yields (30–
60% of the feedstock is recovered as a liquid fuel) but recover energy as electricity from the high-
pressure, high-temperature processes.
Although all of the processes considered in this report generate a positive operating income, only
pyrolysis, catalytic depolymerisation and gasification with biological conversion to ethanol are
financially viable, generating positive 10-year net present values (NPVs). These processes still generate
a positive NPV if the gate fee falls to £60 per tonne, which is expected as the market for energy from
waste in Scotland grows. Pyrolysis and catalytic depolymerisation generate a positive NPV at a gate fee
of zero. These economic assessments were based on capital cost numbers provided by technology
suppliers and as such may not reflect the actual capital required for a project. Capital was the biggest
sensitivity and hence further refinement in this area is required before the full economics are
understood.
The capital required for sufficient capacity to process 27,000tpa is of the order of £20–30M. Lower
capacities would require less investment, but the minimum economically viable capacity is estimated
to be between 12,000 and 16,000tpa. For pyrolysis and catalytic depolymerisation, this means that
installation of a single processing unit is unlikely to be viable.
The report concludes that for Scotland the best technical, environmental and commercial option is
likely to be one of the pyrolysis, liquid-phase catalytic depolymerisation or gasification with biological
conversion to ethanol processes. Versions of these processes can be found on a scale of 250–500kg/h
in the USA, Canada, Germany, Poland, Hungary and China.
There are still substantial technical risks involved in implementing one of these processes in Scotland.
None of the demonstration plants appears to be functioning fully commercially at present and there
will be particular challenges in collecting and preparing the Scottish mixed plastic waste materials to
suit the chosen process.
The quality of the oil produced by catalytic depolymerisation depends on the quality of the feedstock,
so it is not yet certain at which point the process could be introduced into the fuel supply chain. Test
work on Scottish feed material would be required to establish whether the material could be blended
directly into gasoline or diesel at low addition rates (the highest value option) or whether it would
need to be introduced to an oil refinery part-way through the crude oil treatment process, in which
case the selling price for the oil would have to be lower in order to compensate the refinery for its
additional processing costs.
Plastic to oil IFM002 final report 5
Additional capital costs at the refinery (e.g. for integration or risk mitigation) will also have an impact
on the economic viability of the process.
An analysis of the transport costs associated with proposed processing site networks shows that one
centralised site based in Grangemouth is the best option. This is dependent on there being a suitable
site close to the INEOS refinery that can feed the oil products to the refinery by pipeline, thereby
avoiding extra transport costs for the oil products.
The development of plastics-to-oil processes could be further encouraged by adjusting the regulatory
and fiscal incentives in order to provide similar incentives for oil and power generated from waste, by
advanced thermal conversion processes of the type reviewed in this report, to those (Renewable
Transport Fuels Obligation (RTFO), Feed-in Tariff (FiT), Renewable Heat Incentive (RHI)) that are
provided for power and liquid fuels produced from biogenic materials.
In particular, consideration should be given to:
 extending the incentives already available for biogenic waste materials to those waste materials that
are likely to be banned from landfill in Scotland, by applying RTFO to waste-derived oil products
and FiT and RHI to power and heat generated from the manufacturing processes involved in
producing oil products from plastics;
 working with the Scottish Environment Protection Agency (SEPA) to provide clear guidance on the
criteria by which plastic-to-oil processes could be determined as being energy or chemical
manufacturing processes rather than waste management processes (incineration or co-
incineration); and
 working with SEPA to provide clear guidance on the ‘end of waste’ for waste-derived oil products,
possibly by development of an appropriate quality standard.
In addition, this report recommends reducing the technical and commercial risk for potential project
promoters through the following measures:
 Practical trials should be conducted to demonstrate the quality and composition of the oils that
could be produced by one or more of the leading pyrolysis or catalytic depolymerisation processes
from low-grade waste plastic sourced in Scotland.
 Feasibility studies (desk based) should be carried out to determine the practically successful waste-
plastic-to-oil technologies to understand the technical capability, the energy integration and the
project integration of each with a specific end-use partner. Output should be a good estimation of
the capital expenditure needed and provide a good understanding of the technical risk and how it
can be mitigated.
 Research needs to be conducted to confirm the actual quantities of low-grade plastic film arising
from materials recycling facilities, composting facilities and anaerobic digestion plants.
 Studies are needed to fully assess the potential costs of registration of oil products under REACH
(Registration, Evaluation, Authorisation & restriction of Chemicals).
Plastic to oil IFM002 final report 6
Contents
1 Introduction ..............................................................................................................................14
1.1 Background...................................................................................................................... 14
1.2 Project objectives ............................................................................................................. 14
1.3 Project methodology......................................................................................................... 15
2 Literature review.......................................................................................................................16
2.1 Introduction..................................................................................................................... 16
2.2 Literature cited................................................................................................................. 17
2.3 Technology supplier survey ............................................................................................... 17
2.4 Scoring exercise ............................................................................................................... 18
2.5 Summary......................................................................................................................... 22
3 Waste plastics and end-product supply chain..........................................................................24
3.1 Background...................................................................................................................... 24
3.2 Plastic supply ................................................................................................................... 24
3.2.1 Household materials recovery facilities ................................................................... 26
3.2.2 Composting facilities............................................................................................. 28
3.2.3 Anaerobic digestion plants .................................................................................... 30
3.2.4 Others................................................................................................................. 31
3.2.5 Summary of potential feedstock sources................................................................. 31
3.2.6 Mapping of potential feedstock sources .................................................................. 31
3.2.7 Comparison of distributed and centralised sites for product delivery.......................... 32
3.2.8 Current waste management practices .................................................................... 36
3.2.9 Future trends....................................................................................................... 37
3.2.10 Summary – plastic supply ..................................................................................... 38
3.3 End markets for oil products.............................................................................................. 38
3.3.1 Current market for transport fuels.......................................................................... 38
3.3.2 Introducing plastic-derived crude oil to Grangemouth refinery .................................. 39
3.3.3 Introducing distilled oil products to Grangemouth refinery........................................ 39
3.3.4 Introducing drop-in fuels to the fuel distribution system........................................... 40
3.3.5 Heating fuels ....................................................................................................... 40
3.3.6 Future trends....................................................................................................... 41
3.3.7 Summary – markets for oil products....................................................................... 41
4 Review of process options for conversion of plastics into oil products ..................................42
4.1 Characteristics of plastics and oil products .......................................................................... 42
4.2 Pyrolysis.......................................................................................................................... 44
4.3 Catalytic depolymerisation................................................................................................. 49
4.4 Gasification to syngas....................................................................................................... 51
4.5 Fischer–Tropsch conversion of syngas to diesel products .................................................... 53
4.6 Syngas conversion to methanol and methanol to gasoline.................................................... 55
4.7 Biological conversion of syngas to ethanol.......................................................................... 57
4.8 Mass and energy balances................................................................................................ 58
4.8.1 Pyrolysis.............................................................................................................. 59
4.8.2 Catalytic depolymerisation..................................................................................... 60
4.8.3 Gasification to syngas ........................................................................................... 61
4.8.4 Fischer–Tropsch conversion of syngas to diesel products ......................................... 62
4.8.5 Syngas conversion to methanol and methanol to gasoline........................................ 63
4.8.6 Biological conversion of syngas to ethanol .............................................................. 64
4.9 Summary......................................................................................................................... 65
Plastic to oil IFM002 final report 7
5 Evaluation of business models..................................................................................................67
5.1 Base parameters for model................................................................................................ 67
5.1.1 Process basis ....................................................................................................... 67
5.1.2 Revenue.............................................................................................................. 67
5.1.3 Capital expenditure and financing options............................................................... 68
5.1.4 Operating expenditure .......................................................................................... 70
5.1.5 Working capital .................................................................................................... 71
5.1.6 Capex, opex and working capital phasing ............................................................... 71
5.1.7 Operating income and cash flow............................................................................ 72
5.1.8 Net present value................................................................................................. 72
5.2 Base case model results .................................................................................................... 73
5.2.1 Revenue and operating income.............................................................................. 73
5.2.2 Cash flow ............................................................................................................ 74
5.2.3 Net present value................................................................................................. 75
5.3 Model sensitivities............................................................................................................. 76
5.3.1 Feed buying price/gate fee.................................................................................... 76
5.3.2 Product selling price ............................................................................................. 79
5.3.3 Capex cost........................................................................................................... 81
5.3.4 Process performance ............................................................................................ 82
5.3.5 Installed capacity ................................................................................................. 83
5.4 Summary......................................................................................................................... 84
6 Environmental performance .....................................................................................................86
6.1 Functional units and system boundary................................................................................ 86
6.2 Allocation......................................................................................................................... 87
6.3 Data sources.................................................................................................................... 88
6.4 Results ............................................................................................................................ 88
7 Licensing and permitting ..........................................................................................................91
7.1 Environmental permitting .................................................................................................. 91
7.2 Waste Incineration Directive.............................................................................................. 92
7.3 End of waste.................................................................................................................... 93
7.4 REACH ........................................................................................................................... 94
7.5 Zero Waste Plan – 25% cap on energy-from-waste facilities................................................. 95
7.6 Summary......................................................................................................................... 96
8 Contamination issues................................................................................................................97
8.1 Feedstock composition ..................................................................................................... 97
8.2 Chlorine/polyvinyl chloride................................................................................................. 98
8.3 Polyethylene terephthalate ................................................................................................ 98
8.4 Water.............................................................................................................................. 99
8.5 Cellulose and biomass...................................................................................................... 99
8.6 Catalyst residues.............................................................................................................100
8.7 Animal by-products..........................................................................................................100
8.8 Impact of contamination ..................................................................................................101
8.9 Summary........................................................................................................................101
9 Barriers to development and levels of interest......................................................................103
9.1 Barriers to development ...................................................................................................103
9.1.1 Critical mass .......................................................................................................103
9.1.2 Unknown composition..........................................................................................103
9.1.3 Unproven technology...........................................................................................103
9.1.4 Incentives for biomass conversion ........................................................................104
9.1.5 Competition for feedstock ....................................................................................104
8 Plastic to oil IFM002 final report
9.1.6 Regulation ..........................................................................................................105
9.2 Levels of interest .............................................................................................................106
9.2.1 Waste producers .................................................................................................106
9.2.2 Oil producers ......................................................................................................106
10 Conclusions .............................................................................................................................107
10.1 Waste plastics supply chain ..............................................................................................107
10.2 Process options for conversion of plastic into oil products....................................................107
10.3 Financial assessment of process options and site................................................................108
10.4 Environmental assessment, licensing and permitting...........................................................109
10.5 Contamination issues .......................................................................................................109
10.6 Barriers to development and levels of interest ....................................................................110
11 Recommendations....................................................................................................................111
12 References...............................................................................................................................112
Appendix A: Literature review ............................................................................................................115
A.1. Pyrolysis .........................................................................................................................115
A.2. Catalytic depolymerisation................................................................................................126
A.3. Gasification to syngas ......................................................................................................129
A.4. Syngas fermentation........................................................................................................131
Appendix B: environmental impact assessment ................................................................................133
B.1. Background.....................................................................................................................133
B.2. Baseline case: mixed plastic wastes to landfill ....................................................................133
B.3. Alternative cases: mixed plastic waste thermal treatment to oil............................................134
B.4. The environmental assessment study ................................................................................139
B.5. Impact assessment..........................................................................................................149
List of Figures
Figure 1 Bale of handpicked Class C film ............................................................................................................................... 26
Figure 2 Scottish waste treatment sites that could potentially provide plastic film waste............................................................ 32
Figure 3 Amount of plastic film sent to each of the three sites annually for Option 4 (distributed network) ................................. 33
Figure 4 Cost of transporting material to and from processing sites for each option .................................................................. 35
Figure 5 Total distance travelled annually to deliver material to and from processing sites for each option.................................. 35
Figure 6 Atomic composition of fuels and plastics .................................................................................................................. 43
Figure 7 Formation of char, cyclic and polycyclic hydrocarbons or reactive groups .................................................................... 47
Figure 8 Pyrolysis mass and energy balance.......................................................................................................................... 59
Figure 9 Catalytic depolymerisation mass and energy balance................................................................................................. 60
Figure 10 Gasification to syngas mass and energy balance..................................................................................................... 61
Figure 11 F–T mass and energy balance............................................................................................................................... 62
Figure 12 Syngas conversion mass and energy balance ......................................................................................................... 63
Figure 13 Biological conversion of syngas to ethanol mass and energy balance........................................................................ 64
Figure 14 Annual revenue and operating income for the base case for each option .................................................................. 73
Figure 15 Projected base cash flows for each option.............................................................................................................. 75
Figure 16 10-year NPV (base case) for each option ............................................................................................................... 76
Figure 17 Sensitivity of operating income to changing feed buying price. Note that depolymerisation is hidden behind gasification
with biological processing as they have very similar values....................................................................................................... 77
Figure 18 Sensitivity of 10-year NPV to changing feed buying price......................................................................................... 78
Figure 19 Sensitivity of operating income to changing product selling price (dashed lines include increased income owing to no
refining costs)...................................................................................................................................................................... 80
Plastic to oil IFM002 final report 9
Figure 20 Sensitivity of 10-year NPV to changing product selling price (dashed lines include increased income owing to no refining
costs).................................................................................................................................................................................. 80
Figure 21 Sensitivity of 10-year NPV to changing capex cost .................................................................................................. 82
Figure 22 Sensitivity of operating income to changing reactor performance ............................................................................. 83
Figure 23 Sensitivity of 10-year NPV to changing installed capacity ......................................................................................... 84
Figure 24 Generic process diagram showing boundary limits .................................................................................................. 87
Figure 25 Carbon impact comparison for waste mixed plastic disposal options (including displacement savings).......................... 89
Figure 26 Net carbon impact comparison for waste mixed plastic disposal options.................................................................... 89
Figure 27 Scenario 1: life cycle of low-quality, mixed plastic waste sent to landfill .................................................................. 134
Figure 28 The life cycle of mixed plastic wastes converted to oils via pyrolysis ....................................................................... 135
Figure 29 The life cycle of mixed plastic wastes converted to oils via catalytic depolymerisation .............................................. 136
Figure 30 The life cycle of mixed plastic wastes converted to oils via gasification with F–T...................................................... 137
Figure 31 The life cycle of mixed plastic wastes converted to oils via gasification with methanol conversion to gasoline............. 138
Figure 32 The life cycle of mixed plastic wastes converted to oils via gasification with biological conversion of syngas to ethanol 139
Figure 33 Flow diagram showing the boundary of the baseline scenario ................................................................................ 141
Figure 34 Flow diagram showing the boundary for the pyrolysis process ............................................................................... 142
Figure 35 Flow diagram showing the boundary for the catalytic depolymerisation process....................................................... 143
Figure 36 Flow diagram showing the boundary for the gasification with F–T process .............................................................. 144
Figure 37 Flow diagram showing the boundary for the process of gasification with methanol conversion to gasoline ................. 145
Figure 38 Flow diagram showing the boundary for the process of gasification with biological conversion of syngas to ethanol.... 146
List of Tables
Table 1 Scoring system for identified technologies ................................................................................................................. 19
Table 2 Results of the scoring exercise.................................................................................................................................. 20
Table 3 Scottish household film waste arisings, 200912
........................................................................................................... 25
Table 4 Larger Scottish MRFs ............................................................................................................................................... 28
Table 5 Composting facilities in Scotland............................................................................................................................... 29
Table 6 Anaerobic digestion facilities..................................................................................................................................... 30
Table 7 Summary of plastic availability from existing Scottish waste treatment facilities............................................................. 31
Table 8 Variables used to calculate price per journey and number of journeys for waste film transport ....................................... 34
Table 9 Variables used to calculate the number of journeys for waste film transport ................................................................. 34
Table 10 Estimated future availability of plastic film from Scottish waste treatment facilities ...................................................... 37
Table 11 Plastic to oil conversion technologies....................................................................................................................... 44
Table 12 Plastics pyrolysis technology suppliers..................................................................................................................... 45
Table 13 Reported outputs from pyrolysis of plastic to oil products.......................................................................................... 46
Table 14 Advantages and challenges for pyrolysis of plastics to oil products............................................................................. 48
Table 15 Catalytic depolymerisation technology suppliers ....................................................................................................... 49
Table 16 Reported outputs of catalytic depolymerisation processes ......................................................................................... 50
Table 17 Advantages and challenges for catalytic depolymerisation......................................................................................... 50
Table 18 Typical outputs from a waste gasification process .................................................................................................... 51
Table 19 Gasification to syngas technology suppliers ............................................................................................................. 51
Table 20 Advantages and challenges for gasification of plastics to syngas................................................................................ 53
Table 21 F–T technology licensors........................................................................................................................................ 54
Table 22 Advantages and challenges for conversion of syngas to diesel by F–T........................................................................ 55
Table 23 Methanol technology licensors................................................................................................................................ 56
Table 24 Advantages and challenges for conversion of syngas to gasoline by MTG ................................................................... 56
10 Plastic to oil IFM002 final report
Table 25 Syngas fermentation technology licensors ............................................................................................................... 57
Table 26 Advantages and challenges for conversion of syngas to ethanol by fermentation ........................................................ 58
Table 27 Summary of gross output of oil products ................................................................................................................. 65
Table 28 Summary of price per unit from revenue items......................................................................................................... 67
Table 29 Capital cost summary ............................................................................................................................................ 68
Table 30 Estimated capex costs for each option..................................................................................................................... 69
Table 31 Breakdown of equity, lease and loan values for each project ..................................................................................... 70
Table 32 Heat, electricity, water and oxygen demands for each option .................................................................................... 70
Table 33 Material purchase and disposal costs....................................................................................................................... 70
Table 34 Fixed annual costs................................................................................................................................................. 70
Table 35 Estimated capex phasing schedules ........................................................................................................................ 72
Table 36 Income summary .................................................................................................................................................. 74
Table 37 Working capital required for each option (funded from equity) .................................................................................. 75
Table 38 Operating income values at given feed prices (all income values in 000s)................................................................... 78
Table 39 10-year NPVs at given feed prices (all NPVs in 000s) ................................................................................................ 78
Table 40 Break-even feed prices for each option (based on operating income and 10-year NPV)................................................ 79
Table 41 Break-even product prices for each option............................................................................................................... 81
Table 42 10-year NPVs at given capex scalings (all capex values and NPVs in 000s) ................................................................. 82
Table 43 10-year NPVs at given throughput rates (all NPVs in 000s)........................................................................................ 84
Table 44 GHG emissions and displacement for each technology................................................................................................ 90
Table 45 Estimated world consumption of plastic films, 200535
................................................................................................ 97
Table 46 Composition of residual mixed plastic film from various sources36
.............................................................................. 97
Table 47 Animal by-product categories ............................................................................................................................... 100
Table 48 GHG emissions for landfill .................................................................................................................................... 150
Table 49 GHG emissions for incineration ............................................................................................................................. 150
Table 50 GHG emissions for pyrolysis including displacement of diesel fuel production............................................................ 151
Table 51 GHG emissions for catalytic depolymerisation including displacement of diesel fuel production ................................... 152
Table 52 GHG emissions for gasification with F–T including displacement of diesel fuel production........................................... 153
Table 53 GHG emissions for gasification with methanol conversion to gasoline including displacement of gasoline fuel production
........................................................................................................................................................................................ 154
Table 54 GHG emissions for gasification with biological conversion of syngas to ethanol including displacement of gasoline fuel
production......................................................................................................................................................................... 155
Plastic to oil IFM002 final report 11
Glossary
Alkanes A class of saturated hydrocarbons with the chemical formula CnH(2n+2) that
are a major component of diesel fuels. This class includes methane, ethane,
propane, butane, octane, cetane, etc. Also known as paraffins.
Alkenes A class of unsaturated hydrocarbons with the chemical formula CnH2n that
are a component of road fuels. This class includes ethylene, propylene, etc.
Also known as olefines.
Anaerobic digestion A series of processes in which micro-organisms break down biodegradable
material in the absence of oxygen. The process releases biogas consisting
of methane, carbon dioxide and contaminants gases.
Animal by-products Entire bodies or parts of animals, products of animal origin or other
products obtained from animals that are not intended for human
consumption, as defined by Article 3 of Regulation EC 1069/2009.
Aromatics A class of hydrocarbons that have alternating double and single bonds
between carbon atoms, forming a ring. This class includes benzene,
toluene, xylene, etc. Also known as arenes or aryl hydrocarbons.
Carbon footprint A measure of the total amount of carbon dioxide (CO2) and methane (CH4)
emissions of a defined population, system or activity, considering all
relevant sources, sinks and storage within the spatial and temporal
boundary of the population, system or activity of interest.
Catalytic depolymerisation The breaking of long-chain polymers to oligomers and monomers
on the application of heat and a catalyst(s).
Composting A process of controlled biological decomposition of a mixture of organic
matter to produce a useful plant nutrient product.
Depolymerisation The process of breaking a polymer chain to a monomer or mixture of
monomers.
Devolatilisation The separation of volatile materials from solids or liquids.
Distillation A method of separating mixtures based on differences in volatilities of
components in a boiling liquid mixture.
12 Plastic to oil IFM002 final report
Energy from Waste (EfW) A process by which waste is thermally treated to produce energy in the
form of electricity and/or heat. It includes incineration and co-
incineration, pyrolysis and gasification technologies.
Eutrophication The enrichment of bodies of fresh water by inorganic plant nutrients (e.g.
nitrate, phosphate).
Fischer–Tropsch (F–T) A series of reactions that converts a mixture of carbon monoxide and
hydrogen gases to liquid hydrocarbons.
Gasification A process in which a solid fuel is reacted with a gasifying agent such as air,
oxygen or steam to produce a gaseous fuel containing hydrogen and
carbon monoxide.
Hydrocarbons An organic compound consisting entirely of hydrogen and carbon.
Life cycle assessment A technique to assess environmental impacts associated with all the stages
of a products life from cradle to grave.
Net present value (NPV) A measure of discounted cash inflow to present cash outflow which helps
to determine whether a prospective investment will be profitable.
Polymerisation Polymerisation is the process of reacting monomer molecules together to
form polymer chains or three-dimensional networks.
Pyrolysis A process involving the decomposition of organic materials on the
application of heat at an elevated temperature in the absence of oxygen.
Syngas (synthesis gas) These are product gases from reactions comprising carbon monoxide and
hydrogen in varying proportions.
Thermal degradation The molecular deterioration of a polymer as a result of overheating. Here,
the long-chain polymer begins to separate into several shorter chain
polymers. The shorter chain polymers then react with each other to bring
about a change in the polymer properties.
Plastic to oil IFM002 final report 13
Abbreviations
% wt Percentage, on a weight basis
Capex Capital expenditure
CHP Combined heat and power
IPC Integrated Pollution Control
M Month
MRF Materials recovery facility
MTG Methanol to gasoline
Opex Operating expenditure
PVC Polyvinyl chloride
Q Quarter
RTFO Renewable Transport Fuel Obligation
w/Bio With biological conversion of syngas to ethanol
w/F–T With Fischer–Tropsch conversion of syngas to diesel
w/MTG With conversion of syngas to methanol and then to gasoline (Methanol-to-Gasoline)
Y Year
Acknowledgements
Zero Waste Scotland, WRAP and Axion Consulting would like to thank all the individuals, companies
and organisations that provided information for this report for their cooperation and support.
14 Plastic to oil IFM002 final report
1 Introduction
1.1 Background
In 2010, the Scottish Government launched Scotland’s first Zero Waste Plan;1 this laid out several
challenging new measures, including a target recycling rate of 70% on all waste and a maximum of 5%
waste sent to landfill by 2025. In order to help deliver this plan, the Waste (Scotland) Regulations 2012
require that all dry recyclables are collected separately and that disposal of separately collected dry
recyclables to landfill or incineration is banned from 1 January 2014. In addition, the existing cap of
25% of household waste to energy from waste facilities will be replaced with a package of measures to
encourage waste prevention, reuse and recycling. In order to deliver these targets, reprocessing
options for previously landfilled waste must now be considered.
One of the most prevalent types of waste is plastic; it is estimated2 that, in 2009, 400,000–600,000
tonnes of plastic waste was disposed of in Scotland, more than 70% of which was landfilled or
incinerated. Recovering the majority of this material would be a significant boost in meeting recycling
targets.
Recovering plastic for direct reuse can be problematic because of the wide range of different plastic
types, applications and formats. This can result in a mixed, contaminated fraction that is unsuitable for
existing mechanical recycling methods, which rely on a relatively uncontaminated feed. Separating a
wide range of plastic types and formats can be difficult and costly to achieve. An alternative method is
to change the plastic mixture into a reusable product via a chemical process. As most plastic is
originally created from crude oil, the simplest and most ‘closed-loop’ solution is to create oil products
that can be reused either to make more plastic or as a fuel.
Zero Waste Scotland commissioned Axion Consulting to evaluate the various routes available to treat
waste plastics and create oil products, and to assess the Scottish plastic waste arisings that would be
available for such processes.
1.2 Project objectives
The key objectives of the project were as follows:
 literature review of the process options;
 assessment of the types and sources of available waste plastics, the supply chain for delivery of
these plastics and end markets for oil products;
 technological, financial and environmental assessment of selected processes;
 evaluation of the regulations surrounding the construction of a process; and
 investigation into barriers to development and current levels of interest.
Plastics to oil products_ZWS 15
1.3 Project methodology
A range of methodologies were employed to fulfil the objectives outlined above.
 Literature review of the process options: the first part of the review was carried out through
Internet research focused on key websites including those of universities, technology providers,
industry associations and research bodies, as well as more general web searches. Once key
processes were identified, the relevant companies and organisations were contacted directly to
discover as much information as possible about each option.
 Assessment of the types and sources of available waste plastics, the supply chain for delivery
of these plastics and end markets for oil products: a further literature review was carried out to
assess the volumes and types of waste plastic arising in Scotland. These volumes were traced back
to specific sources within Scotland through discussions with stakeholders in the waste recycling
supply chain (e.g. material recovery facilities (MRFs), waste transfer stations, etc.). A Microsoft
Excel-based model was used to assess the costs associated with transporting the waste to a variety
of processing locations across Scotland. Further discussions were held with end-market
stakeholders (e.g. refineries) to evaluate the potential for the oil products produced by the process.
 Technological, financial and environmental assessment of selected processes: a set of
Microsoft Excel -based models were used to calculate the performance of each process from
technical, financial and environmental standpoints; this included reaction modelling for the main
chemical processes, mass balance modelling, investment and payback calculations, and an
environmental assessment using data from the Carbon Trust’s Footprint Expert™ tool.
 Evaluation of the regulations surrounding the construction of a process: discussions were held
with the Scottish Environment Protection Agency (SEPA) to discuss how thermal and chemical
processes for the conversion of waste plastics into oil products would be regulated. This was
supplemented by the team’s existing knowledge of permitting, which is based on many previous
permit applications.
 Investigation into barriers to development and current levels of interest: existing Scottish
waste processors and other stakeholders were contacted directly to discover their level of interest
in the processes proposed in the report, and any potential issues or reservations they would have.
This information was considered in conjunction with any problems raised in the previous tasks,
such as technical or financial infeasibility, or problematic environmental effects.
16 Plastic to oil IFM002 final report
2 Literature review
2.1 Introduction
The recovery and recycling of plastic waste disposed of in landfill has been the subject of much effort
over the decades, as it is seen as a valuable resource and is high in the public’s perception of what
‘waste’ is. Progress has been made in the mechanical recycling of post-commercial, industrial and pre-
sorted post-consumer waste, but the recovery of value from low-grade mixed plastic waste has always
presented technical and economic difficulties.
The conversion of plastic into oil products requires the long polymer chains that are characteristic of
plastics to be broken into shorter chains typical of compounds present in crude petroleum. This
depolymerisation can be achieved by heating the materials to moderate or high temperatures, and
zeolite catalysts (such as those frequently used in oil refineries) are helpful in increasing the rate of
depolymerisation.
The basic processes of depolymerisation are pyrolysis, gasification and thermal cracking. All of these
processes have been in use in the coal, gas and petroleum refining industries for decades, and as such
can be considered to be mature technologies. The use of plastic as a feedstock for these processes has
been studied for 20 years, but its uptake has been limited by the relatively low price of oil and the lack
of a credible collection infrastructure for this low-density, disperse-source feedstock. During the 1990s
a series of demonstration plants were announced, only to disappear after a few years’ operation. It is
interesting to note that the majority of technology suppliers reported by Juniper in 20013 are no longer
active in this field, having run out of money or sold the technology to organisations with access to the
funds to continue process and project development.
More recently, the increased price of oil and incentives in the USA for energy and fuels from biomass
and waste have resulted in renewed activity in these areas. However, in the USA and Europe, there is a
preference for investment and government funding (in terms of research, development and final
projects) for processes using biomass as a feedstock rather than non-biogenic waste materials. The
main reasons for this are:
 The feedstock itself is more homogeneous, and therefore tends to create fewer process problems.
 There is an established collection mechanism, from either agricultural processing or forestry
operations.
 The feedstocks are considered to be truly renewable, so can attract incentives aimed at reducing the
impact of climate change, etc.
The recognition that waste plastic is a valuable resource has also energised research and development
activity in China and India. In Europe, the greater incentives for energy and fuel production from
renewable (‘biogenic’) feedstock materials have meant that research programmes in Europe are
concentrating on the conversion of biomass, although the technologies and principles could be adapted
for processing waste plastic.
Plastics to oil products_ZWS 17
2.2 Literature cited
A literature review of process options and technologies for converting waste plastics to oil products
was conducted. This was executed by Internet research directed at key websites, including those of
universities, technology providers, industry associations and research bodies, as well as more general
web searches.
Studies by Aguado et al,4 Schiers and Kaminsky,5 and the United Nations Environment Programme
(UNEP)6 indicated that four basic technologies were being offered as commercial plastic-to-oil-product
processes in 2000:
 fast pyrolysis to produce a synthetic crude oil;
 liquid-phase catalytic depolymerisation to produce a synthetic diesel grade fuel;
 gasification and Fischer–Tropsch synthesis to produce a synthetic diesel grade fuel; and
 gasification and fermentation to produce fuel-grade ethanol.
More recently, Butler et al7 provided a useful review of the current state-of-the-art processes for the
conversion of plastics to liquid fuels and identified 24 commercial processes for the conversion of
plastic into oil products. Many of these were reported as having an ‘unknown’ status, indicative of
technical or financial problems causing development to stop, but there is a number of processes that
still appear to be active.
The American Chemistry Council8 provides a useful review of plastic conversion to fuel processes in
the USA, identifying 12 North American technology providers and 11 from the rest of the world.
The US National Renewable Energy Laboratory is focused on the use of biomass as a potential
feedstock, as it represents a renewable feedstock, which waste plastic does not. However, the report
does provide useful information on biomass to liquid processes, including gasification with Fischer–
Tropsch synthesis to diesel,9 gasoline10 and ethanol.11
2.3 Technology supplier survey
From the above literature sources, and web-based searches, a total of 31 technology suppliers were
identified; the below information was gathered by reference to the suppliers’ websites, available
literature and telephone interviews with suppliers. Some technology manufacturers required a non-
disclosure agreement (NDA) before revealing information that would allow comparison of the
technical and economic performance of the technology. However, no NDAs were entered into for the
execution of this report.
The key information gathered included:
 the name of the technology supplier;
 the location of the technology supplier;
 whether the technology was specific to a particular feedstock type, and whether plastic was an
acceptable feedstock;
18 Plastic to oil IFM002 final report
 which sources of feedstock had been tested or demonstrated;
 whether the feedstock requires specific preparation before being used by the technology;
 how tolerant the technology is to contamination;
 where a catalyst is used, the consumption and lifespan demonstrated;
 the principal products from the technology;
 the residues and wastes produced by the technology;
 the typical yield from the technology, and how this varies with feedstock;
 the typical operating conditions of the process technology;
 the largest system currently operating; and
 the constraints on scale-up to larger systems.
The results of the review can be found in Appendix A.
2.4 Scoring exercise
The information gathered from the literature and technology supplier surveys has been scored on the
following basis:
 Scale of operation: whether the technology is at laboratory, demonstration or commercial scale.
Given the quantity of the low-grade waste plastic arisings in Scotland (discussed in section 3),
‘commercial scale’ is considered as being anything over 10,000 tonnes per annum (tpa).
 Extent of the technology demonstrated: whether the operational unit demonstrates the entire
integrated process from plastic to oil product, or one or more key stages.
 Feedstock: whether the technology has been successfully fed with low-grade waste plastic, higher-
grade waste plastic or other materials.
 Yield: the proportion of the feedstock converted to oil products, net of any used for process heating.
 Quality: whether the oil products are crude products requiring refining, blend components or
‘drop-in’ fuels.
 Capital cost of technology: the capital cost of the technology, in pounds per tonne per annum feed.
 Operating cost of technology: the operating cost of the technology, in pounds per tonne of feed.
 Demonstration operating hours: the number of running hours reported for the operational unit.
Table 1 shows the scoring system used for this exercise. Table 2 presents the results of the scoring
exercise.
Plastics to oil products_ZWS 19
Table 1 Scoring system for identified technologies
Score Scale (tpa of
feed)
Extent of
demonstration
Feedstock
demonstration
Yield (%
weight)
Product
quality
Capital cost
(per tpa)
Operating cost (per
tonne of feed)
Operating
period
9 Commercial
(> 10,000)
Identical to
commercial-scale plant
Full range of waste plastic > 90 Drop-in fuel < £500 < £50 > 5 years
7 Demonstration
(1,000–10,000)
Similar to commercial-
scale plant
Limited range of plastic > 70 Blend
component
£500–1,000 £50–100 2–5 years
5 Pilot
(100–1,000)
Parts of commercial-
scale plant
Relevant wastes
(municipal solid waste)
> 50 Mixed
distillate
£1,000–2,000 £100–200 1–2 years
3 Laboratory
(< 100)
Paper Non-plastic wastes > 30 Crude > £2,000 or
confidential
> £200 or
confidential
< 1 year
1 Paper None Paper < 30 N/A N/A N/A N/A
20 Plastic to oil IFM002 final report
Table 2 Results of the scoring exercise
Technology Supplier Scale Demonstration Feedstock Yield Quality Capex Opex Running
hours
Overall
score
Pyrolysis processes
Pyrolysis Agilyx 7 9 7 7 3 7 1 7 48
Catalytic pyrolysis Anhui Orsun Env Tech 7 9 7 5 9 3 7 9 56
Pyrolysis Blest 7 9 7 7 3 5 9 9 56
Microwave pyrolysis Climax Global Energy 7 9 5 7 3 7 7 1 46
Pyrolysis Cynar 7 9 7 5 9 5 5 7 54
Fast pyrolysis Dynamotive 9 5 1 7 3 1 7 5 38
Pyrolysis Envion 9 9 7 7 3 5 7 7 54
Catalytic pyrolysis Green Mantra 5 5 5 1 1 1 1 7 26
Catalytic pyrolysis KiOR 9 7 1 1 3 7 1 5 34
Pyrolysis/gasification Klean Industries 7 9 7 7 9 3 3 9 54
Catalytic pyrolysis Natural State Research 3 5 7 1 1 1 1 1 20
Pyrolysis Niutech Energy 9 9 7 1 1 1 1 1 30
Catalytic pyrolysis PARC 9 9 7 5 3 1 1 9 44
Catalytic pyrolysis Plastic2Oil 7 9 7 7 5 1 1 5 42
Pyrolysis Plastoil 7 9 7 1 1 1 1 5 32
Pyrolysis Polyflow 5 7 7 7 5 1 1 3 36
Pyrolysis Promeco 9 9 5 7 5 1 1 5 42
Catalytic depolymerisation processes
Catalytic
depolymerisation
Alphakat 7 9 5 7 5 1 3 5 42
Catalytic
depolymerisation
Kemia 7 9 7 7 3 1 1 1 36
Catalytic
depolymerisation
Recycle Energy Co 7 9 7 7 5 1 1 3 40
Catalytic
depolymerisation
T-Technology 7 9 7 5 3 1 1 7 40
Plastics to oil products_ZWS 21
Technology Supplier Scale Demonstration Feedstock Yield Quality Capex Opex Running
hours
Overall
score
Catalytic
depolymerisation
Ventana Cleantech 7 5 7 7 3 1 1 3 34
Catalytic
depolymerisation
Vuzeta 9 9 5 3 5 1 1 3 36
Gasification and synthesis processes
Gasification w/F–T Bioliq 7 7 1 1 9 9 3 5 42
Gasification w/F–T Choren 9 9 1 1 9 1 1 5 36
Gasification w/Bio Coskata 5 5 3 3 9 1 1 5 32
Gasification and ethanol
production (non-Bio)
Enerkem 9 9 1 3 9 7 1 9 48
Gasification w/Bio INEOS Bio 9 9 1 5 9 5 1 7 46
Gasification w/F–T Rentech 7 5 1 3 9 9 9 5 48
Gasification w/F–T ThermoChem Recovery
Intl
9 9 1 3 9 7 1 7 46
Gasification w/F–T Velosys 7 5 1 3 9 3 3 3 34
22 Plastic to oil IFM002 final report
These scores are not intended to give a ‘preferred’ technology option for the conversion of plastic to oil
products, but are indicative of ranking within each of the three classes of technology. The use of the
scores to differentiate between the three technology ‘groups’ in the table above should be treated with
caution; for example, some of the gasification processes are demonstrated at scale, but for biomass
rather than the target feedstock. Also, care should be taken with the capital expenditure (capex)
assessment: as NDAs were not signed with the technology suppliers, it was not possible to obtain full
details of the technologies. Capex numbers were obtained for each process but it is not clear what is
specifically included or excluded in these numbers. Accurate capex estimation will only be possible
when a target project is planned and all necessary equipment is identified.
In general, the pyrolysis processes tend to give good yields but produce a crude oil that needs further
refining before being suitable for use. Catalytic depolymerisation processes give similar yields to
pyrolysis and produce a mixture of distillates that requires less downstream processing to yield a
saleable product. Gasification followed by chemical synthesis produces oil products that are direct
replacements for fuels, but have much lower yields.
In terms of scale, the pyrolysis and catalytic depolymerisation technologies are limited by heat transfer
considerations such that a single processing vessel has a capacity of no more than 8,000–10,000tpa,
although a number of vessels can be connected in parallel to achieve higher throughputs. Gasification
processes do not have heat transfer limitations, and can achieve capacities in excess of 35,000tpa in a
single process train.
The gasification technology suppliers are more focused on the use of their technology for ‘biomass-to-
liquids’ processes, as biomass is currently the most attractive feedstock to them because it offers the
necessary scale of feedstock supply and opportunity for subsidies from the creation of ‘biogenic’ fuels
and oil products. As a result, they have limited data on the suitability of plastic waste as a feedstock
and have no demonstration plants routinely using waste plastics.
The pyrolysis and catalytic depolymerisation technology suppliers seem to be more open to the use of
non-biogenic feedstocks, especially those arising from industrial processes, and increasingly from
waste feedstock sources. However, none of these processes appears to be running at a commercial
scale with low-grade ‘non-recyclable’ waste plastics, which are the target feedstock in this report. In
general, these companies publish more information on the Internet and are more responsive at
interview, although some declined to provide information without an NDA being in place.
2.5 Summary
Processes for the conversion of plastics into oil products have been in development for over 20 years,
but the low cost of oil has prevented these from becoming economically feasible. Recent increases in
oil prices have caused a resurgence in interest in these technologies, within three basic classes of
technology: pyrolysis, catalytic depolymerisation and gasification followed by chemical or biological
synthesis.
Plastics to oil products_ZWS 23
A total of 31 process technology suppliers were examined by a combination of web survey, telephone
interview and e-mail correspondence. Each technology supplier was scored on the information
gathered. Pyrolysis and catalytic depolymerisation technologies scored well on product yield, but less
well on product quality. Conversely, gasification with synthesis technologies scored less well on yield,
but give a higher quality product.
Within each class, there are plants operating at, or close to, commercial scale. None of these
technologies has reached the stage where there are multiple commercial-scale operating plants. None
of the plants is reported as routinely running at commercial scale with low-grade ‘non-recyclable’
waste plastics, which are the target feedstock in this report.
24 Plastic to oil IFM002 final report
3 Waste plastics and end-product supply chain
3.1 Background
One aim of this project was to assess the potential feedstock material available for a plastic-to-oil
process.
There is already a well-established recycling network and infrastructure in both Scotland and the UK
as a whole for rigid plastics packaging. High-quality, high-value products can be obtained that are
suitable for manufacturing in their original or similar applications, for example high-density
polyethylene (HDPE) milk bottles.
The goal of a plastic-to-oil process within the scope of this project would not be to divert higher quality
plastic waste from this well-established and high-value recycling route, so alternative, as yet
unrecovered sources of waste plastics must be considered as potential feedstock material. The prime
example of waste plastic that may be suitable for a plastic-to-oil process is plastic film from the
municipal waste stream. As yet, there is no well-developed processing route for waste film from the
municipal waste stream, although there is an infrastructure for film waste from the agricultural and
commercial and industrial (C&I) sectors. Therefore, the remainder of this report will consider the main
infeed material to any plastics-to-oil process to be plastic film from the municipal waste stream.
3.2 Plastic supply
It is estimated12 that between 135,000 and 305,000 tonnes of film waste was generated in Scotland in
2009, less than half of which was recycled.
The wide range in this estimation is a result of C&I waste arisings, as there is a lack of data available on
this waste stream. However, it is believed13 that recycling of the C&I waste stream is very efficient; a
large proportion of the waste film produced from C&I sources is suitable for re-extrusion, either
directly or with minimal processing, whilst much of the remainder is exported from the UK for
reprocessing. A similar story can be seen with agricultural film, almost all of which is reprocessed in
the UK. To a lesser extent construction and demolition waste is also recycled, but on more of an ad hoc
basis because of the wide variability of the waste material in terms of quality and polymer type.
Therefore, the most promising source for a plastic-to-oil process is household/municipal film waste,
approximately 75,000 tonnes of which was produced in 2009.12 A breakdown of this film waste
arisings is shown in Table 3. There is currently very little post-consumer/household plastic film
recycling activity in Scotland and the UK as a whole.
Plastics to oil products_ZWS 25
Table 3 Scottish household film waste arisings, 200912
Household film waste arisings Quantity (tonnes)
Carrier bags 20,959
Bin bags 14,655
Plastic packaging 31,788
Other plastic film 7,073
Total plastic film 74,475
The properties and physical characteristics of films make it challenging to separate them from other
‘two-dimensional’ materials such as paper, and there is a large number of different film types that are
difficult to separate from each other. A particularly problematic issue is the existence of multi-layer
films, which consist of several different plastic types. Current film separation techniques (handpicking
or automated optical sorting) are able only to inspect the outer layer of the film and therefore cannot
distinguish between single- and multi-layer films.
For these reasons, where film recovery is undertaken it is with the object of cleaning up other streams,
in particular paper, for reprocessing. The strategies used for these clean-up operations result in low-
quality plastic film streams, often with contamination levels greater than 30%, producing what is
known as ‘Class C’ film. (Film grades range from 98:2 (98 is the percentage film and 2 is the percentage
contamination) to 70:30; film of lower quality than this is known as ‘Class C’.) An example of a typical
bale of Class C film is shown in Figure 1.
The ‘traditional’ waste management method for these streams has been export to China for manual
sorting and cleaning; however, China banned the import of household plastic film in 2006. Since that
date, anecdotal reports from the waste management industry indicate that the plastic film is now sent
directly to landfill or converted into refuse-derived fuel (RDF)/solid-recovered fuel (SRF) to be burned
for energy recovery in the Netherlands and other European countries. Meanwhile, in operations in
which no recovery is carried out, the film ends up in the residual stream and is also landfilled or
converted to RDF/SRF.
26 Plastic to oil IFM002 final report
Figure 1 Bale of handpicked Class C film
The target feedstock considered for this report is low-grade film that is too highly contaminated or
otherwise unsuitable for reprocessing and recycling. There are two major sources of this type of
material, namely MRFs sorting and processing municipal waste and composting facilities, although
other potential sources include process residues from anaerobic digestion facilities.
3.2.1 Household materials recovery facilities
The most desirable, currently available source of low-grade film (primarily polyolefin, low-density
polyethylene (LDPE), linear LDPE, HDPE, polypropene) is likely to be household MRFs. By the time this
type of film has been through the domestic collection and segregation system, it tends to be fairly
contaminated and is generally defined as 70/30 or Class C film. This material is not suitable for
mechanical reprocessing or extrusion.
It should be noted that MRFs specialising in C&I collections tend to generate higher quality baled film
(e.g. from blends of refuse sacks, shrink/pallet wrap). This material generally falls within 98/2, 90/10
or 80/20 categories/grades and is suitable for use within the existing UK reprocessing/extrusion
sector.
Plastics to oil products_ZWS 27
Table 4 lists a number of the larger MRFs in Scotland handling this type of municipal comingled
material, along with the recyclables input and the estimated arisings of low-grade film. This gives
arisings of 12,000tpa of low-grade film based on the listed MRF capacity of 645,000tpa (approximately
1.8%). This agrees with previous work14 that demonstrated that Scottish mixed dry recyclables
typically contain between 1% and 2% plastic film. SEPA’s estimate of the quantity of household waste
recycled in 200915 was 1,061,469 tonnes. Based on this, it is estimated that the MRFs in Scotland could
produce a total of 19,000 tonnes of Class C film per year which would potentially be available as
feedstock. Included in these figures is any material that may come from waste transfer stations and
household waste recycling centres, as the majority of their waste is baled up and delivered to the
nearest MRF for sorting and processing.
The requirement for separate collection of dry recyclables comes into effect in Scotland from January
2014, including a ban on the landfilling or incineration of separately collected dry recyclables.
According to SEPA,15 this will require the recycling of an additional 900,000tpa of household waste,
with a corresponding increase in recycling capacity. If this capacity is met by an increase in the number
of MRFs, total arisings of Class C film from household waste recycling could reach 35,000tpa. The extra
quantity recovered will depend on to what extent the definition of dry recyclables, in the guidance that
accompanies the regulations, includes plastic films, and whether local authorities are required or
choose to collect this type of material as dry recyclables.
28 Plastic to oil IFM002 final report
Table 4 Larger Scottish MRFs
Operator Site
Input
recyclate
capacity (tpa)
Type of MRF
Estimated
quantity of low-
grade film
(tpa)
Glasgow City Council Glasgow 80,000Dry household 2,000
Oran Environmental Grangemouth 50,000Dry household 1,000
SAISA – Stirling FibreKilsyth 50,000Dry household, C&I 300
SAICA – Securecycle Kirkcaldy 30,000Dry household, C&I 300
Shanks Glasgow 100,000Dry household, C&I 1,500
Shanks Broxburn 20,000C&I 200
Shanks Dumfries 80,000Mechanical biological treatment 2,000
SITA Aberdeen 50,000Dry household, C&I 1,000
SITA Perth 50,000Dry household, dirty 1,000
Viridor Bargeddie 100,000Dry household, C&I, dirty 2,000
William Tracey Linwood 25,000Dry household, C&I 500
William Tracey Broxburn 10,000C&I 200
Total 645,000 12,000
3.2.2 Composting facilities
Composting facilities are also potential sources of low-grade film suitable for reprocessing. Green
waste processed in composting facilities contains plastic film and non-film plastics (e.g. plant pots and
seed trays) that are heavily contaminated with organic material. These are undesirable components of
the composted material and are currently separated and sent for disposal in landfill at a cost of £80 per
tonne. This material is of too low quality to be reprocessed for higher quality/value end markets, and
thus would be a candidate feedstock for a plastic-to-oil-products process. These facilities may also
produce a certain amount of rigid plastic packaging which would also be suitable for processing in a
plastic-to-oil technology.
The segregation of plastic from the other compost contaminants (wood, metal) is not a routine
operation for the majority of facilities, but discussions with some operators who are starting to
perform this operation indicate that, for a 30,000tpa composting facility, up to 200tpa of waste film
could be recovered if there was a suitable end market.
Table 5 lists the composting facilities studied as part of this report. If each site recovers 0.67% of input
as waste film, 2,600tpa of low-grade plastic could be available for plastic-to-oil processes. In total it is
estimated that about 2,000–3,000 tpa of plastic film could be recovered from these plants.
Scotland’s Zero Waste Plan16 estimates total municipal arisings of green waste to be 431,000tpa, all of
which will need to be composted in order to comply with the ban on biodegradable waste being
disposed of to landfill. Given the total composting input capacity of 393,000tpa calculated in Table 5,
Plastics to oil products_ZWS 29
implementation of the Zero Waste Plan will have only a marginal impact on plastic arising from
composting facilities. In the longer term, the maximum low-grade plastic film arisings from composting
plants will remain at approximately 3,000tpa.
Table 5 Composting facilities in Scotland
Operator Postcode Input
capacity
(tpa)
Type of composting facility Estimated
quantity of low-
grade film (tpa)
Billy Bowie KA2 0BA 10,000In-vessel composting 70
Glasgow Fruit Market G21 2DU 1,700In-vessel compositing 10
GP Planscape G74 2LD 25,000In-vessel composting 170
Gray Composting ServicesAB45 2XS 5,000In-vessel composting 30
Keenan Recycling Ltd AB53 6YH 32,000In-vessel composting 210
Levenseat Organics AB53 6YH 20,000In-vessel composting 130
Scottish Water Horizons ML11 8EP 30,000In-vessel composting and windrow 200
TEG G68 9AZ 38,000In-vessel composting 250
AH Tucker EH55 8LJ 10,000In-vessel composting 70
William Munro IV16 9XJ 250In-vessel composting 2
Andrew Cook KY1 4DN 10,000Windrow 70
Angus Council DD8 2RL 11,200Windrow 80
Balmaghie Farm DG7 2AA 1,700Windrow 10
Barr Environmental KA18 2RB 18,200Windrow 120
Billie Bowie KA2 0BA 1,300Windrow 10
Binn Farm PH2 9PX 20,500Windrow 140
Dundee Council DD2 3JW 8,340Windrow 60
Falkirk Council EH51 0PU 6,500Windrow 40
Fife Council KY15 7LU 10,500Windrow 70
Fife Council KY12 0RX 21,000Windrow 140
FRM EH39 5PP 32,500Windrow 220
FRM G64 3QN 1,600Windrow 10
FRM EH39 5AH 8,000Windrow 50
Highland Council KW1 4TP 2,132Windrow 10
J Haig Hamilton & Son EH39 5LL 1,350Windrow 10
NPL Estates G2 1PB 4,000Windrow 30
Orkney Islands Council Orkneys 750Windrow 10
Seafield Park IV12 5RZ 15,306Windrow 100
Stirling Council FK7 7JW 12,400Windrow 80
West Lothian Recycling EH55 8DD 13,600Windrow 90
William Tracey KA15 1HZ 20,000Windrow 130
Total 393,000 2,630
30 Plastic to oil IFM002 final report
3.2.3 Anaerobic digestion plants
There is a number of anaerobic digestion plants in operation or under development in Scotland. These
handle food waste and have issues dealing with any associated plastic packaging, which appears as a
heavily contaminated waste stream before or after being processed by the digester. The plastic is
contaminated with up to 40% water, undigested organics, paper, card and compostable bin liners.
These facilities utilise automated de-packaging equipment before or after the waste is processed in the
digester, which removes plastic packaging but does leave it heavily contaminated. The contaminated
plastic is currently sent for disposal in landfill at a cost of £80 per tonne. This material is of too low
quality to be reprocessed into higher quality/value end markets, and therefore would be a candidate
feedstock for a plastic-to-oil-products process. However, the moisture and contamination content of
this potential feedstock means that it requires some pre-processing before it can be used by any of the
technologies considered in this report.
At present, the anaerobic digestion plants do not actively segregate plastic contaminants from the
wastes produced by the plant, but there are several development projects in progress that may be able
to generate a segregated plastics waste stream that could be suitable for plastics-to-oil processing.
No details of the actual quantities of low-grade plastic film arising from anaerobic digestion operations
are available at present, but assuming a quantity of 2% (confidential data held by Axion) of the food
waste feed gives the estimates in Table 6. The actual quantity will depend on the nature of the food
waste, as domestic food waste collections tend to have less packaging than those from food retail and
food manufacturing sources. Overall, anaerobic digestion plants could generate between 4,000 and
5,000tpa of low-grade plastic film suitable for conversion into oil products.
Scotland’s Zero Waste Plan16 estimates total municipal arisings of food waste to be 581,000tpa, all of
which will need to be processed by anaerobic digestion in order to comply with the ban on
biodegradable waste being disposed of to landfill. Given the total anaerobic digestion input capacity of
212,000tpa found in Table 6, implementation of the Zero Waste Plan will significantly increase the
quantity of plastic arising from anaerobic digestion plants. In the longer term, the maximum low-grade
plastic film arisings from anaerobic digestion plants could increase to 10,000–12,000tpa.
Table 6 Anaerobic digestion facilities
Operator Postcode Input capacity (tpa)Estimated quantity of low-grade film (tpa)
CNES H52 9JB 8,000 160
Heat and Power KW17 2DR 3,000 60
J&A Rennie AB53 8BP 20,000 400
Scottish Water HorizonsG68 9NB 30,000 600
Shanks G67 3EN 60,000 1,200
SSE KA24 4JJ 75,000 1,500
TEG PH2 9PX 16,000 320
Total 212,000 4,240
Plastics to oil products_ZWS 31
3.2.4 Others
There is a significant number of other post-industrial/post-consumer film waste streams that are
problematic and would benefit greatly from a secure, local outlet for contaminated non-rigid plastic
materials. These include:
 Food processors: blood-contaminated plastics, fish farm feed bags/liners.
 Construction and demolition sites: concrete sheeting (film), rubble bags.
 Sewerage works: plastic ‘debris’.
 Biodiesel processors: contaminated packaging.
 Agricultural: netting/bale/twine (not silage film/crop cover).
While the quantities and quality of these other sources has not been fully researched, it is believed that
a further 2,000–5,000 tonnes of film waste per annum could be available through these routes.
3.2.5 Summary of potential feedstock sources
In total, it is estimated that approximately 18,000–27,000tpa of low-grade plastic film waste is
currently available for reprocessing from MRFs, composting facilities and anaerobic digestion facilities.
This could be supplemented by up to 5,000tpa from other sources. This is in reasonable agreement
with the 24,000tpa estimated recently in a report for Zero Waste Scotland.17
The current position is summarised in Table 7.
Table 7 Summary of plastic availability from existing Scottish waste treatment facilities
Source Quantity (tpa)
Household MRFs 12,000–19,000
Composting facilities 2,000–3,000
Anaerobic digestion facilities 4,000–5,000
Others (not proven) 2,000–5,000
Total (with Others) 18,000–27,000 (20,000–32,000)
3.2.6 Mapping of potential feedstock sources
The sections above are not intended to be a full listing of potential feedstock sources, but they provide
a sensible basis on which to build an assessment of potential feedstock and test the viability of
processes for conversion of otherwise unrecyclable plastics into oil products.
The geographical spread of these sites is displayed in the Google Earth map shown in Figure 2. It can
be seen that the majority of MRFs, anaerobic digestion plants and composting facilities are located
around the Glasgow and Edinburgh areas. This is to be expected, as the vast majority of the Scottish
population is situated here.
32 Plastic to oil IFM002 final report
Figure 2 Scottish waste treatment sites that could potentially provide plastic film waste
The sites are split into six categories:
 MRFs are shown in green;
 anaerobic digestion plants are shown in light blue;
 composting facilities are shown in dark blue;
 waste transfer stations are shown in pink;
 household waste recycling centres are shown in white; and
 others are shown in yellow.
3.2.7 Comparison of distributed and centralised sites for product delivery
Using the information presented in the previous section, an analysis was carried out on how the
location and number of plastic processing sites would affect the costs of transporting the plastic film
waste from the locations where it is produced, and the cost of delivering the product to a refinery
(assumed, for the purposes of the analysis, to be INEOS’s refinery in Grangemouth). The scenarios
considered were:
 Option 1: A centralised site close to INEOS Grangemouth.
 Option 2: A centralised site in Barrhead, near Glasgow.
 Option 3: A centralised site near Aberdeen.
 Option 4: A distributed network consisting of the three sites above.
Driving distances were calculated for the routes between each film production location and each
processing site. For the three centralised options, it was assumed that all material would be delivered
directly from the locations where it was produced to the centralised site, while for the distributed
Plastics to oil products_ZWS 33
network option it was assumed that film would be sent to the closest site. The estimated amount of
material sent to each site annually for Option 4 is shown in Figure 3. It can be seen that more than half
the material is sent to Barrhead, with most of the remainder being sent to Grangemouth; the site in
Aberdeen, meanwhile, receives less than 5% of the total material. This is to be expected from looking
at Figure 2, which shows that only a few sites are in operation in the north of Scotland; the vast
majority of sites are located in the area around Glasgow and Edinburgh.
Figure 3 Amount of plastic film sent to each of the three sites annually for Option 4 (distributed network)
It was assumed that all film would be baled prior to delivery, with an average bale weight of 400kg,
and that each lorry could hold 48 bales. Using this value it is possible to calculate the number of
journeys required to deliver the waste film from each location to a particular site. The cost per journey
is calculated by assuming a fixed cost per journey of £225, and an additional cost per mile of £1.30; for
example, a 100-mile journey would cost £355 (£225 + £130).
The cost of transporting oil products from the production site to the Grangemouth refinery was
calculated in a similar way; however, the weight of material per journey was calculated differently as
the product is a liquid and is transported in a tanker. The volume of a tanker was assumed to be 38m3,
and, using estimated densities for each of the products, it was possible to calculate the weight of
product per journey. The total amount of product generated was calculated from the mass balance
modelling described in section 4.8.
An exception to this is the material produced at the Grangemouth site; as the site is close to the
refinery, it is assumed that the products would be taken to the refinery via a pipeline. Therefore there
is no transport cost associated with this transfer.
34 Plastic to oil IFM002 final report
The values discussed above are summarised in Table 8 and Table 9.
Table 8 Variables used to calculate price per journey and number of journeys for waste film transport
Fixed price per journey £225
Additional cost per mile £1.30
Number of baled pallets per lorry 48
Weight of film per pallet 400kg
Weight of material per lorry 19.2 tonnes
Table 9 Variables used to calculate the number of journeys for waste film transport
Volume of product per tanker 38m3
Diesel density 850kg/m3
Gasoline density 720kg/m3
Ethanol density 790kg/m3
The total annual cost for each route (film production location to processing site and processing site to
refinery) was calculated by multiplying the number of journeys per year by the cost per journey; the
costs for all the routes were then summed to give the total cost for the option.
These calculations are summarised in Figure 4 and Figure 5, which show the annual cost and distance
travelled, respectively, to transport material to and from the processing sites for each option. Note that
these values have been calculated using the pyrolysis process, but all other processes show the same
qualitative results.
Plastics to oil products_ZWS 35
Figure 4 Cost of transporting material to and from processing sites for each option
Figure 5 Total distance travelled annually to deliver material to and from processing sites for each option
36 Plastic to oil IFM002 final report
It can be seen immediately that Option 3 is by far the worst option in terms of both cost and total
distance travelled. This is to be expected, as the majority of the material would be transported from the
Glasgow/Edinburgh area up to Aberdeen for processing and then back down to Grangemouth for
refining, resulting in a significant amount of ‘double handling’ of the material that arises close to the
final destination (the refinery).
The transport costs for film delivery for Options 1, 2 and 4 are very similar; however, there are large
differences in the cost of oil delivery, with Option 2 having the largest overall cost, followed by Option
4.
Option 4 gives the shortest total distance travelled, even including oil delivery; this is because each
location where film waste is produced can choose to deliver to the closest processing site. However, as
shown in Figure 3, this results in the Aberdeen site receiving only 820tpa; this annual tonnage is not
likely to be economically viable for any of the options considered in this report.
Based on both cost and total distance travelled, therefore, one centralised site based in Grangemouth is
the best option. This is dependent on there being a suitable site close to the INEOS refinery that can
feed the oil products to the refinery by pipeline, thereby avoiding extra transport costs. However, it
may be beneficial to introduce a network of local collection sites where waste plastic can be aggregated
before delivery to the processing site in bulk. This will be particularly useful in capturing material from
operators who either do not produce enough material to justify a dedicated transport service or do not
have the space to store waste material until there is enough of it to transport.
3.2.8 Current waste management practices
Currently there are no reprocessing routes for low-grade mixed film in Scotland. The material that is
segregated and baled by MRFs and other producers has three destinations:
 export to Asia (currently restricted because of export regulations, typically at a cost of £0–30 per
tonne collected);
 export to the Netherlands as RDF/SRF, with a typical gate fee of £60 per tonne plus transport; and
 landfill, with a typical gate fee of £80 per tonne plus transport.
The ‘traditional’ outlet (over the last 10–20 years) has been export to Asia and, effectively, has been a
‘zero disposal cost’ outlet. With this no longer available in the same manner, the ‘standard’ route is
now export as RDF/SRF to energy from waste (EfW) facilities in mainland Europe, which certainly has
the capacity to handle all the material of this type generated in Scotland. For example, the Netherlands
has an EfW capacity of 6.8 million tonnes of waste per annum. However, there is a significant cost
penalty and a typical medium-sized MRF in Scotland will be incurring costs in excess of £100K per
annum for disposal of low-grade mixed film through EfW. The additional complications associated with
trans-frontier movement of waste, create uncertainties over shipments and can make local landfill a
preferred option.
Plastics to oil products_ZWS 37
3.2.9 Future trends
As discussed in the preceding sections, Scotland’s Zero Waste Plan will increase the quantities of
household and other waste being processed by MRFs, composting facilities and anaerobic digestion
facilities. This will cause a corresponding increase in the quantities of low-quality plastic film available
for conversion to oil products. The future availability is summarised in Table 10.
Table 10 Estimated future availability of plastic film from Scottish waste treatment facilities
Source Quantity (tpa)
Household MRFs 35,000
Composting facilities 3,000
Anaerobic digestion facilities 12,000
Others (not proven) 5,000
Total (with Others) 50,000 (55,000)
The predictions of future arisings assume that the proportion of packaging film associated with
household recyclables sent to MRFs and food waste sent to anaerobic digestion facilities remains at its
current level. It should be noted that WRAP and others are investigating opportunities for reducing the
quantity of packaging associated with food and consumer products. This may mean that the future
availability of low-grade plastic film from these sources is overestimated in the table above. However,
the table above does not include the additional potential for low-grade plastic film arisings from C&I
MRFs or anaerobic digestion facilities processing food waste from food manufacturers or back of store.
As existing landfill capacity for non-hazardous waste is of the order of 16 years, Scotland’s Zero Waste
Plan has a target of less than 5% of municipal waste to be sent to landfill by 2025. There will be
increasing pressure on waste management companies not to use local landfill, by implementation of
landfill bans and the increase in landfill tax to £80 per tonne in 2014.
There is a large number of EfW developments proposed for Scotland, with total capacity that exceeds
the current 25% cap on local-authority-collected waste treated in EfW plants. The introduction of
proposed EfW plants in Scotland will offer an alternative disposal route for low-grade mixed film (and
for RDF/SRF) when and if they come on stream. Therefore, a Scotland-based plastics-to-oil-products
plant will need to demonstrate a lower operational gate fee than local EfW facilities for it to be viable.
It is not clear whether the thermal processes for converting otherwise unrecyclable plastic to oil
products will be considered as constituting EfW by the Scottish Government – this question is
discussed further in section 7.5.
Clearly any plant/process/technology based in Scotland that can offer a competitive gate fee will
attract material. Economics will be the driver and this highlights the need for any proposed project to
gain efficiencies by being integrated within an existing chemicals/materials processing facility
38 Plastic to oil IFM002 final report
(preferably in a ‘government-assisted area’) where, in addition to services being shared, output
streams can achieve highest potential value.
3.2.10Summary – plastic supply
It is estimated that the quantity of low-grade waste plastic film currently available in Scotland is
between 18,000 and 27,000tpa. The majority of this arises from MRFs processing municipal household
recyclates, with additional material from composting and anaerobic digestion facilities. Currently, this
material is landfilled, exported to Europe as SRF/RDF or exported to Asia for recycling (although the
latter is becoming increasingly more difficult).
The implementation of Scotland’s Zero Waste Plan will increase the material processed by MRFs,
composting facilities and anaerobic digestion facilities such that the quantity of material available for
conversion to oil products reaches 50,000tpa. There may be increasing competition for this material as
the number of ‘conventional’ EfW plants in Scotland increases.
An analysis of the transport costs associated with proposed processing site networks shows that one
centralised site based in Grangemouth is the best option. This is dependent on there being a suitable
site close to the INEOS refinery that can feed the oil products to the refinery by pipeline, thereby
avoiding extra transport costs for the oil products.
3.3 End markets for oil products
3.3.1 Current market for transport fuels
The 2009 Department of Energy & Climate Change assessment of sub-national road transport fuel
consumption estimates Scottish consumption of gasoline at 1.18 million tonnes per year, with diesel
fuel consumption at 1.83 million tonnes per year. The majority of this is sold via Scotland’s network of
over 900 fuel forecourts, with a number of owners, including the major oil companies and
supermarkets.
Despite this diversity, the majority of transport fuel in Scotland is sourced from INEOS’s Grangemouth
oil refinery, which has an annual output of around 8 million tonnes of finished oil products, of which
approximately 1 million tonnes is gasoline and 1.8 million tonnes is diesel fuel. Some finished products
are imported by ship to marine terminals on the River Clyde, and at other locations, and distributed by
independent fuel traders, but these serve less than 25% of Scotland’s road transport fuel requirements.
Other than the addition of biofuels (ethanol and biodiesel) at these terminals, no fuel blending
operations exist other than at Grangemouth. Northburn Industrial Services operates Scotland’s only
facility for the manufacture of processed fuel oil from waste oil with a capacity of 25,000tpa, although
this facility does not make transport fuels. Argent Energy at Motherwell produce up to 45,000tpa of
biodiesel from tallow and used cooking oil – this is approximately 50% of the total biodiesel required
in Scotland to meet the Renewable Transport Fuel Obligation (RTFO).
Plastics to oil products_ZWS 39
The potential scale of a plastic-to-oil-products industry in Scotland is unlikely to have a significant
impact on the existing oil refining, oil recovery or biodiesel industry in Scotland.
Changes in vehicle type, vehicle use and engine efficiency mean that diesel is generally in short supply
and gasoline long, especially in north-west Europe where refineries are predominantly configured for
gasoline production. In this context, a process for converting currently unrecyclable plastic waste to a
diesel-type product would be more attractive than a similar process to obtain gasoline or ethanol.
A number of options exist to introduce oil products produced from plastic into the transport fuel
supply chain:
 Introduce a plastic-derived crude oil into the Grangemouth refinery.
 Introduce distilled oil products into the fuel blending pool at the Grangemouth refinery.
 Introduce drop-in fuels meeting the specifications of EN590 (diesel) or EN228 (gasoline) into the
fuel distribution chain.
3.3.2 Introducing plastic-derived crude oil to Grangemouth refinery
The plastic-derived crude oil products from pyrolysis or catalytic depolymerisation could be added to
the feedstock currently used at the Grangemouth refinery. Although the quantity of oil introduced is
very much smaller than the 9 million tonnes of geological crude oil processed by the refinery each year,
refineries are highly tuned integrated systems, optimised to process a particular feedstock (in this case
chiefly crude oil from the North Sea). Small changes in composition or the introduction of unusual
contaminants can upset the operation of the plant.
The introduction of plastic-derived crude to the crude distillation unit has been considered and
rejected by INEOS on the grounds that unsaturated hydrocarbons would upset product quality and
oxygenates would increase gum formation and fouling of the crude preheater train.
A better option would be to introduce the plastic-derived crude to a catalytic cracking unit as this may
have less of an impact on the downstream processes. The principal concerns raised by INEOS with this
option were the possible presence of metals that would poison the catalyst and the impact of the
presence of oxygenates in the unit. These concerns would need to be allayed before proceeding further.
It may be possible, with INEOS, to identify a way to close-couple a plastic-derived crude into the
refinery, but this would come at a cost: in the form of increased project capex, which would need to be
included in the overall project economics.
3.3.3 Introducing distilled oil products to Grangemouth refinery
At an oil refinery, the production of finished fuel products (diesel, petrol, aviation fuel, etc.) is
optimised by blending a number of distilled products from various parts of the refinery such that the
final product meets the relevant fuel specification. These distilled products are known as blendstocks.
Depending on the technology supplier, processes for the conversion of plastic into oil products either
incorporate distillation in the process or produce a plastic-derived crude oil that would need to be
distilled in a separate facility. In either case, the distilled plastic-derived oil could meet the finished fuel
specification, but is more likely to be useful to the refinery as a blendstock.
Plastics to oil report

More Related Content

What's hot

PLAST2bCLEANED project presentation
PLAST2bCLEANED project presentationPLAST2bCLEANED project presentation
PLAST2bCLEANED project presentationMarianilla82
 
Flare reduction projects - issues underlying limited uptake - Steve Ross (SGS)
Flare reduction projects - issues underlying limited uptake - Steve Ross (SGS)Flare reduction projects - issues underlying limited uptake - Steve Ross (SGS)
Flare reduction projects - issues underlying limited uptake - Steve Ross (SGS)Esther Petrilli-Massey
 
Kjetil Bøhn, CEO, Quantafuel | Kemisk genanvendelse af plast
Kjetil Bøhn, CEO, Quantafuel | Kemisk genanvendelse af plastKjetil Bøhn, CEO, Quantafuel | Kemisk genanvendelse af plast
Kjetil Bøhn, CEO, Quantafuel | Kemisk genanvendelse af plastPlastindustrien
 
Cleaner Production Assessment-(Improved by Minura)
Cleaner Production Assessment-(Improved by Minura)Cleaner Production Assessment-(Improved by Minura)
Cleaner Production Assessment-(Improved by Minura)Minura Jinadasa
 
RCRA Beneficial Use by Kathy Flippin, MDNR, and Dale Guariglia, Bryan Cave, a...
RCRA Beneficial Use by Kathy Flippin, MDNR, and Dale Guariglia, Bryan Cave, a...RCRA Beneficial Use by Kathy Flippin, MDNR, and Dale Guariglia, Bryan Cave, a...
RCRA Beneficial Use by Kathy Flippin, MDNR, and Dale Guariglia, Bryan Cave, a...Kevin Perry
 
Sustainability in Cement Industry | Rakesh Bhargava, Chief Climate & Sustaina...
Sustainability in Cement Industry | Rakesh Bhargava, Chief Climate & Sustaina...Sustainability in Cement Industry | Rakesh Bhargava, Chief Climate & Sustaina...
Sustainability in Cement Industry | Rakesh Bhargava, Chief Climate & Sustaina...Cairn India Limited
 
Alternative Fuel Market After Covid-19 – Focus on Efficiency and Quality
Alternative Fuel Market After Covid-19 – Focus on Efficiency and QualityAlternative Fuel Market After Covid-19 – Focus on Efficiency and Quality
Alternative Fuel Market After Covid-19 – Focus on Efficiency and QualityLOESCHE
 
Waste tyre pyrolysis plant
Waste tyre pyrolysis plantWaste tyre pyrolysis plant
Waste tyre pyrolysis plantseo123
 
Modern waste management concept e
Modern waste management concept eModern waste management concept e
Modern waste management concept eAndreas Thoma
 
Feb 20 landsmiths and sentinel presentation to haryana government
Feb 20    landsmiths and sentinel presentation to haryana governmentFeb 20    landsmiths and sentinel presentation to haryana government
Feb 20 landsmiths and sentinel presentation to haryana governmentAjaypal s Randhawa
 
PGMs Recovery using Secondary Raw Materials-Brochure-large
PGMs Recovery using Secondary Raw Materials-Brochure-largePGMs Recovery using Secondary Raw Materials-Brochure-large
PGMs Recovery using Secondary Raw Materials-Brochure-largeJokin Hidalgo
 
Tyre Recycle Machine by GLOBALTECH ENERGY RESOURCES ( MALAYSIA)
Tyre Recycle Machine by GLOBALTECH ENERGY RESOURCES ( MALAYSIA)Tyre Recycle Machine by GLOBALTECH ENERGY RESOURCES ( MALAYSIA)
Tyre Recycle Machine by GLOBALTECH ENERGY RESOURCES ( MALAYSIA)kentchih
 
Environmental lean six_sigma_case_studies
Environmental lean six_sigma_case_studiesEnvironmental lean six_sigma_case_studies
Environmental lean six_sigma_case_studiesbillclintonvn
 
International Journal of Engineering and Science Invention (IJESI)
International Journal of Engineering and Science Invention (IJESI)International Journal of Engineering and Science Invention (IJESI)
International Journal of Engineering and Science Invention (IJESI)inventionjournals
 

What's hot (20)

PLAST2bCLEANED project presentation
PLAST2bCLEANED project presentationPLAST2bCLEANED project presentation
PLAST2bCLEANED project presentation
 
Flare reduction projects - issues underlying limited uptake - Steve Ross (SGS)
Flare reduction projects - issues underlying limited uptake - Steve Ross (SGS)Flare reduction projects - issues underlying limited uptake - Steve Ross (SGS)
Flare reduction projects - issues underlying limited uptake - Steve Ross (SGS)
 
Kjetil Bøhn, CEO, Quantafuel | Kemisk genanvendelse af plast
Kjetil Bøhn, CEO, Quantafuel | Kemisk genanvendelse af plastKjetil Bøhn, CEO, Quantafuel | Kemisk genanvendelse af plast
Kjetil Bøhn, CEO, Quantafuel | Kemisk genanvendelse af plast
 
Cleaner Production Assessment-(Improved by Minura)
Cleaner Production Assessment-(Improved by Minura)Cleaner Production Assessment-(Improved by Minura)
Cleaner Production Assessment-(Improved by Minura)
 
RCRA Beneficial Use by Kathy Flippin, MDNR, and Dale Guariglia, Bryan Cave, a...
RCRA Beneficial Use by Kathy Flippin, MDNR, and Dale Guariglia, Bryan Cave, a...RCRA Beneficial Use by Kathy Flippin, MDNR, and Dale Guariglia, Bryan Cave, a...
RCRA Beneficial Use by Kathy Flippin, MDNR, and Dale Guariglia, Bryan Cave, a...
 
Liquid transportation fuels via large scale fluidised bed gasification of lig...
Liquid transportation fuels via large scale fluidised bed gasification of lig...Liquid transportation fuels via large scale fluidised bed gasification of lig...
Liquid transportation fuels via large scale fluidised bed gasification of lig...
 
Sustainability in Cement Industry | Rakesh Bhargava, Chief Climate & Sustaina...
Sustainability in Cement Industry | Rakesh Bhargava, Chief Climate & Sustaina...Sustainability in Cement Industry | Rakesh Bhargava, Chief Climate & Sustaina...
Sustainability in Cement Industry | Rakesh Bhargava, Chief Climate & Sustaina...
 
PCI028_051 DuPont
PCI028_051 DuPontPCI028_051 DuPont
PCI028_051 DuPont
 
Alternative Fuel Market After Covid-19 – Focus on Efficiency and Quality
Alternative Fuel Market After Covid-19 – Focus on Efficiency and QualityAlternative Fuel Market After Covid-19 – Focus on Efficiency and Quality
Alternative Fuel Market After Covid-19 – Focus on Efficiency and Quality
 
Waste tyre pyrolysis plant
Waste tyre pyrolysis plantWaste tyre pyrolysis plant
Waste tyre pyrolysis plant
 
Cleaner Production
Cleaner ProductionCleaner Production
Cleaner Production
 
Polyflow
Polyflow Polyflow
Polyflow
 
Modern waste management concept e
Modern waste management concept eModern waste management concept e
Modern waste management concept e
 
Feb 20 landsmiths and sentinel presentation to haryana government
Feb 20    landsmiths and sentinel presentation to haryana governmentFeb 20    landsmiths and sentinel presentation to haryana government
Feb 20 landsmiths and sentinel presentation to haryana government
 
PGMs Recovery using Secondary Raw Materials-Brochure-large
PGMs Recovery using Secondary Raw Materials-Brochure-largePGMs Recovery using Secondary Raw Materials-Brochure-large
PGMs Recovery using Secondary Raw Materials-Brochure-large
 
Tyre Recycle Machine by GLOBALTECH ENERGY RESOURCES ( MALAYSIA)
Tyre Recycle Machine by GLOBALTECH ENERGY RESOURCES ( MALAYSIA)Tyre Recycle Machine by GLOBALTECH ENERGY RESOURCES ( MALAYSIA)
Tyre Recycle Machine by GLOBALTECH ENERGY RESOURCES ( MALAYSIA)
 
Environmental lean six_sigma_case_studies
Environmental lean six_sigma_case_studiesEnvironmental lean six_sigma_case_studies
Environmental lean six_sigma_case_studies
 
Prof. Richard Eckard
Prof. Richard EckardProf. Richard Eckard
Prof. Richard Eckard
 
Assessment and implementation of cleaner production practices in petroleum lu...
Assessment and implementation of cleaner production practices in petroleum lu...Assessment and implementation of cleaner production practices in petroleum lu...
Assessment and implementation of cleaner production practices in petroleum lu...
 
International Journal of Engineering and Science Invention (IJESI)
International Journal of Engineering and Science Invention (IJESI)International Journal of Engineering and Science Invention (IJESI)
International Journal of Engineering and Science Invention (IJESI)
 

Similar to Plastics to oil report

An Integrated Approach to Alternative Fuel use in Cement Making
An Integrated Approach to Alternative Fuel use in Cement MakingAn Integrated Approach to Alternative Fuel use in Cement Making
An Integrated Approach to Alternative Fuel use in Cement MakingLOESCHE
 
A review on use of Waste Plastic Oil as Alternative Fuel in CI Engine
A review on use of Waste Plastic Oil as Alternative Fuel in CI EngineA review on use of Waste Plastic Oil as Alternative Fuel in CI Engine
A review on use of Waste Plastic Oil as Alternative Fuel in CI EngineIRJET Journal
 
KSA scenario in Petcoke
KSA scenario in PetcokeKSA scenario in Petcoke
KSA scenario in PetcokeSan Nayak
 
Plastic waste ppt
Plastic waste pptPlastic waste ppt
Plastic waste pptshubhanggg
 
Utilization of Plastic Waste as a Fuel
Utilization of Plastic Waste as a FuelUtilization of Plastic Waste as a Fuel
Utilization of Plastic Waste as a FuelIRJET Journal
 
Venice Symposium Isard - Stern Final Paper Revised . docx
Venice Symposium Isard - Stern Final Paper Revised . docxVenice Symposium Isard - Stern Final Paper Revised . docx
Venice Symposium Isard - Stern Final Paper Revised . docxPeter Isard
 
Comparative Economic Analysis of Using Natural Gas For Liquefied Natural Gas ...
Comparative Economic Analysis of Using Natural Gas For Liquefied Natural Gas ...Comparative Economic Analysis of Using Natural Gas For Liquefied Natural Gas ...
Comparative Economic Analysis of Using Natural Gas For Liquefied Natural Gas ...IJRES Journal
 
Presentation PTFq42016V1 2 1EXTERNAL JKl-4 (1)
Presentation PTFq42016V1 2 1EXTERNAL JKl-4 (1)Presentation PTFq42016V1 2 1EXTERNAL JKl-4 (1)
Presentation PTFq42016V1 2 1EXTERNAL JKl-4 (1)Hans Van Bennekom
 
A Typical Case Study Solid Waste Management In Petroleum Refineries
A Typical Case Study  Solid Waste Management In Petroleum RefineriesA Typical Case Study  Solid Waste Management In Petroleum Refineries
A Typical Case Study Solid Waste Management In Petroleum RefineriesJim Jimenez
 
Cleaning up british industry
Cleaning up british industryCleaning up british industry
Cleaning up british industryBrian Worrall
 
Conversion of Waste Plastic into Fuel Oil in the Presence of Bentonite as a C...
Conversion of Waste Plastic into Fuel Oil in the Presence of Bentonite as a C...Conversion of Waste Plastic into Fuel Oil in the Presence of Bentonite as a C...
Conversion of Waste Plastic into Fuel Oil in the Presence of Bentonite as a C...IRJET Journal
 
Economic Model In Exploiting Stranded Natural Gas In Niger Delta Offshore Fields
Economic Model In Exploiting Stranded Natural Gas In Niger Delta Offshore FieldsEconomic Model In Exploiting Stranded Natural Gas In Niger Delta Offshore Fields
Economic Model In Exploiting Stranded Natural Gas In Niger Delta Offshore FieldsIJERD Editor
 
PYROLYSIS OF PLASTIC WASTE IN FUELS
PYROLYSIS OF PLASTIC WASTE IN FUELSPYROLYSIS OF PLASTIC WASTE IN FUELS
PYROLYSIS OF PLASTIC WASTE IN FUELSIRJET Journal
 
IGE Presentation to Foyson Shareholders
IGE Presentation to Foyson ShareholdersIGE Presentation to Foyson Shareholders
IGE Presentation to Foyson ShareholdersFoyson Resources
 
DME Methanol Outlook for gas conversion Amoco 2000
DME Methanol Outlook  for gas conversion Amoco 2000DME Methanol Outlook  for gas conversion Amoco 2000
DME Methanol Outlook for gas conversion Amoco 2000Steve Wittrig
 
SMART SEWAGE TREATMENT PLANTS FOR SMART CITIES IN INDIA, NY USA - Mr. Asim C ...
SMART SEWAGE TREATMENT PLANTS FOR SMART CITIES IN INDIA, NY USA - Mr. Asim C ...SMART SEWAGE TREATMENT PLANTS FOR SMART CITIES IN INDIA, NY USA - Mr. Asim C ...
SMART SEWAGE TREATMENT PLANTS FOR SMART CITIES IN INDIA, NY USA - Mr. Asim C ...IPPAI
 
Green hydrogen opportunities: Identifying success factors for market developm...
Green hydrogen opportunities: Identifying success factors for market developm...Green hydrogen opportunities: Identifying success factors for market developm...
Green hydrogen opportunities: Identifying success factors for market developm...OECD Environment
 
Plastic wastes into fuels ppt for CAD/CAM
Plastic wastes into fuels ppt for CAD/CAM Plastic wastes into fuels ppt for CAD/CAM
Plastic wastes into fuels ppt for CAD/CAM Sshantan Kumar
 

Similar to Plastics to oil report (20)

An Integrated Approach to Alternative Fuel use in Cement Making
An Integrated Approach to Alternative Fuel use in Cement MakingAn Integrated Approach to Alternative Fuel use in Cement Making
An Integrated Approach to Alternative Fuel use in Cement Making
 
A review on use of Waste Plastic Oil as Alternative Fuel in CI Engine
A review on use of Waste Plastic Oil as Alternative Fuel in CI EngineA review on use of Waste Plastic Oil as Alternative Fuel in CI Engine
A review on use of Waste Plastic Oil as Alternative Fuel in CI Engine
 
KSA scenario in Petcoke
KSA scenario in PetcokeKSA scenario in Petcoke
KSA scenario in Petcoke
 
Plastic waste ppt
Plastic waste pptPlastic waste ppt
Plastic waste ppt
 
Utilization of Plastic Waste as a Fuel
Utilization of Plastic Waste as a FuelUtilization of Plastic Waste as a Fuel
Utilization of Plastic Waste as a Fuel
 
NSR Executive Summary
NSR Executive SummaryNSR Executive Summary
NSR Executive Summary
 
Venice Symposium Isard - Stern Final Paper Revised . docx
Venice Symposium Isard - Stern Final Paper Revised . docxVenice Symposium Isard - Stern Final Paper Revised . docx
Venice Symposium Isard - Stern Final Paper Revised . docx
 
Comparative Economic Analysis of Using Natural Gas For Liquefied Natural Gas ...
Comparative Economic Analysis of Using Natural Gas For Liquefied Natural Gas ...Comparative Economic Analysis of Using Natural Gas For Liquefied Natural Gas ...
Comparative Economic Analysis of Using Natural Gas For Liquefied Natural Gas ...
 
Presentation PTFq42016V1 2 1EXTERNAL JKl-4 (1)
Presentation PTFq42016V1 2 1EXTERNAL JKl-4 (1)Presentation PTFq42016V1 2 1EXTERNAL JKl-4 (1)
Presentation PTFq42016V1 2 1EXTERNAL JKl-4 (1)
 
A Typical Case Study Solid Waste Management In Petroleum Refineries
A Typical Case Study  Solid Waste Management In Petroleum RefineriesA Typical Case Study  Solid Waste Management In Petroleum Refineries
A Typical Case Study Solid Waste Management In Petroleum Refineries
 
Ferguson Plarre Bakehouses
Ferguson Plarre BakehousesFerguson Plarre Bakehouses
Ferguson Plarre Bakehouses
 
Cleaning up british industry
Cleaning up british industryCleaning up british industry
Cleaning up british industry
 
Conversion of Waste Plastic into Fuel Oil in the Presence of Bentonite as a C...
Conversion of Waste Plastic into Fuel Oil in the Presence of Bentonite as a C...Conversion of Waste Plastic into Fuel Oil in the Presence of Bentonite as a C...
Conversion of Waste Plastic into Fuel Oil in the Presence of Bentonite as a C...
 
Economic Model In Exploiting Stranded Natural Gas In Niger Delta Offshore Fields
Economic Model In Exploiting Stranded Natural Gas In Niger Delta Offshore FieldsEconomic Model In Exploiting Stranded Natural Gas In Niger Delta Offshore Fields
Economic Model In Exploiting Stranded Natural Gas In Niger Delta Offshore Fields
 
PYROLYSIS OF PLASTIC WASTE IN FUELS
PYROLYSIS OF PLASTIC WASTE IN FUELSPYROLYSIS OF PLASTIC WASTE IN FUELS
PYROLYSIS OF PLASTIC WASTE IN FUELS
 
IGE Presentation to Foyson Shareholders
IGE Presentation to Foyson ShareholdersIGE Presentation to Foyson Shareholders
IGE Presentation to Foyson Shareholders
 
DME Methanol Outlook for gas conversion Amoco 2000
DME Methanol Outlook  for gas conversion Amoco 2000DME Methanol Outlook  for gas conversion Amoco 2000
DME Methanol Outlook for gas conversion Amoco 2000
 
SMART SEWAGE TREATMENT PLANTS FOR SMART CITIES IN INDIA, NY USA - Mr. Asim C ...
SMART SEWAGE TREATMENT PLANTS FOR SMART CITIES IN INDIA, NY USA - Mr. Asim C ...SMART SEWAGE TREATMENT PLANTS FOR SMART CITIES IN INDIA, NY USA - Mr. Asim C ...
SMART SEWAGE TREATMENT PLANTS FOR SMART CITIES IN INDIA, NY USA - Mr. Asim C ...
 
Green hydrogen opportunities: Identifying success factors for market developm...
Green hydrogen opportunities: Identifying success factors for market developm...Green hydrogen opportunities: Identifying success factors for market developm...
Green hydrogen opportunities: Identifying success factors for market developm...
 
Plastic wastes into fuels ppt for CAD/CAM
Plastic wastes into fuels ppt for CAD/CAM Plastic wastes into fuels ppt for CAD/CAM
Plastic wastes into fuels ppt for CAD/CAM
 

More from Jay Ranvir

Solar net metering policy
Solar net metering policySolar net metering policy
Solar net metering policyJay Ranvir
 
Open access mp
Open access mpOpen access mp
Open access mpJay Ranvir
 
Profile on the production retreaded tyre
Profile on the production retreaded tyreProfile on the production retreaded tyre
Profile on the production retreaded tyreJay Ranvir
 
Tyre Retreading by Hot Retreading Process
Tyre Retreading by Hot Retreading ProcessTyre Retreading by Hot Retreading Process
Tyre Retreading by Hot Retreading ProcessJay Ranvir
 
Open Access Charges Rajasthan
Open Access Charges RajasthanOpen Access Charges Rajasthan
Open Access Charges RajasthanJay Ranvir
 
Response to msedcl demands
Response to msedcl demandsResponse to msedcl demands
Response to msedcl demandsJay Ranvir
 
Practice directions rts net metering regulations 2015
Practice directions  rts  net metering regulations 2015Practice directions  rts  net metering regulations 2015
Practice directions rts net metering regulations 2015Jay Ranvir
 
Ppa agreement draft
Ppa agreement draftPpa agreement draft
Ppa agreement draftJay Ranvir
 
Notified f &amp;s regulations 2018
Notified f &amp;s  regulations 2018Notified f &amp;s  regulations 2018
Notified f &amp;s regulations 2018Jay Ranvir
 
Detailed comparison of capex vs opex
Detailed comparison of capex vs opexDetailed comparison of capex vs opex
Detailed comparison of capex vs opexJay Ranvir
 
Detail information of 5 t pyrolysis plant
Detail information of 5 t pyrolysis plantDetail information of 5 t pyrolysis plant
Detail information of 5 t pyrolysis plantJay Ranvir
 
Model ppa for renewable energy sources
Model ppa for renewable energy sourcesModel ppa for renewable energy sources
Model ppa for renewable energy sourcesJay Ranvir
 
Verification of compliance of renewable purchase obligation
Verification of compliance of renewable purchase obligationVerification of compliance of renewable purchase obligation
Verification of compliance of renewable purchase obligationJay Ranvir
 
Short term open access status for march 17
Short term open access status for march 17Short term open access status for march 17
Short term open access status for march 17Jay Ranvir
 
The indian-sunshine-the-solar-energy-landscape-in-india (1)
The indian-sunshine-the-solar-energy-landscape-in-india (1)The indian-sunshine-the-solar-energy-landscape-in-india (1)
The indian-sunshine-the-solar-energy-landscape-in-india (1)Jay Ranvir
 
The indian-sunshine-the-solar-energy-landscape-in-india (1)
The indian-sunshine-the-solar-energy-landscape-in-india (1)The indian-sunshine-the-solar-energy-landscape-in-india (1)
The indian-sunshine-the-solar-energy-landscape-in-india (1)Jay Ranvir
 
Forecasting, scheduling and imbalance handling for Solar Wind Energy
Forecasting, scheduling and imbalance handling for Solar Wind EnergyForecasting, scheduling and imbalance handling for Solar Wind Energy
Forecasting, scheduling and imbalance handling for Solar Wind EnergyJay Ranvir
 
Ppa model presentation
Ppa model presentationPpa model presentation
Ppa model presentationJay Ranvir
 
Applicable charges for group captive open access up solar
Applicable charges for group captive open access up solarApplicable charges for group captive open access up solar
Applicable charges for group captive open access up solarJay Ranvir
 

More from Jay Ranvir (20)

Solar net metering policy
Solar net metering policySolar net metering policy
Solar net metering policy
 
Open access mp
Open access mpOpen access mp
Open access mp
 
Profile on the production retreaded tyre
Profile on the production retreaded tyreProfile on the production retreaded tyre
Profile on the production retreaded tyre
 
Tyre Retreading by Hot Retreading Process
Tyre Retreading by Hot Retreading ProcessTyre Retreading by Hot Retreading Process
Tyre Retreading by Hot Retreading Process
 
Ch21
Ch21Ch21
Ch21
 
Open Access Charges Rajasthan
Open Access Charges RajasthanOpen Access Charges Rajasthan
Open Access Charges Rajasthan
 
Response to msedcl demands
Response to msedcl demandsResponse to msedcl demands
Response to msedcl demands
 
Practice directions rts net metering regulations 2015
Practice directions  rts  net metering regulations 2015Practice directions  rts  net metering regulations 2015
Practice directions rts net metering regulations 2015
 
Ppa agreement draft
Ppa agreement draftPpa agreement draft
Ppa agreement draft
 
Notified f &amp;s regulations 2018
Notified f &amp;s  regulations 2018Notified f &amp;s  regulations 2018
Notified f &amp;s regulations 2018
 
Detailed comparison of capex vs opex
Detailed comparison of capex vs opexDetailed comparison of capex vs opex
Detailed comparison of capex vs opex
 
Detail information of 5 t pyrolysis plant
Detail information of 5 t pyrolysis plantDetail information of 5 t pyrolysis plant
Detail information of 5 t pyrolysis plant
 
Model ppa for renewable energy sources
Model ppa for renewable energy sourcesModel ppa for renewable energy sources
Model ppa for renewable energy sources
 
Verification of compliance of renewable purchase obligation
Verification of compliance of renewable purchase obligationVerification of compliance of renewable purchase obligation
Verification of compliance of renewable purchase obligation
 
Short term open access status for march 17
Short term open access status for march 17Short term open access status for march 17
Short term open access status for march 17
 
The indian-sunshine-the-solar-energy-landscape-in-india (1)
The indian-sunshine-the-solar-energy-landscape-in-india (1)The indian-sunshine-the-solar-energy-landscape-in-india (1)
The indian-sunshine-the-solar-energy-landscape-in-india (1)
 
The indian-sunshine-the-solar-energy-landscape-in-india (1)
The indian-sunshine-the-solar-energy-landscape-in-india (1)The indian-sunshine-the-solar-energy-landscape-in-india (1)
The indian-sunshine-the-solar-energy-landscape-in-india (1)
 
Forecasting, scheduling and imbalance handling for Solar Wind Energy
Forecasting, scheduling and imbalance handling for Solar Wind EnergyForecasting, scheduling and imbalance handling for Solar Wind Energy
Forecasting, scheduling and imbalance handling for Solar Wind Energy
 
Ppa model presentation
Ppa model presentationPpa model presentation
Ppa model presentation
 
Applicable charges for group captive open access up solar
Applicable charges for group captive open access up solarApplicable charges for group captive open access up solar
Applicable charges for group captive open access up solar
 

Recently uploaded

Escorts in Nungambakkam Phone 8250092165 Enjoy 24/7 Escort Service Enjoy Your...
Escorts in Nungambakkam Phone 8250092165 Enjoy 24/7 Escort Service Enjoy Your...Escorts in Nungambakkam Phone 8250092165 Enjoy 24/7 Escort Service Enjoy Your...
Escorts in Nungambakkam Phone 8250092165 Enjoy 24/7 Escort Service Enjoy Your...meghakumariji156
 
Horngren’s Cost Accounting A Managerial Emphasis, Canadian 9th edition soluti...
Horngren’s Cost Accounting A Managerial Emphasis, Canadian 9th edition soluti...Horngren’s Cost Accounting A Managerial Emphasis, Canadian 9th edition soluti...
Horngren’s Cost Accounting A Managerial Emphasis, Canadian 9th edition soluti...ssuserf63bd7
 
Ooty Call Gril 80022//12248 Only For Sex And High Profile Best Gril Sex Avail...
Ooty Call Gril 80022//12248 Only For Sex And High Profile Best Gril Sex Avail...Ooty Call Gril 80022//12248 Only For Sex And High Profile Best Gril Sex Avail...
Ooty Call Gril 80022//12248 Only For Sex And High Profile Best Gril Sex Avail...Puja Sharma
 
Bankura Call Girl Just Call♥️ 8084732287 ♥️Top Class Call Girl Service Available
Bankura Call Girl Just Call♥️ 8084732287 ♥️Top Class Call Girl Service AvailableBankura Call Girl Just Call♥️ 8084732287 ♥️Top Class Call Girl Service Available
Bankura Call Girl Just Call♥️ 8084732287 ♥️Top Class Call Girl Service Availablepr788182
 
Nashik Call Girl Just Call 7091819311 Top Class Call Girl Service Available
Nashik Call Girl Just Call 7091819311 Top Class Call Girl Service AvailableNashik Call Girl Just Call 7091819311 Top Class Call Girl Service Available
Nashik Call Girl Just Call 7091819311 Top Class Call Girl Service Availablepr788182
 
KOTA 💋 Call Girl 9827461493 Call Girls in Escort service book now
KOTA 💋 Call Girl 9827461493 Call Girls in  Escort service book nowKOTA 💋 Call Girl 9827461493 Call Girls in  Escort service book now
KOTA 💋 Call Girl 9827461493 Call Girls in Escort service book nowkapoorjyoti4444
 
Unveiling Falcon Invoice Discounting: Leading the Way as India's Premier Bill...
Unveiling Falcon Invoice Discounting: Leading the Way as India's Premier Bill...Unveiling Falcon Invoice Discounting: Leading the Way as India's Premier Bill...
Unveiling Falcon Invoice Discounting: Leading the Way as India's Premier Bill...Falcon Invoice Discounting
 
Al Mizhar Dubai Escorts +971561403006 Escorts Service In Al Mizhar
Al Mizhar Dubai Escorts +971561403006 Escorts Service In Al MizharAl Mizhar Dubai Escorts +971561403006 Escorts Service In Al Mizhar
Al Mizhar Dubai Escorts +971561403006 Escorts Service In Al Mizharallensay1
 
PITHAMPUR 💋 Call Girl 9827461493 Call Girls in Escort service book now
PITHAMPUR 💋 Call Girl 9827461493 Call Girls in  Escort service book nowPITHAMPUR 💋 Call Girl 9827461493 Call Girls in  Escort service book now
PITHAMPUR 💋 Call Girl 9827461493 Call Girls in Escort service book nowkapoorjyoti4444
 
Putting the SPARK into Virtual Training.pptx
Putting the SPARK into Virtual Training.pptxPutting the SPARK into Virtual Training.pptx
Putting the SPARK into Virtual Training.pptxCynthia Clay
 
SRI GANGANAGAR 💋 Call Girl 9827461493 Call Girls in Escort service book now
SRI GANGANAGAR 💋 Call Girl 9827461493 Call Girls in  Escort service book nowSRI GANGANAGAR 💋 Call Girl 9827461493 Call Girls in  Escort service book now
SRI GANGANAGAR 💋 Call Girl 9827461493 Call Girls in Escort service book nowkapoorjyoti4444
 
Durg CALL GIRL ❤ 82729*64427❤ CALL GIRLS IN durg ESCORTS
Durg CALL GIRL ❤ 82729*64427❤ CALL GIRLS IN durg ESCORTSDurg CALL GIRL ❤ 82729*64427❤ CALL GIRLS IN durg ESCORTS
Durg CALL GIRL ❤ 82729*64427❤ CALL GIRLS IN durg ESCORTSkajalroy875762
 
Lundin Gold - Q1 2024 Conference Call Presentation (Revised)
Lundin Gold - Q1 2024 Conference Call Presentation (Revised)Lundin Gold - Q1 2024 Conference Call Presentation (Revised)
Lundin Gold - Q1 2024 Conference Call Presentation (Revised)Adnet Communications
 
Chandrapur Call Girl Just Call 8084732287 Top Class Call Girl Service Available
Chandrapur Call Girl Just Call 8084732287 Top Class Call Girl Service AvailableChandrapur Call Girl Just Call 8084732287 Top Class Call Girl Service Available
Chandrapur Call Girl Just Call 8084732287 Top Class Call Girl Service Availablepr788182
 
Marel Q1 2024 Investor Presentation from May 8, 2024
Marel Q1 2024 Investor Presentation from May 8, 2024Marel Q1 2024 Investor Presentation from May 8, 2024
Marel Q1 2024 Investor Presentation from May 8, 2024Marel
 
Paradip CALL GIRL❤7091819311❤CALL GIRLS IN ESCORT SERVICE WE ARE PROVIDING
Paradip CALL GIRL❤7091819311❤CALL GIRLS IN ESCORT SERVICE WE ARE PROVIDINGParadip CALL GIRL❤7091819311❤CALL GIRLS IN ESCORT SERVICE WE ARE PROVIDING
Paradip CALL GIRL❤7091819311❤CALL GIRLS IN ESCORT SERVICE WE ARE PROVIDINGpr788182
 
JAJPUR CALL GIRL ❤ 82729*64427❤ CALL GIRLS IN JAJPUR ESCORTS
JAJPUR CALL GIRL ❤ 82729*64427❤ CALL GIRLS IN JAJPUR  ESCORTSJAJPUR CALL GIRL ❤ 82729*64427❤ CALL GIRLS IN JAJPUR  ESCORTS
JAJPUR CALL GIRL ❤ 82729*64427❤ CALL GIRLS IN JAJPUR ESCORTSkajalroy875762
 
JHARSUGUDA CALL GIRL ❤ 82729*64427❤ CALL GIRLS IN JHARSUGUDA ESCORTS
JHARSUGUDA CALL GIRL ❤ 82729*64427❤ CALL GIRLS IN JHARSUGUDA ESCORTSJHARSUGUDA CALL GIRL ❤ 82729*64427❤ CALL GIRLS IN JHARSUGUDA ESCORTS
JHARSUGUDA CALL GIRL ❤ 82729*64427❤ CALL GIRLS IN JHARSUGUDA ESCORTSkajalroy875762
 
Cuttack Call Girl Just Call 8084732287 Top Class Call Girl Service Available
Cuttack Call Girl Just Call 8084732287 Top Class Call Girl Service AvailableCuttack Call Girl Just Call 8084732287 Top Class Call Girl Service Available
Cuttack Call Girl Just Call 8084732287 Top Class Call Girl Service Availablepr788182
 

Recently uploaded (20)

Escorts in Nungambakkam Phone 8250092165 Enjoy 24/7 Escort Service Enjoy Your...
Escorts in Nungambakkam Phone 8250092165 Enjoy 24/7 Escort Service Enjoy Your...Escorts in Nungambakkam Phone 8250092165 Enjoy 24/7 Escort Service Enjoy Your...
Escorts in Nungambakkam Phone 8250092165 Enjoy 24/7 Escort Service Enjoy Your...
 
Horngren’s Cost Accounting A Managerial Emphasis, Canadian 9th edition soluti...
Horngren’s Cost Accounting A Managerial Emphasis, Canadian 9th edition soluti...Horngren’s Cost Accounting A Managerial Emphasis, Canadian 9th edition soluti...
Horngren’s Cost Accounting A Managerial Emphasis, Canadian 9th edition soluti...
 
Ooty Call Gril 80022//12248 Only For Sex And High Profile Best Gril Sex Avail...
Ooty Call Gril 80022//12248 Only For Sex And High Profile Best Gril Sex Avail...Ooty Call Gril 80022//12248 Only For Sex And High Profile Best Gril Sex Avail...
Ooty Call Gril 80022//12248 Only For Sex And High Profile Best Gril Sex Avail...
 
Bankura Call Girl Just Call♥️ 8084732287 ♥️Top Class Call Girl Service Available
Bankura Call Girl Just Call♥️ 8084732287 ♥️Top Class Call Girl Service AvailableBankura Call Girl Just Call♥️ 8084732287 ♥️Top Class Call Girl Service Available
Bankura Call Girl Just Call♥️ 8084732287 ♥️Top Class Call Girl Service Available
 
Nashik Call Girl Just Call 7091819311 Top Class Call Girl Service Available
Nashik Call Girl Just Call 7091819311 Top Class Call Girl Service AvailableNashik Call Girl Just Call 7091819311 Top Class Call Girl Service Available
Nashik Call Girl Just Call 7091819311 Top Class Call Girl Service Available
 
KOTA 💋 Call Girl 9827461493 Call Girls in Escort service book now
KOTA 💋 Call Girl 9827461493 Call Girls in  Escort service book nowKOTA 💋 Call Girl 9827461493 Call Girls in  Escort service book now
KOTA 💋 Call Girl 9827461493 Call Girls in Escort service book now
 
Unveiling Falcon Invoice Discounting: Leading the Way as India's Premier Bill...
Unveiling Falcon Invoice Discounting: Leading the Way as India's Premier Bill...Unveiling Falcon Invoice Discounting: Leading the Way as India's Premier Bill...
Unveiling Falcon Invoice Discounting: Leading the Way as India's Premier Bill...
 
Al Mizhar Dubai Escorts +971561403006 Escorts Service In Al Mizhar
Al Mizhar Dubai Escorts +971561403006 Escorts Service In Al MizharAl Mizhar Dubai Escorts +971561403006 Escorts Service In Al Mizhar
Al Mizhar Dubai Escorts +971561403006 Escorts Service In Al Mizhar
 
PITHAMPUR 💋 Call Girl 9827461493 Call Girls in Escort service book now
PITHAMPUR 💋 Call Girl 9827461493 Call Girls in  Escort service book nowPITHAMPUR 💋 Call Girl 9827461493 Call Girls in  Escort service book now
PITHAMPUR 💋 Call Girl 9827461493 Call Girls in Escort service book now
 
Putting the SPARK into Virtual Training.pptx
Putting the SPARK into Virtual Training.pptxPutting the SPARK into Virtual Training.pptx
Putting the SPARK into Virtual Training.pptx
 
SRI GANGANAGAR 💋 Call Girl 9827461493 Call Girls in Escort service book now
SRI GANGANAGAR 💋 Call Girl 9827461493 Call Girls in  Escort service book nowSRI GANGANAGAR 💋 Call Girl 9827461493 Call Girls in  Escort service book now
SRI GANGANAGAR 💋 Call Girl 9827461493 Call Girls in Escort service book now
 
Durg CALL GIRL ❤ 82729*64427❤ CALL GIRLS IN durg ESCORTS
Durg CALL GIRL ❤ 82729*64427❤ CALL GIRLS IN durg ESCORTSDurg CALL GIRL ❤ 82729*64427❤ CALL GIRLS IN durg ESCORTS
Durg CALL GIRL ❤ 82729*64427❤ CALL GIRLS IN durg ESCORTS
 
Lundin Gold - Q1 2024 Conference Call Presentation (Revised)
Lundin Gold - Q1 2024 Conference Call Presentation (Revised)Lundin Gold - Q1 2024 Conference Call Presentation (Revised)
Lundin Gold - Q1 2024 Conference Call Presentation (Revised)
 
WheelTug Short Pitch Deck 2024 | Byond Insights
WheelTug Short Pitch Deck 2024 | Byond InsightsWheelTug Short Pitch Deck 2024 | Byond Insights
WheelTug Short Pitch Deck 2024 | Byond Insights
 
Chandrapur Call Girl Just Call 8084732287 Top Class Call Girl Service Available
Chandrapur Call Girl Just Call 8084732287 Top Class Call Girl Service AvailableChandrapur Call Girl Just Call 8084732287 Top Class Call Girl Service Available
Chandrapur Call Girl Just Call 8084732287 Top Class Call Girl Service Available
 
Marel Q1 2024 Investor Presentation from May 8, 2024
Marel Q1 2024 Investor Presentation from May 8, 2024Marel Q1 2024 Investor Presentation from May 8, 2024
Marel Q1 2024 Investor Presentation from May 8, 2024
 
Paradip CALL GIRL❤7091819311❤CALL GIRLS IN ESCORT SERVICE WE ARE PROVIDING
Paradip CALL GIRL❤7091819311❤CALL GIRLS IN ESCORT SERVICE WE ARE PROVIDINGParadip CALL GIRL❤7091819311❤CALL GIRLS IN ESCORT SERVICE WE ARE PROVIDING
Paradip CALL GIRL❤7091819311❤CALL GIRLS IN ESCORT SERVICE WE ARE PROVIDING
 
JAJPUR CALL GIRL ❤ 82729*64427❤ CALL GIRLS IN JAJPUR ESCORTS
JAJPUR CALL GIRL ❤ 82729*64427❤ CALL GIRLS IN JAJPUR  ESCORTSJAJPUR CALL GIRL ❤ 82729*64427❤ CALL GIRLS IN JAJPUR  ESCORTS
JAJPUR CALL GIRL ❤ 82729*64427❤ CALL GIRLS IN JAJPUR ESCORTS
 
JHARSUGUDA CALL GIRL ❤ 82729*64427❤ CALL GIRLS IN JHARSUGUDA ESCORTS
JHARSUGUDA CALL GIRL ❤ 82729*64427❤ CALL GIRLS IN JHARSUGUDA ESCORTSJHARSUGUDA CALL GIRL ❤ 82729*64427❤ CALL GIRLS IN JHARSUGUDA ESCORTS
JHARSUGUDA CALL GIRL ❤ 82729*64427❤ CALL GIRLS IN JHARSUGUDA ESCORTS
 
Cuttack Call Girl Just Call 8084732287 Top Class Call Girl Service Available
Cuttack Call Girl Just Call 8084732287 Top Class Call Girl Service AvailableCuttack Call Girl Just Call 8084732287 Top Class Call Girl Service Available
Cuttack Call Girl Just Call 8084732287 Top Class Call Girl Service Available
 

Plastics to oil report

  • 1. Plastics to oil products Final report
  • 2. Plastic to oil IFM002 final report 2 Zero Waste Scotland works with businesses, individuals, communities and local authorities to help them reduce waste, recycle more and use resources sustainably. Find out more at www.zerowastescotland.org.uk Written by: Sam Haig, Liz Morrish, Roger Morton, Uchenna Onwuamaegbu, Peter Speller and Simon Wilkinson
  • 3. Plastic to oil IFM002 final report 3 Executive summary The Zero Waste Plan published by the Scottish Government in 2010 sets targets of 70% of all waste to be recycled and 5% to be landfilled by 2025. In order to help deliver this plan, The Waste (Scotland) Regulations 2012 require that all dry recyclables are collected separately and that disposal of separately collected dry recyclables to landfill or incineration is banned from 1 January 2014. Plastic items that enter the waste stream are made in a wide range of formats and from a variety of polymer types. According to the market research of material recovery facilities (MRFs), and other waste-processing facilities, conducted as part of this project, there is currently around 18,000–27,000 tonnes per annum (tpa) of low-quality mixed waste plastic film in Scotland which cannot be recovered by current mechanical recycling techniques. The bulk of this material is plastic film from commercial and domestic packaging sources, and arises from municipal MRFs, with the remainder from composting and anaerobic digestion facilities. It is estimated that this volume will increase to up to 50,000tpa as the Zero Waste Plan is implemented. There is the potential to use chemical and thermal processing methods to recover these low-grade mixed waste plastics as useful materials. The purpose of this report is to review the current state of development of processes for conversion of mixed waste plastic to oil and to compare the technical, commercial and environmental potential of the leading process options for implementation in Scotland. The report also reviews the regulatory and fiscal issues relating to implementation of these technologies in Scotland and makes recommendations for changes which could encourage uptake of these technologies. Processes for conversion of plastics and other solid hydrocarbon materials to oil are not new. Gasification and pyrolysis techniques for coal were commercialised in Germany during the Second World War and developed further in South Africa during the Apartheid years. Plastic depolymerisation techniques were developed actively during the 1980s and 1990s, but none was adopted commercially as mechanical recycling methods developed rapidly. Over the past 10 years there has been an increase in the amount of research into the conversion of plastic into oil, as oil prices have increased and waste collection and sorting methods have improved. There are now several processes operating close to commercial viability in different parts of the world. The processes that have the most technical and commercial potential fall into three categories:  fast gas phase pyrolysis to make synthetic crude oil mixtures;  liquid-phase catalytic depolymerisation to make mixed distillates; and  gasification, followed by chemical or biological synthesis, to make high-quality fuels. The pyrolysis and catalytic depolymerisation processes are limited in scale by the need for external heating of the material to be treated. This means that it is difficult to build these plants with a capacity of more than about 1,000kg/h (approximately 8,000tpa) per individual process unit; for sites processing larger tonnages, several units running in parallel are needed.
  • 4. 4 Plastic to oil IFM002 final report These pyrolysis and catalytic depolymerisation processes have a relatively low capital cost and a relatively high yield (60–70% of the feedstock is converted to a liquid). However, the quality of these oil products is low and further processing is required to give a fuel product. Despite this, the high yield improves the environmental and economic viability of these processes. In comparison, gasification processes with downstream synthesis of high-quality fuels are much more capital intensive, requiring larger economies of scale. These processes have lower product yields (30– 60% of the feedstock is recovered as a liquid fuel) but recover energy as electricity from the high- pressure, high-temperature processes. Although all of the processes considered in this report generate a positive operating income, only pyrolysis, catalytic depolymerisation and gasification with biological conversion to ethanol are financially viable, generating positive 10-year net present values (NPVs). These processes still generate a positive NPV if the gate fee falls to £60 per tonne, which is expected as the market for energy from waste in Scotland grows. Pyrolysis and catalytic depolymerisation generate a positive NPV at a gate fee of zero. These economic assessments were based on capital cost numbers provided by technology suppliers and as such may not reflect the actual capital required for a project. Capital was the biggest sensitivity and hence further refinement in this area is required before the full economics are understood. The capital required for sufficient capacity to process 27,000tpa is of the order of £20–30M. Lower capacities would require less investment, but the minimum economically viable capacity is estimated to be between 12,000 and 16,000tpa. For pyrolysis and catalytic depolymerisation, this means that installation of a single processing unit is unlikely to be viable. The report concludes that for Scotland the best technical, environmental and commercial option is likely to be one of the pyrolysis, liquid-phase catalytic depolymerisation or gasification with biological conversion to ethanol processes. Versions of these processes can be found on a scale of 250–500kg/h in the USA, Canada, Germany, Poland, Hungary and China. There are still substantial technical risks involved in implementing one of these processes in Scotland. None of the demonstration plants appears to be functioning fully commercially at present and there will be particular challenges in collecting and preparing the Scottish mixed plastic waste materials to suit the chosen process. The quality of the oil produced by catalytic depolymerisation depends on the quality of the feedstock, so it is not yet certain at which point the process could be introduced into the fuel supply chain. Test work on Scottish feed material would be required to establish whether the material could be blended directly into gasoline or diesel at low addition rates (the highest value option) or whether it would need to be introduced to an oil refinery part-way through the crude oil treatment process, in which case the selling price for the oil would have to be lower in order to compensate the refinery for its additional processing costs.
  • 5. Plastic to oil IFM002 final report 5 Additional capital costs at the refinery (e.g. for integration or risk mitigation) will also have an impact on the economic viability of the process. An analysis of the transport costs associated with proposed processing site networks shows that one centralised site based in Grangemouth is the best option. This is dependent on there being a suitable site close to the INEOS refinery that can feed the oil products to the refinery by pipeline, thereby avoiding extra transport costs for the oil products. The development of plastics-to-oil processes could be further encouraged by adjusting the regulatory and fiscal incentives in order to provide similar incentives for oil and power generated from waste, by advanced thermal conversion processes of the type reviewed in this report, to those (Renewable Transport Fuels Obligation (RTFO), Feed-in Tariff (FiT), Renewable Heat Incentive (RHI)) that are provided for power and liquid fuels produced from biogenic materials. In particular, consideration should be given to:  extending the incentives already available for biogenic waste materials to those waste materials that are likely to be banned from landfill in Scotland, by applying RTFO to waste-derived oil products and FiT and RHI to power and heat generated from the manufacturing processes involved in producing oil products from plastics;  working with the Scottish Environment Protection Agency (SEPA) to provide clear guidance on the criteria by which plastic-to-oil processes could be determined as being energy or chemical manufacturing processes rather than waste management processes (incineration or co- incineration); and  working with SEPA to provide clear guidance on the ‘end of waste’ for waste-derived oil products, possibly by development of an appropriate quality standard. In addition, this report recommends reducing the technical and commercial risk for potential project promoters through the following measures:  Practical trials should be conducted to demonstrate the quality and composition of the oils that could be produced by one or more of the leading pyrolysis or catalytic depolymerisation processes from low-grade waste plastic sourced in Scotland.  Feasibility studies (desk based) should be carried out to determine the practically successful waste- plastic-to-oil technologies to understand the technical capability, the energy integration and the project integration of each with a specific end-use partner. Output should be a good estimation of the capital expenditure needed and provide a good understanding of the technical risk and how it can be mitigated.  Research needs to be conducted to confirm the actual quantities of low-grade plastic film arising from materials recycling facilities, composting facilities and anaerobic digestion plants.  Studies are needed to fully assess the potential costs of registration of oil products under REACH (Registration, Evaluation, Authorisation & restriction of Chemicals).
  • 6. Plastic to oil IFM002 final report 6 Contents 1 Introduction ..............................................................................................................................14 1.1 Background...................................................................................................................... 14 1.2 Project objectives ............................................................................................................. 14 1.3 Project methodology......................................................................................................... 15 2 Literature review.......................................................................................................................16 2.1 Introduction..................................................................................................................... 16 2.2 Literature cited................................................................................................................. 17 2.3 Technology supplier survey ............................................................................................... 17 2.4 Scoring exercise ............................................................................................................... 18 2.5 Summary......................................................................................................................... 22 3 Waste plastics and end-product supply chain..........................................................................24 3.1 Background...................................................................................................................... 24 3.2 Plastic supply ................................................................................................................... 24 3.2.1 Household materials recovery facilities ................................................................... 26 3.2.2 Composting facilities............................................................................................. 28 3.2.3 Anaerobic digestion plants .................................................................................... 30 3.2.4 Others................................................................................................................. 31 3.2.5 Summary of potential feedstock sources................................................................. 31 3.2.6 Mapping of potential feedstock sources .................................................................. 31 3.2.7 Comparison of distributed and centralised sites for product delivery.......................... 32 3.2.8 Current waste management practices .................................................................... 36 3.2.9 Future trends....................................................................................................... 37 3.2.10 Summary – plastic supply ..................................................................................... 38 3.3 End markets for oil products.............................................................................................. 38 3.3.1 Current market for transport fuels.......................................................................... 38 3.3.2 Introducing plastic-derived crude oil to Grangemouth refinery .................................. 39 3.3.3 Introducing distilled oil products to Grangemouth refinery........................................ 39 3.3.4 Introducing drop-in fuels to the fuel distribution system........................................... 40 3.3.5 Heating fuels ....................................................................................................... 40 3.3.6 Future trends....................................................................................................... 41 3.3.7 Summary – markets for oil products....................................................................... 41 4 Review of process options for conversion of plastics into oil products ..................................42 4.1 Characteristics of plastics and oil products .......................................................................... 42 4.2 Pyrolysis.......................................................................................................................... 44 4.3 Catalytic depolymerisation................................................................................................. 49 4.4 Gasification to syngas....................................................................................................... 51 4.5 Fischer–Tropsch conversion of syngas to diesel products .................................................... 53 4.6 Syngas conversion to methanol and methanol to gasoline.................................................... 55 4.7 Biological conversion of syngas to ethanol.......................................................................... 57 4.8 Mass and energy balances................................................................................................ 58 4.8.1 Pyrolysis.............................................................................................................. 59 4.8.2 Catalytic depolymerisation..................................................................................... 60 4.8.3 Gasification to syngas ........................................................................................... 61 4.8.4 Fischer–Tropsch conversion of syngas to diesel products ......................................... 62 4.8.5 Syngas conversion to methanol and methanol to gasoline........................................ 63 4.8.6 Biological conversion of syngas to ethanol .............................................................. 64 4.9 Summary......................................................................................................................... 65
  • 7. Plastic to oil IFM002 final report 7 5 Evaluation of business models..................................................................................................67 5.1 Base parameters for model................................................................................................ 67 5.1.1 Process basis ....................................................................................................... 67 5.1.2 Revenue.............................................................................................................. 67 5.1.3 Capital expenditure and financing options............................................................... 68 5.1.4 Operating expenditure .......................................................................................... 70 5.1.5 Working capital .................................................................................................... 71 5.1.6 Capex, opex and working capital phasing ............................................................... 71 5.1.7 Operating income and cash flow............................................................................ 72 5.1.8 Net present value................................................................................................. 72 5.2 Base case model results .................................................................................................... 73 5.2.1 Revenue and operating income.............................................................................. 73 5.2.2 Cash flow ............................................................................................................ 74 5.2.3 Net present value................................................................................................. 75 5.3 Model sensitivities............................................................................................................. 76 5.3.1 Feed buying price/gate fee.................................................................................... 76 5.3.2 Product selling price ............................................................................................. 79 5.3.3 Capex cost........................................................................................................... 81 5.3.4 Process performance ............................................................................................ 82 5.3.5 Installed capacity ................................................................................................. 83 5.4 Summary......................................................................................................................... 84 6 Environmental performance .....................................................................................................86 6.1 Functional units and system boundary................................................................................ 86 6.2 Allocation......................................................................................................................... 87 6.3 Data sources.................................................................................................................... 88 6.4 Results ............................................................................................................................ 88 7 Licensing and permitting ..........................................................................................................91 7.1 Environmental permitting .................................................................................................. 91 7.2 Waste Incineration Directive.............................................................................................. 92 7.3 End of waste.................................................................................................................... 93 7.4 REACH ........................................................................................................................... 94 7.5 Zero Waste Plan – 25% cap on energy-from-waste facilities................................................. 95 7.6 Summary......................................................................................................................... 96 8 Contamination issues................................................................................................................97 8.1 Feedstock composition ..................................................................................................... 97 8.2 Chlorine/polyvinyl chloride................................................................................................. 98 8.3 Polyethylene terephthalate ................................................................................................ 98 8.4 Water.............................................................................................................................. 99 8.5 Cellulose and biomass...................................................................................................... 99 8.6 Catalyst residues.............................................................................................................100 8.7 Animal by-products..........................................................................................................100 8.8 Impact of contamination ..................................................................................................101 8.9 Summary........................................................................................................................101 9 Barriers to development and levels of interest......................................................................103 9.1 Barriers to development ...................................................................................................103 9.1.1 Critical mass .......................................................................................................103 9.1.2 Unknown composition..........................................................................................103 9.1.3 Unproven technology...........................................................................................103 9.1.4 Incentives for biomass conversion ........................................................................104 9.1.5 Competition for feedstock ....................................................................................104
  • 8. 8 Plastic to oil IFM002 final report 9.1.6 Regulation ..........................................................................................................105 9.2 Levels of interest .............................................................................................................106 9.2.1 Waste producers .................................................................................................106 9.2.2 Oil producers ......................................................................................................106 10 Conclusions .............................................................................................................................107 10.1 Waste plastics supply chain ..............................................................................................107 10.2 Process options for conversion of plastic into oil products....................................................107 10.3 Financial assessment of process options and site................................................................108 10.4 Environmental assessment, licensing and permitting...........................................................109 10.5 Contamination issues .......................................................................................................109 10.6 Barriers to development and levels of interest ....................................................................110 11 Recommendations....................................................................................................................111 12 References...............................................................................................................................112 Appendix A: Literature review ............................................................................................................115 A.1. Pyrolysis .........................................................................................................................115 A.2. Catalytic depolymerisation................................................................................................126 A.3. Gasification to syngas ......................................................................................................129 A.4. Syngas fermentation........................................................................................................131 Appendix B: environmental impact assessment ................................................................................133 B.1. Background.....................................................................................................................133 B.2. Baseline case: mixed plastic wastes to landfill ....................................................................133 B.3. Alternative cases: mixed plastic waste thermal treatment to oil............................................134 B.4. The environmental assessment study ................................................................................139 B.5. Impact assessment..........................................................................................................149 List of Figures Figure 1 Bale of handpicked Class C film ............................................................................................................................... 26 Figure 2 Scottish waste treatment sites that could potentially provide plastic film waste............................................................ 32 Figure 3 Amount of plastic film sent to each of the three sites annually for Option 4 (distributed network) ................................. 33 Figure 4 Cost of transporting material to and from processing sites for each option .................................................................. 35 Figure 5 Total distance travelled annually to deliver material to and from processing sites for each option.................................. 35 Figure 6 Atomic composition of fuels and plastics .................................................................................................................. 43 Figure 7 Formation of char, cyclic and polycyclic hydrocarbons or reactive groups .................................................................... 47 Figure 8 Pyrolysis mass and energy balance.......................................................................................................................... 59 Figure 9 Catalytic depolymerisation mass and energy balance................................................................................................. 60 Figure 10 Gasification to syngas mass and energy balance..................................................................................................... 61 Figure 11 F–T mass and energy balance............................................................................................................................... 62 Figure 12 Syngas conversion mass and energy balance ......................................................................................................... 63 Figure 13 Biological conversion of syngas to ethanol mass and energy balance........................................................................ 64 Figure 14 Annual revenue and operating income for the base case for each option .................................................................. 73 Figure 15 Projected base cash flows for each option.............................................................................................................. 75 Figure 16 10-year NPV (base case) for each option ............................................................................................................... 76 Figure 17 Sensitivity of operating income to changing feed buying price. Note that depolymerisation is hidden behind gasification with biological processing as they have very similar values....................................................................................................... 77 Figure 18 Sensitivity of 10-year NPV to changing feed buying price......................................................................................... 78 Figure 19 Sensitivity of operating income to changing product selling price (dashed lines include increased income owing to no refining costs)...................................................................................................................................................................... 80
  • 9. Plastic to oil IFM002 final report 9 Figure 20 Sensitivity of 10-year NPV to changing product selling price (dashed lines include increased income owing to no refining costs).................................................................................................................................................................................. 80 Figure 21 Sensitivity of 10-year NPV to changing capex cost .................................................................................................. 82 Figure 22 Sensitivity of operating income to changing reactor performance ............................................................................. 83 Figure 23 Sensitivity of 10-year NPV to changing installed capacity ......................................................................................... 84 Figure 24 Generic process diagram showing boundary limits .................................................................................................. 87 Figure 25 Carbon impact comparison for waste mixed plastic disposal options (including displacement savings).......................... 89 Figure 26 Net carbon impact comparison for waste mixed plastic disposal options.................................................................... 89 Figure 27 Scenario 1: life cycle of low-quality, mixed plastic waste sent to landfill .................................................................. 134 Figure 28 The life cycle of mixed plastic wastes converted to oils via pyrolysis ....................................................................... 135 Figure 29 The life cycle of mixed plastic wastes converted to oils via catalytic depolymerisation .............................................. 136 Figure 30 The life cycle of mixed plastic wastes converted to oils via gasification with F–T...................................................... 137 Figure 31 The life cycle of mixed plastic wastes converted to oils via gasification with methanol conversion to gasoline............. 138 Figure 32 The life cycle of mixed plastic wastes converted to oils via gasification with biological conversion of syngas to ethanol 139 Figure 33 Flow diagram showing the boundary of the baseline scenario ................................................................................ 141 Figure 34 Flow diagram showing the boundary for the pyrolysis process ............................................................................... 142 Figure 35 Flow diagram showing the boundary for the catalytic depolymerisation process....................................................... 143 Figure 36 Flow diagram showing the boundary for the gasification with F–T process .............................................................. 144 Figure 37 Flow diagram showing the boundary for the process of gasification with methanol conversion to gasoline ................. 145 Figure 38 Flow diagram showing the boundary for the process of gasification with biological conversion of syngas to ethanol.... 146 List of Tables Table 1 Scoring system for identified technologies ................................................................................................................. 19 Table 2 Results of the scoring exercise.................................................................................................................................. 20 Table 3 Scottish household film waste arisings, 200912 ........................................................................................................... 25 Table 4 Larger Scottish MRFs ............................................................................................................................................... 28 Table 5 Composting facilities in Scotland............................................................................................................................... 29 Table 6 Anaerobic digestion facilities..................................................................................................................................... 30 Table 7 Summary of plastic availability from existing Scottish waste treatment facilities............................................................. 31 Table 8 Variables used to calculate price per journey and number of journeys for waste film transport ....................................... 34 Table 9 Variables used to calculate the number of journeys for waste film transport ................................................................. 34 Table 10 Estimated future availability of plastic film from Scottish waste treatment facilities ...................................................... 37 Table 11 Plastic to oil conversion technologies....................................................................................................................... 44 Table 12 Plastics pyrolysis technology suppliers..................................................................................................................... 45 Table 13 Reported outputs from pyrolysis of plastic to oil products.......................................................................................... 46 Table 14 Advantages and challenges for pyrolysis of plastics to oil products............................................................................. 48 Table 15 Catalytic depolymerisation technology suppliers ....................................................................................................... 49 Table 16 Reported outputs of catalytic depolymerisation processes ......................................................................................... 50 Table 17 Advantages and challenges for catalytic depolymerisation......................................................................................... 50 Table 18 Typical outputs from a waste gasification process .................................................................................................... 51 Table 19 Gasification to syngas technology suppliers ............................................................................................................. 51 Table 20 Advantages and challenges for gasification of plastics to syngas................................................................................ 53 Table 21 F–T technology licensors........................................................................................................................................ 54 Table 22 Advantages and challenges for conversion of syngas to diesel by F–T........................................................................ 55 Table 23 Methanol technology licensors................................................................................................................................ 56 Table 24 Advantages and challenges for conversion of syngas to gasoline by MTG ................................................................... 56
  • 10. 10 Plastic to oil IFM002 final report Table 25 Syngas fermentation technology licensors ............................................................................................................... 57 Table 26 Advantages and challenges for conversion of syngas to ethanol by fermentation ........................................................ 58 Table 27 Summary of gross output of oil products ................................................................................................................. 65 Table 28 Summary of price per unit from revenue items......................................................................................................... 67 Table 29 Capital cost summary ............................................................................................................................................ 68 Table 30 Estimated capex costs for each option..................................................................................................................... 69 Table 31 Breakdown of equity, lease and loan values for each project ..................................................................................... 70 Table 32 Heat, electricity, water and oxygen demands for each option .................................................................................... 70 Table 33 Material purchase and disposal costs....................................................................................................................... 70 Table 34 Fixed annual costs................................................................................................................................................. 70 Table 35 Estimated capex phasing schedules ........................................................................................................................ 72 Table 36 Income summary .................................................................................................................................................. 74 Table 37 Working capital required for each option (funded from equity) .................................................................................. 75 Table 38 Operating income values at given feed prices (all income values in 000s)................................................................... 78 Table 39 10-year NPVs at given feed prices (all NPVs in 000s) ................................................................................................ 78 Table 40 Break-even feed prices for each option (based on operating income and 10-year NPV)................................................ 79 Table 41 Break-even product prices for each option............................................................................................................... 81 Table 42 10-year NPVs at given capex scalings (all capex values and NPVs in 000s) ................................................................. 82 Table 43 10-year NPVs at given throughput rates (all NPVs in 000s)........................................................................................ 84 Table 44 GHG emissions and displacement for each technology................................................................................................ 90 Table 45 Estimated world consumption of plastic films, 200535 ................................................................................................ 97 Table 46 Composition of residual mixed plastic film from various sources36 .............................................................................. 97 Table 47 Animal by-product categories ............................................................................................................................... 100 Table 48 GHG emissions for landfill .................................................................................................................................... 150 Table 49 GHG emissions for incineration ............................................................................................................................. 150 Table 50 GHG emissions for pyrolysis including displacement of diesel fuel production............................................................ 151 Table 51 GHG emissions for catalytic depolymerisation including displacement of diesel fuel production ................................... 152 Table 52 GHG emissions for gasification with F–T including displacement of diesel fuel production........................................... 153 Table 53 GHG emissions for gasification with methanol conversion to gasoline including displacement of gasoline fuel production ........................................................................................................................................................................................ 154 Table 54 GHG emissions for gasification with biological conversion of syngas to ethanol including displacement of gasoline fuel production......................................................................................................................................................................... 155
  • 11. Plastic to oil IFM002 final report 11 Glossary Alkanes A class of saturated hydrocarbons with the chemical formula CnH(2n+2) that are a major component of diesel fuels. This class includes methane, ethane, propane, butane, octane, cetane, etc. Also known as paraffins. Alkenes A class of unsaturated hydrocarbons with the chemical formula CnH2n that are a component of road fuels. This class includes ethylene, propylene, etc. Also known as olefines. Anaerobic digestion A series of processes in which micro-organisms break down biodegradable material in the absence of oxygen. The process releases biogas consisting of methane, carbon dioxide and contaminants gases. Animal by-products Entire bodies or parts of animals, products of animal origin or other products obtained from animals that are not intended for human consumption, as defined by Article 3 of Regulation EC 1069/2009. Aromatics A class of hydrocarbons that have alternating double and single bonds between carbon atoms, forming a ring. This class includes benzene, toluene, xylene, etc. Also known as arenes or aryl hydrocarbons. Carbon footprint A measure of the total amount of carbon dioxide (CO2) and methane (CH4) emissions of a defined population, system or activity, considering all relevant sources, sinks and storage within the spatial and temporal boundary of the population, system or activity of interest. Catalytic depolymerisation The breaking of long-chain polymers to oligomers and monomers on the application of heat and a catalyst(s). Composting A process of controlled biological decomposition of a mixture of organic matter to produce a useful plant nutrient product. Depolymerisation The process of breaking a polymer chain to a monomer or mixture of monomers. Devolatilisation The separation of volatile materials from solids or liquids. Distillation A method of separating mixtures based on differences in volatilities of components in a boiling liquid mixture.
  • 12. 12 Plastic to oil IFM002 final report Energy from Waste (EfW) A process by which waste is thermally treated to produce energy in the form of electricity and/or heat. It includes incineration and co- incineration, pyrolysis and gasification technologies. Eutrophication The enrichment of bodies of fresh water by inorganic plant nutrients (e.g. nitrate, phosphate). Fischer–Tropsch (F–T) A series of reactions that converts a mixture of carbon monoxide and hydrogen gases to liquid hydrocarbons. Gasification A process in which a solid fuel is reacted with a gasifying agent such as air, oxygen or steam to produce a gaseous fuel containing hydrogen and carbon monoxide. Hydrocarbons An organic compound consisting entirely of hydrogen and carbon. Life cycle assessment A technique to assess environmental impacts associated with all the stages of a products life from cradle to grave. Net present value (NPV) A measure of discounted cash inflow to present cash outflow which helps to determine whether a prospective investment will be profitable. Polymerisation Polymerisation is the process of reacting monomer molecules together to form polymer chains or three-dimensional networks. Pyrolysis A process involving the decomposition of organic materials on the application of heat at an elevated temperature in the absence of oxygen. Syngas (synthesis gas) These are product gases from reactions comprising carbon monoxide and hydrogen in varying proportions. Thermal degradation The molecular deterioration of a polymer as a result of overheating. Here, the long-chain polymer begins to separate into several shorter chain polymers. The shorter chain polymers then react with each other to bring about a change in the polymer properties.
  • 13. Plastic to oil IFM002 final report 13 Abbreviations % wt Percentage, on a weight basis Capex Capital expenditure CHP Combined heat and power IPC Integrated Pollution Control M Month MRF Materials recovery facility MTG Methanol to gasoline Opex Operating expenditure PVC Polyvinyl chloride Q Quarter RTFO Renewable Transport Fuel Obligation w/Bio With biological conversion of syngas to ethanol w/F–T With Fischer–Tropsch conversion of syngas to diesel w/MTG With conversion of syngas to methanol and then to gasoline (Methanol-to-Gasoline) Y Year Acknowledgements Zero Waste Scotland, WRAP and Axion Consulting would like to thank all the individuals, companies and organisations that provided information for this report for their cooperation and support.
  • 14. 14 Plastic to oil IFM002 final report 1 Introduction 1.1 Background In 2010, the Scottish Government launched Scotland’s first Zero Waste Plan;1 this laid out several challenging new measures, including a target recycling rate of 70% on all waste and a maximum of 5% waste sent to landfill by 2025. In order to help deliver this plan, the Waste (Scotland) Regulations 2012 require that all dry recyclables are collected separately and that disposal of separately collected dry recyclables to landfill or incineration is banned from 1 January 2014. In addition, the existing cap of 25% of household waste to energy from waste facilities will be replaced with a package of measures to encourage waste prevention, reuse and recycling. In order to deliver these targets, reprocessing options for previously landfilled waste must now be considered. One of the most prevalent types of waste is plastic; it is estimated2 that, in 2009, 400,000–600,000 tonnes of plastic waste was disposed of in Scotland, more than 70% of which was landfilled or incinerated. Recovering the majority of this material would be a significant boost in meeting recycling targets. Recovering plastic for direct reuse can be problematic because of the wide range of different plastic types, applications and formats. This can result in a mixed, contaminated fraction that is unsuitable for existing mechanical recycling methods, which rely on a relatively uncontaminated feed. Separating a wide range of plastic types and formats can be difficult and costly to achieve. An alternative method is to change the plastic mixture into a reusable product via a chemical process. As most plastic is originally created from crude oil, the simplest and most ‘closed-loop’ solution is to create oil products that can be reused either to make more plastic or as a fuel. Zero Waste Scotland commissioned Axion Consulting to evaluate the various routes available to treat waste plastics and create oil products, and to assess the Scottish plastic waste arisings that would be available for such processes. 1.2 Project objectives The key objectives of the project were as follows:  literature review of the process options;  assessment of the types and sources of available waste plastics, the supply chain for delivery of these plastics and end markets for oil products;  technological, financial and environmental assessment of selected processes;  evaluation of the regulations surrounding the construction of a process; and  investigation into barriers to development and current levels of interest.
  • 15. Plastics to oil products_ZWS 15 1.3 Project methodology A range of methodologies were employed to fulfil the objectives outlined above.  Literature review of the process options: the first part of the review was carried out through Internet research focused on key websites including those of universities, technology providers, industry associations and research bodies, as well as more general web searches. Once key processes were identified, the relevant companies and organisations were contacted directly to discover as much information as possible about each option.  Assessment of the types and sources of available waste plastics, the supply chain for delivery of these plastics and end markets for oil products: a further literature review was carried out to assess the volumes and types of waste plastic arising in Scotland. These volumes were traced back to specific sources within Scotland through discussions with stakeholders in the waste recycling supply chain (e.g. material recovery facilities (MRFs), waste transfer stations, etc.). A Microsoft Excel-based model was used to assess the costs associated with transporting the waste to a variety of processing locations across Scotland. Further discussions were held with end-market stakeholders (e.g. refineries) to evaluate the potential for the oil products produced by the process.  Technological, financial and environmental assessment of selected processes: a set of Microsoft Excel -based models were used to calculate the performance of each process from technical, financial and environmental standpoints; this included reaction modelling for the main chemical processes, mass balance modelling, investment and payback calculations, and an environmental assessment using data from the Carbon Trust’s Footprint Expert™ tool.  Evaluation of the regulations surrounding the construction of a process: discussions were held with the Scottish Environment Protection Agency (SEPA) to discuss how thermal and chemical processes for the conversion of waste plastics into oil products would be regulated. This was supplemented by the team’s existing knowledge of permitting, which is based on many previous permit applications.  Investigation into barriers to development and current levels of interest: existing Scottish waste processors and other stakeholders were contacted directly to discover their level of interest in the processes proposed in the report, and any potential issues or reservations they would have. This information was considered in conjunction with any problems raised in the previous tasks, such as technical or financial infeasibility, or problematic environmental effects.
  • 16. 16 Plastic to oil IFM002 final report 2 Literature review 2.1 Introduction The recovery and recycling of plastic waste disposed of in landfill has been the subject of much effort over the decades, as it is seen as a valuable resource and is high in the public’s perception of what ‘waste’ is. Progress has been made in the mechanical recycling of post-commercial, industrial and pre- sorted post-consumer waste, but the recovery of value from low-grade mixed plastic waste has always presented technical and economic difficulties. The conversion of plastic into oil products requires the long polymer chains that are characteristic of plastics to be broken into shorter chains typical of compounds present in crude petroleum. This depolymerisation can be achieved by heating the materials to moderate or high temperatures, and zeolite catalysts (such as those frequently used in oil refineries) are helpful in increasing the rate of depolymerisation. The basic processes of depolymerisation are pyrolysis, gasification and thermal cracking. All of these processes have been in use in the coal, gas and petroleum refining industries for decades, and as such can be considered to be mature technologies. The use of plastic as a feedstock for these processes has been studied for 20 years, but its uptake has been limited by the relatively low price of oil and the lack of a credible collection infrastructure for this low-density, disperse-source feedstock. During the 1990s a series of demonstration plants were announced, only to disappear after a few years’ operation. It is interesting to note that the majority of technology suppliers reported by Juniper in 20013 are no longer active in this field, having run out of money or sold the technology to organisations with access to the funds to continue process and project development. More recently, the increased price of oil and incentives in the USA for energy and fuels from biomass and waste have resulted in renewed activity in these areas. However, in the USA and Europe, there is a preference for investment and government funding (in terms of research, development and final projects) for processes using biomass as a feedstock rather than non-biogenic waste materials. The main reasons for this are:  The feedstock itself is more homogeneous, and therefore tends to create fewer process problems.  There is an established collection mechanism, from either agricultural processing or forestry operations.  The feedstocks are considered to be truly renewable, so can attract incentives aimed at reducing the impact of climate change, etc. The recognition that waste plastic is a valuable resource has also energised research and development activity in China and India. In Europe, the greater incentives for energy and fuel production from renewable (‘biogenic’) feedstock materials have meant that research programmes in Europe are concentrating on the conversion of biomass, although the technologies and principles could be adapted for processing waste plastic.
  • 17. Plastics to oil products_ZWS 17 2.2 Literature cited A literature review of process options and technologies for converting waste plastics to oil products was conducted. This was executed by Internet research directed at key websites, including those of universities, technology providers, industry associations and research bodies, as well as more general web searches. Studies by Aguado et al,4 Schiers and Kaminsky,5 and the United Nations Environment Programme (UNEP)6 indicated that four basic technologies were being offered as commercial plastic-to-oil-product processes in 2000:  fast pyrolysis to produce a synthetic crude oil;  liquid-phase catalytic depolymerisation to produce a synthetic diesel grade fuel;  gasification and Fischer–Tropsch synthesis to produce a synthetic diesel grade fuel; and  gasification and fermentation to produce fuel-grade ethanol. More recently, Butler et al7 provided a useful review of the current state-of-the-art processes for the conversion of plastics to liquid fuels and identified 24 commercial processes for the conversion of plastic into oil products. Many of these were reported as having an ‘unknown’ status, indicative of technical or financial problems causing development to stop, but there is a number of processes that still appear to be active. The American Chemistry Council8 provides a useful review of plastic conversion to fuel processes in the USA, identifying 12 North American technology providers and 11 from the rest of the world. The US National Renewable Energy Laboratory is focused on the use of biomass as a potential feedstock, as it represents a renewable feedstock, which waste plastic does not. However, the report does provide useful information on biomass to liquid processes, including gasification with Fischer– Tropsch synthesis to diesel,9 gasoline10 and ethanol.11 2.3 Technology supplier survey From the above literature sources, and web-based searches, a total of 31 technology suppliers were identified; the below information was gathered by reference to the suppliers’ websites, available literature and telephone interviews with suppliers. Some technology manufacturers required a non- disclosure agreement (NDA) before revealing information that would allow comparison of the technical and economic performance of the technology. However, no NDAs were entered into for the execution of this report. The key information gathered included:  the name of the technology supplier;  the location of the technology supplier;  whether the technology was specific to a particular feedstock type, and whether plastic was an acceptable feedstock;
  • 18. 18 Plastic to oil IFM002 final report  which sources of feedstock had been tested or demonstrated;  whether the feedstock requires specific preparation before being used by the technology;  how tolerant the technology is to contamination;  where a catalyst is used, the consumption and lifespan demonstrated;  the principal products from the technology;  the residues and wastes produced by the technology;  the typical yield from the technology, and how this varies with feedstock;  the typical operating conditions of the process technology;  the largest system currently operating; and  the constraints on scale-up to larger systems. The results of the review can be found in Appendix A. 2.4 Scoring exercise The information gathered from the literature and technology supplier surveys has been scored on the following basis:  Scale of operation: whether the technology is at laboratory, demonstration or commercial scale. Given the quantity of the low-grade waste plastic arisings in Scotland (discussed in section 3), ‘commercial scale’ is considered as being anything over 10,000 tonnes per annum (tpa).  Extent of the technology demonstrated: whether the operational unit demonstrates the entire integrated process from plastic to oil product, or one or more key stages.  Feedstock: whether the technology has been successfully fed with low-grade waste plastic, higher- grade waste plastic or other materials.  Yield: the proportion of the feedstock converted to oil products, net of any used for process heating.  Quality: whether the oil products are crude products requiring refining, blend components or ‘drop-in’ fuels.  Capital cost of technology: the capital cost of the technology, in pounds per tonne per annum feed.  Operating cost of technology: the operating cost of the technology, in pounds per tonne of feed.  Demonstration operating hours: the number of running hours reported for the operational unit. Table 1 shows the scoring system used for this exercise. Table 2 presents the results of the scoring exercise.
  • 19. Plastics to oil products_ZWS 19 Table 1 Scoring system for identified technologies Score Scale (tpa of feed) Extent of demonstration Feedstock demonstration Yield (% weight) Product quality Capital cost (per tpa) Operating cost (per tonne of feed) Operating period 9 Commercial (> 10,000) Identical to commercial-scale plant Full range of waste plastic > 90 Drop-in fuel < £500 < £50 > 5 years 7 Demonstration (1,000–10,000) Similar to commercial- scale plant Limited range of plastic > 70 Blend component £500–1,000 £50–100 2–5 years 5 Pilot (100–1,000) Parts of commercial- scale plant Relevant wastes (municipal solid waste) > 50 Mixed distillate £1,000–2,000 £100–200 1–2 years 3 Laboratory (< 100) Paper Non-plastic wastes > 30 Crude > £2,000 or confidential > £200 or confidential < 1 year 1 Paper None Paper < 30 N/A N/A N/A N/A
  • 20. 20 Plastic to oil IFM002 final report Table 2 Results of the scoring exercise Technology Supplier Scale Demonstration Feedstock Yield Quality Capex Opex Running hours Overall score Pyrolysis processes Pyrolysis Agilyx 7 9 7 7 3 7 1 7 48 Catalytic pyrolysis Anhui Orsun Env Tech 7 9 7 5 9 3 7 9 56 Pyrolysis Blest 7 9 7 7 3 5 9 9 56 Microwave pyrolysis Climax Global Energy 7 9 5 7 3 7 7 1 46 Pyrolysis Cynar 7 9 7 5 9 5 5 7 54 Fast pyrolysis Dynamotive 9 5 1 7 3 1 7 5 38 Pyrolysis Envion 9 9 7 7 3 5 7 7 54 Catalytic pyrolysis Green Mantra 5 5 5 1 1 1 1 7 26 Catalytic pyrolysis KiOR 9 7 1 1 3 7 1 5 34 Pyrolysis/gasification Klean Industries 7 9 7 7 9 3 3 9 54 Catalytic pyrolysis Natural State Research 3 5 7 1 1 1 1 1 20 Pyrolysis Niutech Energy 9 9 7 1 1 1 1 1 30 Catalytic pyrolysis PARC 9 9 7 5 3 1 1 9 44 Catalytic pyrolysis Plastic2Oil 7 9 7 7 5 1 1 5 42 Pyrolysis Plastoil 7 9 7 1 1 1 1 5 32 Pyrolysis Polyflow 5 7 7 7 5 1 1 3 36 Pyrolysis Promeco 9 9 5 7 5 1 1 5 42 Catalytic depolymerisation processes Catalytic depolymerisation Alphakat 7 9 5 7 5 1 3 5 42 Catalytic depolymerisation Kemia 7 9 7 7 3 1 1 1 36 Catalytic depolymerisation Recycle Energy Co 7 9 7 7 5 1 1 3 40 Catalytic depolymerisation T-Technology 7 9 7 5 3 1 1 7 40
  • 21. Plastics to oil products_ZWS 21 Technology Supplier Scale Demonstration Feedstock Yield Quality Capex Opex Running hours Overall score Catalytic depolymerisation Ventana Cleantech 7 5 7 7 3 1 1 3 34 Catalytic depolymerisation Vuzeta 9 9 5 3 5 1 1 3 36 Gasification and synthesis processes Gasification w/F–T Bioliq 7 7 1 1 9 9 3 5 42 Gasification w/F–T Choren 9 9 1 1 9 1 1 5 36 Gasification w/Bio Coskata 5 5 3 3 9 1 1 5 32 Gasification and ethanol production (non-Bio) Enerkem 9 9 1 3 9 7 1 9 48 Gasification w/Bio INEOS Bio 9 9 1 5 9 5 1 7 46 Gasification w/F–T Rentech 7 5 1 3 9 9 9 5 48 Gasification w/F–T ThermoChem Recovery Intl 9 9 1 3 9 7 1 7 46 Gasification w/F–T Velosys 7 5 1 3 9 3 3 3 34
  • 22. 22 Plastic to oil IFM002 final report These scores are not intended to give a ‘preferred’ technology option for the conversion of plastic to oil products, but are indicative of ranking within each of the three classes of technology. The use of the scores to differentiate between the three technology ‘groups’ in the table above should be treated with caution; for example, some of the gasification processes are demonstrated at scale, but for biomass rather than the target feedstock. Also, care should be taken with the capital expenditure (capex) assessment: as NDAs were not signed with the technology suppliers, it was not possible to obtain full details of the technologies. Capex numbers were obtained for each process but it is not clear what is specifically included or excluded in these numbers. Accurate capex estimation will only be possible when a target project is planned and all necessary equipment is identified. In general, the pyrolysis processes tend to give good yields but produce a crude oil that needs further refining before being suitable for use. Catalytic depolymerisation processes give similar yields to pyrolysis and produce a mixture of distillates that requires less downstream processing to yield a saleable product. Gasification followed by chemical synthesis produces oil products that are direct replacements for fuels, but have much lower yields. In terms of scale, the pyrolysis and catalytic depolymerisation technologies are limited by heat transfer considerations such that a single processing vessel has a capacity of no more than 8,000–10,000tpa, although a number of vessels can be connected in parallel to achieve higher throughputs. Gasification processes do not have heat transfer limitations, and can achieve capacities in excess of 35,000tpa in a single process train. The gasification technology suppliers are more focused on the use of their technology for ‘biomass-to- liquids’ processes, as biomass is currently the most attractive feedstock to them because it offers the necessary scale of feedstock supply and opportunity for subsidies from the creation of ‘biogenic’ fuels and oil products. As a result, they have limited data on the suitability of plastic waste as a feedstock and have no demonstration plants routinely using waste plastics. The pyrolysis and catalytic depolymerisation technology suppliers seem to be more open to the use of non-biogenic feedstocks, especially those arising from industrial processes, and increasingly from waste feedstock sources. However, none of these processes appears to be running at a commercial scale with low-grade ‘non-recyclable’ waste plastics, which are the target feedstock in this report. In general, these companies publish more information on the Internet and are more responsive at interview, although some declined to provide information without an NDA being in place. 2.5 Summary Processes for the conversion of plastics into oil products have been in development for over 20 years, but the low cost of oil has prevented these from becoming economically feasible. Recent increases in oil prices have caused a resurgence in interest in these technologies, within three basic classes of technology: pyrolysis, catalytic depolymerisation and gasification followed by chemical or biological synthesis.
  • 23. Plastics to oil products_ZWS 23 A total of 31 process technology suppliers were examined by a combination of web survey, telephone interview and e-mail correspondence. Each technology supplier was scored on the information gathered. Pyrolysis and catalytic depolymerisation technologies scored well on product yield, but less well on product quality. Conversely, gasification with synthesis technologies scored less well on yield, but give a higher quality product. Within each class, there are plants operating at, or close to, commercial scale. None of these technologies has reached the stage where there are multiple commercial-scale operating plants. None of the plants is reported as routinely running at commercial scale with low-grade ‘non-recyclable’ waste plastics, which are the target feedstock in this report.
  • 24. 24 Plastic to oil IFM002 final report 3 Waste plastics and end-product supply chain 3.1 Background One aim of this project was to assess the potential feedstock material available for a plastic-to-oil process. There is already a well-established recycling network and infrastructure in both Scotland and the UK as a whole for rigid plastics packaging. High-quality, high-value products can be obtained that are suitable for manufacturing in their original or similar applications, for example high-density polyethylene (HDPE) milk bottles. The goal of a plastic-to-oil process within the scope of this project would not be to divert higher quality plastic waste from this well-established and high-value recycling route, so alternative, as yet unrecovered sources of waste plastics must be considered as potential feedstock material. The prime example of waste plastic that may be suitable for a plastic-to-oil process is plastic film from the municipal waste stream. As yet, there is no well-developed processing route for waste film from the municipal waste stream, although there is an infrastructure for film waste from the agricultural and commercial and industrial (C&I) sectors. Therefore, the remainder of this report will consider the main infeed material to any plastics-to-oil process to be plastic film from the municipal waste stream. 3.2 Plastic supply It is estimated12 that between 135,000 and 305,000 tonnes of film waste was generated in Scotland in 2009, less than half of which was recycled. The wide range in this estimation is a result of C&I waste arisings, as there is a lack of data available on this waste stream. However, it is believed13 that recycling of the C&I waste stream is very efficient; a large proportion of the waste film produced from C&I sources is suitable for re-extrusion, either directly or with minimal processing, whilst much of the remainder is exported from the UK for reprocessing. A similar story can be seen with agricultural film, almost all of which is reprocessed in the UK. To a lesser extent construction and demolition waste is also recycled, but on more of an ad hoc basis because of the wide variability of the waste material in terms of quality and polymer type. Therefore, the most promising source for a plastic-to-oil process is household/municipal film waste, approximately 75,000 tonnes of which was produced in 2009.12 A breakdown of this film waste arisings is shown in Table 3. There is currently very little post-consumer/household plastic film recycling activity in Scotland and the UK as a whole.
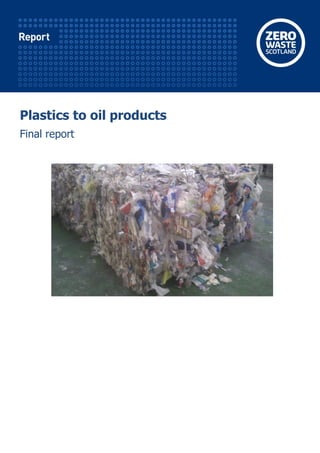
  • 25. Plastics to oil products_ZWS 25 Table 3 Scottish household film waste arisings, 200912 Household film waste arisings Quantity (tonnes) Carrier bags 20,959 Bin bags 14,655 Plastic packaging 31,788 Other plastic film 7,073 Total plastic film 74,475 The properties and physical characteristics of films make it challenging to separate them from other ‘two-dimensional’ materials such as paper, and there is a large number of different film types that are difficult to separate from each other. A particularly problematic issue is the existence of multi-layer films, which consist of several different plastic types. Current film separation techniques (handpicking or automated optical sorting) are able only to inspect the outer layer of the film and therefore cannot distinguish between single- and multi-layer films. For these reasons, where film recovery is undertaken it is with the object of cleaning up other streams, in particular paper, for reprocessing. The strategies used for these clean-up operations result in low- quality plastic film streams, often with contamination levels greater than 30%, producing what is known as ‘Class C’ film. (Film grades range from 98:2 (98 is the percentage film and 2 is the percentage contamination) to 70:30; film of lower quality than this is known as ‘Class C’.) An example of a typical bale of Class C film is shown in Figure 1. The ‘traditional’ waste management method for these streams has been export to China for manual sorting and cleaning; however, China banned the import of household plastic film in 2006. Since that date, anecdotal reports from the waste management industry indicate that the plastic film is now sent directly to landfill or converted into refuse-derived fuel (RDF)/solid-recovered fuel (SRF) to be burned for energy recovery in the Netherlands and other European countries. Meanwhile, in operations in which no recovery is carried out, the film ends up in the residual stream and is also landfilled or converted to RDF/SRF.
  • 26. 26 Plastic to oil IFM002 final report Figure 1 Bale of handpicked Class C film The target feedstock considered for this report is low-grade film that is too highly contaminated or otherwise unsuitable for reprocessing and recycling. There are two major sources of this type of material, namely MRFs sorting and processing municipal waste and composting facilities, although other potential sources include process residues from anaerobic digestion facilities. 3.2.1 Household materials recovery facilities The most desirable, currently available source of low-grade film (primarily polyolefin, low-density polyethylene (LDPE), linear LDPE, HDPE, polypropene) is likely to be household MRFs. By the time this type of film has been through the domestic collection and segregation system, it tends to be fairly contaminated and is generally defined as 70/30 or Class C film. This material is not suitable for mechanical reprocessing or extrusion. It should be noted that MRFs specialising in C&I collections tend to generate higher quality baled film (e.g. from blends of refuse sacks, shrink/pallet wrap). This material generally falls within 98/2, 90/10 or 80/20 categories/grades and is suitable for use within the existing UK reprocessing/extrusion sector.
  • 27. Plastics to oil products_ZWS 27 Table 4 lists a number of the larger MRFs in Scotland handling this type of municipal comingled material, along with the recyclables input and the estimated arisings of low-grade film. This gives arisings of 12,000tpa of low-grade film based on the listed MRF capacity of 645,000tpa (approximately 1.8%). This agrees with previous work14 that demonstrated that Scottish mixed dry recyclables typically contain between 1% and 2% plastic film. SEPA’s estimate of the quantity of household waste recycled in 200915 was 1,061,469 tonnes. Based on this, it is estimated that the MRFs in Scotland could produce a total of 19,000 tonnes of Class C film per year which would potentially be available as feedstock. Included in these figures is any material that may come from waste transfer stations and household waste recycling centres, as the majority of their waste is baled up and delivered to the nearest MRF for sorting and processing. The requirement for separate collection of dry recyclables comes into effect in Scotland from January 2014, including a ban on the landfilling or incineration of separately collected dry recyclables. According to SEPA,15 this will require the recycling of an additional 900,000tpa of household waste, with a corresponding increase in recycling capacity. If this capacity is met by an increase in the number of MRFs, total arisings of Class C film from household waste recycling could reach 35,000tpa. The extra quantity recovered will depend on to what extent the definition of dry recyclables, in the guidance that accompanies the regulations, includes plastic films, and whether local authorities are required or choose to collect this type of material as dry recyclables.
  • 28. 28 Plastic to oil IFM002 final report Table 4 Larger Scottish MRFs Operator Site Input recyclate capacity (tpa) Type of MRF Estimated quantity of low- grade film (tpa) Glasgow City Council Glasgow 80,000Dry household 2,000 Oran Environmental Grangemouth 50,000Dry household 1,000 SAISA – Stirling FibreKilsyth 50,000Dry household, C&I 300 SAICA – Securecycle Kirkcaldy 30,000Dry household, C&I 300 Shanks Glasgow 100,000Dry household, C&I 1,500 Shanks Broxburn 20,000C&I 200 Shanks Dumfries 80,000Mechanical biological treatment 2,000 SITA Aberdeen 50,000Dry household, C&I 1,000 SITA Perth 50,000Dry household, dirty 1,000 Viridor Bargeddie 100,000Dry household, C&I, dirty 2,000 William Tracey Linwood 25,000Dry household, C&I 500 William Tracey Broxburn 10,000C&I 200 Total 645,000 12,000 3.2.2 Composting facilities Composting facilities are also potential sources of low-grade film suitable for reprocessing. Green waste processed in composting facilities contains plastic film and non-film plastics (e.g. plant pots and seed trays) that are heavily contaminated with organic material. These are undesirable components of the composted material and are currently separated and sent for disposal in landfill at a cost of £80 per tonne. This material is of too low quality to be reprocessed for higher quality/value end markets, and thus would be a candidate feedstock for a plastic-to-oil-products process. These facilities may also produce a certain amount of rigid plastic packaging which would also be suitable for processing in a plastic-to-oil technology. The segregation of plastic from the other compost contaminants (wood, metal) is not a routine operation for the majority of facilities, but discussions with some operators who are starting to perform this operation indicate that, for a 30,000tpa composting facility, up to 200tpa of waste film could be recovered if there was a suitable end market. Table 5 lists the composting facilities studied as part of this report. If each site recovers 0.67% of input as waste film, 2,600tpa of low-grade plastic could be available for plastic-to-oil processes. In total it is estimated that about 2,000–3,000 tpa of plastic film could be recovered from these plants. Scotland’s Zero Waste Plan16 estimates total municipal arisings of green waste to be 431,000tpa, all of which will need to be composted in order to comply with the ban on biodegradable waste being disposed of to landfill. Given the total composting input capacity of 393,000tpa calculated in Table 5,
  • 29. Plastics to oil products_ZWS 29 implementation of the Zero Waste Plan will have only a marginal impact on plastic arising from composting facilities. In the longer term, the maximum low-grade plastic film arisings from composting plants will remain at approximately 3,000tpa. Table 5 Composting facilities in Scotland Operator Postcode Input capacity (tpa) Type of composting facility Estimated quantity of low- grade film (tpa) Billy Bowie KA2 0BA 10,000In-vessel composting 70 Glasgow Fruit Market G21 2DU 1,700In-vessel compositing 10 GP Planscape G74 2LD 25,000In-vessel composting 170 Gray Composting ServicesAB45 2XS 5,000In-vessel composting 30 Keenan Recycling Ltd AB53 6YH 32,000In-vessel composting 210 Levenseat Organics AB53 6YH 20,000In-vessel composting 130 Scottish Water Horizons ML11 8EP 30,000In-vessel composting and windrow 200 TEG G68 9AZ 38,000In-vessel composting 250 AH Tucker EH55 8LJ 10,000In-vessel composting 70 William Munro IV16 9XJ 250In-vessel composting 2 Andrew Cook KY1 4DN 10,000Windrow 70 Angus Council DD8 2RL 11,200Windrow 80 Balmaghie Farm DG7 2AA 1,700Windrow 10 Barr Environmental KA18 2RB 18,200Windrow 120 Billie Bowie KA2 0BA 1,300Windrow 10 Binn Farm PH2 9PX 20,500Windrow 140 Dundee Council DD2 3JW 8,340Windrow 60 Falkirk Council EH51 0PU 6,500Windrow 40 Fife Council KY15 7LU 10,500Windrow 70 Fife Council KY12 0RX 21,000Windrow 140 FRM EH39 5PP 32,500Windrow 220 FRM G64 3QN 1,600Windrow 10 FRM EH39 5AH 8,000Windrow 50 Highland Council KW1 4TP 2,132Windrow 10 J Haig Hamilton & Son EH39 5LL 1,350Windrow 10 NPL Estates G2 1PB 4,000Windrow 30 Orkney Islands Council Orkneys 750Windrow 10 Seafield Park IV12 5RZ 15,306Windrow 100 Stirling Council FK7 7JW 12,400Windrow 80 West Lothian Recycling EH55 8DD 13,600Windrow 90 William Tracey KA15 1HZ 20,000Windrow 130 Total 393,000 2,630
  • 30. 30 Plastic to oil IFM002 final report 3.2.3 Anaerobic digestion plants There is a number of anaerobic digestion plants in operation or under development in Scotland. These handle food waste and have issues dealing with any associated plastic packaging, which appears as a heavily contaminated waste stream before or after being processed by the digester. The plastic is contaminated with up to 40% water, undigested organics, paper, card and compostable bin liners. These facilities utilise automated de-packaging equipment before or after the waste is processed in the digester, which removes plastic packaging but does leave it heavily contaminated. The contaminated plastic is currently sent for disposal in landfill at a cost of £80 per tonne. This material is of too low quality to be reprocessed into higher quality/value end markets, and therefore would be a candidate feedstock for a plastic-to-oil-products process. However, the moisture and contamination content of this potential feedstock means that it requires some pre-processing before it can be used by any of the technologies considered in this report. At present, the anaerobic digestion plants do not actively segregate plastic contaminants from the wastes produced by the plant, but there are several development projects in progress that may be able to generate a segregated plastics waste stream that could be suitable for plastics-to-oil processing. No details of the actual quantities of low-grade plastic film arising from anaerobic digestion operations are available at present, but assuming a quantity of 2% (confidential data held by Axion) of the food waste feed gives the estimates in Table 6. The actual quantity will depend on the nature of the food waste, as domestic food waste collections tend to have less packaging than those from food retail and food manufacturing sources. Overall, anaerobic digestion plants could generate between 4,000 and 5,000tpa of low-grade plastic film suitable for conversion into oil products. Scotland’s Zero Waste Plan16 estimates total municipal arisings of food waste to be 581,000tpa, all of which will need to be processed by anaerobic digestion in order to comply with the ban on biodegradable waste being disposed of to landfill. Given the total anaerobic digestion input capacity of 212,000tpa found in Table 6, implementation of the Zero Waste Plan will significantly increase the quantity of plastic arising from anaerobic digestion plants. In the longer term, the maximum low-grade plastic film arisings from anaerobic digestion plants could increase to 10,000–12,000tpa. Table 6 Anaerobic digestion facilities Operator Postcode Input capacity (tpa)Estimated quantity of low-grade film (tpa) CNES H52 9JB 8,000 160 Heat and Power KW17 2DR 3,000 60 J&A Rennie AB53 8BP 20,000 400 Scottish Water HorizonsG68 9NB 30,000 600 Shanks G67 3EN 60,000 1,200 SSE KA24 4JJ 75,000 1,500 TEG PH2 9PX 16,000 320 Total 212,000 4,240
  • 31. Plastics to oil products_ZWS 31 3.2.4 Others There is a significant number of other post-industrial/post-consumer film waste streams that are problematic and would benefit greatly from a secure, local outlet for contaminated non-rigid plastic materials. These include:  Food processors: blood-contaminated plastics, fish farm feed bags/liners.  Construction and demolition sites: concrete sheeting (film), rubble bags.  Sewerage works: plastic ‘debris’.  Biodiesel processors: contaminated packaging.  Agricultural: netting/bale/twine (not silage film/crop cover). While the quantities and quality of these other sources has not been fully researched, it is believed that a further 2,000–5,000 tonnes of film waste per annum could be available through these routes. 3.2.5 Summary of potential feedstock sources In total, it is estimated that approximately 18,000–27,000tpa of low-grade plastic film waste is currently available for reprocessing from MRFs, composting facilities and anaerobic digestion facilities. This could be supplemented by up to 5,000tpa from other sources. This is in reasonable agreement with the 24,000tpa estimated recently in a report for Zero Waste Scotland.17 The current position is summarised in Table 7. Table 7 Summary of plastic availability from existing Scottish waste treatment facilities Source Quantity (tpa) Household MRFs 12,000–19,000 Composting facilities 2,000–3,000 Anaerobic digestion facilities 4,000–5,000 Others (not proven) 2,000–5,000 Total (with Others) 18,000–27,000 (20,000–32,000) 3.2.6 Mapping of potential feedstock sources The sections above are not intended to be a full listing of potential feedstock sources, but they provide a sensible basis on which to build an assessment of potential feedstock and test the viability of processes for conversion of otherwise unrecyclable plastics into oil products. The geographical spread of these sites is displayed in the Google Earth map shown in Figure 2. It can be seen that the majority of MRFs, anaerobic digestion plants and composting facilities are located around the Glasgow and Edinburgh areas. This is to be expected, as the vast majority of the Scottish population is situated here.
  • 32. 32 Plastic to oil IFM002 final report Figure 2 Scottish waste treatment sites that could potentially provide plastic film waste The sites are split into six categories:  MRFs are shown in green;  anaerobic digestion plants are shown in light blue;  composting facilities are shown in dark blue;  waste transfer stations are shown in pink;  household waste recycling centres are shown in white; and  others are shown in yellow. 3.2.7 Comparison of distributed and centralised sites for product delivery Using the information presented in the previous section, an analysis was carried out on how the location and number of plastic processing sites would affect the costs of transporting the plastic film waste from the locations where it is produced, and the cost of delivering the product to a refinery (assumed, for the purposes of the analysis, to be INEOS’s refinery in Grangemouth). The scenarios considered were:  Option 1: A centralised site close to INEOS Grangemouth.  Option 2: A centralised site in Barrhead, near Glasgow.  Option 3: A centralised site near Aberdeen.  Option 4: A distributed network consisting of the three sites above. Driving distances were calculated for the routes between each film production location and each processing site. For the three centralised options, it was assumed that all material would be delivered directly from the locations where it was produced to the centralised site, while for the distributed
  • 33. Plastics to oil products_ZWS 33 network option it was assumed that film would be sent to the closest site. The estimated amount of material sent to each site annually for Option 4 is shown in Figure 3. It can be seen that more than half the material is sent to Barrhead, with most of the remainder being sent to Grangemouth; the site in Aberdeen, meanwhile, receives less than 5% of the total material. This is to be expected from looking at Figure 2, which shows that only a few sites are in operation in the north of Scotland; the vast majority of sites are located in the area around Glasgow and Edinburgh. Figure 3 Amount of plastic film sent to each of the three sites annually for Option 4 (distributed network) It was assumed that all film would be baled prior to delivery, with an average bale weight of 400kg, and that each lorry could hold 48 bales. Using this value it is possible to calculate the number of journeys required to deliver the waste film from each location to a particular site. The cost per journey is calculated by assuming a fixed cost per journey of £225, and an additional cost per mile of £1.30; for example, a 100-mile journey would cost £355 (£225 + £130). The cost of transporting oil products from the production site to the Grangemouth refinery was calculated in a similar way; however, the weight of material per journey was calculated differently as the product is a liquid and is transported in a tanker. The volume of a tanker was assumed to be 38m3, and, using estimated densities for each of the products, it was possible to calculate the weight of product per journey. The total amount of product generated was calculated from the mass balance modelling described in section 4.8. An exception to this is the material produced at the Grangemouth site; as the site is close to the refinery, it is assumed that the products would be taken to the refinery via a pipeline. Therefore there is no transport cost associated with this transfer.
  • 34. 34 Plastic to oil IFM002 final report The values discussed above are summarised in Table 8 and Table 9. Table 8 Variables used to calculate price per journey and number of journeys for waste film transport Fixed price per journey £225 Additional cost per mile £1.30 Number of baled pallets per lorry 48 Weight of film per pallet 400kg Weight of material per lorry 19.2 tonnes Table 9 Variables used to calculate the number of journeys for waste film transport Volume of product per tanker 38m3 Diesel density 850kg/m3 Gasoline density 720kg/m3 Ethanol density 790kg/m3 The total annual cost for each route (film production location to processing site and processing site to refinery) was calculated by multiplying the number of journeys per year by the cost per journey; the costs for all the routes were then summed to give the total cost for the option. These calculations are summarised in Figure 4 and Figure 5, which show the annual cost and distance travelled, respectively, to transport material to and from the processing sites for each option. Note that these values have been calculated using the pyrolysis process, but all other processes show the same qualitative results.
  • 35. Plastics to oil products_ZWS 35 Figure 4 Cost of transporting material to and from processing sites for each option Figure 5 Total distance travelled annually to deliver material to and from processing sites for each option
  • 36. 36 Plastic to oil IFM002 final report It can be seen immediately that Option 3 is by far the worst option in terms of both cost and total distance travelled. This is to be expected, as the majority of the material would be transported from the Glasgow/Edinburgh area up to Aberdeen for processing and then back down to Grangemouth for refining, resulting in a significant amount of ‘double handling’ of the material that arises close to the final destination (the refinery). The transport costs for film delivery for Options 1, 2 and 4 are very similar; however, there are large differences in the cost of oil delivery, with Option 2 having the largest overall cost, followed by Option 4. Option 4 gives the shortest total distance travelled, even including oil delivery; this is because each location where film waste is produced can choose to deliver to the closest processing site. However, as shown in Figure 3, this results in the Aberdeen site receiving only 820tpa; this annual tonnage is not likely to be economically viable for any of the options considered in this report. Based on both cost and total distance travelled, therefore, one centralised site based in Grangemouth is the best option. This is dependent on there being a suitable site close to the INEOS refinery that can feed the oil products to the refinery by pipeline, thereby avoiding extra transport costs. However, it may be beneficial to introduce a network of local collection sites where waste plastic can be aggregated before delivery to the processing site in bulk. This will be particularly useful in capturing material from operators who either do not produce enough material to justify a dedicated transport service or do not have the space to store waste material until there is enough of it to transport. 3.2.8 Current waste management practices Currently there are no reprocessing routes for low-grade mixed film in Scotland. The material that is segregated and baled by MRFs and other producers has three destinations:  export to Asia (currently restricted because of export regulations, typically at a cost of £0–30 per tonne collected);  export to the Netherlands as RDF/SRF, with a typical gate fee of £60 per tonne plus transport; and  landfill, with a typical gate fee of £80 per tonne plus transport. The ‘traditional’ outlet (over the last 10–20 years) has been export to Asia and, effectively, has been a ‘zero disposal cost’ outlet. With this no longer available in the same manner, the ‘standard’ route is now export as RDF/SRF to energy from waste (EfW) facilities in mainland Europe, which certainly has the capacity to handle all the material of this type generated in Scotland. For example, the Netherlands has an EfW capacity of 6.8 million tonnes of waste per annum. However, there is a significant cost penalty and a typical medium-sized MRF in Scotland will be incurring costs in excess of £100K per annum for disposal of low-grade mixed film through EfW. The additional complications associated with trans-frontier movement of waste, create uncertainties over shipments and can make local landfill a preferred option.
  • 37. Plastics to oil products_ZWS 37 3.2.9 Future trends As discussed in the preceding sections, Scotland’s Zero Waste Plan will increase the quantities of household and other waste being processed by MRFs, composting facilities and anaerobic digestion facilities. This will cause a corresponding increase in the quantities of low-quality plastic film available for conversion to oil products. The future availability is summarised in Table 10. Table 10 Estimated future availability of plastic film from Scottish waste treatment facilities Source Quantity (tpa) Household MRFs 35,000 Composting facilities 3,000 Anaerobic digestion facilities 12,000 Others (not proven) 5,000 Total (with Others) 50,000 (55,000) The predictions of future arisings assume that the proportion of packaging film associated with household recyclables sent to MRFs and food waste sent to anaerobic digestion facilities remains at its current level. It should be noted that WRAP and others are investigating opportunities for reducing the quantity of packaging associated with food and consumer products. This may mean that the future availability of low-grade plastic film from these sources is overestimated in the table above. However, the table above does not include the additional potential for low-grade plastic film arisings from C&I MRFs or anaerobic digestion facilities processing food waste from food manufacturers or back of store. As existing landfill capacity for non-hazardous waste is of the order of 16 years, Scotland’s Zero Waste Plan has a target of less than 5% of municipal waste to be sent to landfill by 2025. There will be increasing pressure on waste management companies not to use local landfill, by implementation of landfill bans and the increase in landfill tax to £80 per tonne in 2014. There is a large number of EfW developments proposed for Scotland, with total capacity that exceeds the current 25% cap on local-authority-collected waste treated in EfW plants. The introduction of proposed EfW plants in Scotland will offer an alternative disposal route for low-grade mixed film (and for RDF/SRF) when and if they come on stream. Therefore, a Scotland-based plastics-to-oil-products plant will need to demonstrate a lower operational gate fee than local EfW facilities for it to be viable. It is not clear whether the thermal processes for converting otherwise unrecyclable plastic to oil products will be considered as constituting EfW by the Scottish Government – this question is discussed further in section 7.5. Clearly any plant/process/technology based in Scotland that can offer a competitive gate fee will attract material. Economics will be the driver and this highlights the need for any proposed project to gain efficiencies by being integrated within an existing chemicals/materials processing facility
  • 38. 38 Plastic to oil IFM002 final report (preferably in a ‘government-assisted area’) where, in addition to services being shared, output streams can achieve highest potential value. 3.2.10Summary – plastic supply It is estimated that the quantity of low-grade waste plastic film currently available in Scotland is between 18,000 and 27,000tpa. The majority of this arises from MRFs processing municipal household recyclates, with additional material from composting and anaerobic digestion facilities. Currently, this material is landfilled, exported to Europe as SRF/RDF or exported to Asia for recycling (although the latter is becoming increasingly more difficult). The implementation of Scotland’s Zero Waste Plan will increase the material processed by MRFs, composting facilities and anaerobic digestion facilities such that the quantity of material available for conversion to oil products reaches 50,000tpa. There may be increasing competition for this material as the number of ‘conventional’ EfW plants in Scotland increases. An analysis of the transport costs associated with proposed processing site networks shows that one centralised site based in Grangemouth is the best option. This is dependent on there being a suitable site close to the INEOS refinery that can feed the oil products to the refinery by pipeline, thereby avoiding extra transport costs for the oil products. 3.3 End markets for oil products 3.3.1 Current market for transport fuels The 2009 Department of Energy & Climate Change assessment of sub-national road transport fuel consumption estimates Scottish consumption of gasoline at 1.18 million tonnes per year, with diesel fuel consumption at 1.83 million tonnes per year. The majority of this is sold via Scotland’s network of over 900 fuel forecourts, with a number of owners, including the major oil companies and supermarkets. Despite this diversity, the majority of transport fuel in Scotland is sourced from INEOS’s Grangemouth oil refinery, which has an annual output of around 8 million tonnes of finished oil products, of which approximately 1 million tonnes is gasoline and 1.8 million tonnes is diesel fuel. Some finished products are imported by ship to marine terminals on the River Clyde, and at other locations, and distributed by independent fuel traders, but these serve less than 25% of Scotland’s road transport fuel requirements. Other than the addition of biofuels (ethanol and biodiesel) at these terminals, no fuel blending operations exist other than at Grangemouth. Northburn Industrial Services operates Scotland’s only facility for the manufacture of processed fuel oil from waste oil with a capacity of 25,000tpa, although this facility does not make transport fuels. Argent Energy at Motherwell produce up to 45,000tpa of biodiesel from tallow and used cooking oil – this is approximately 50% of the total biodiesel required in Scotland to meet the Renewable Transport Fuel Obligation (RTFO).
  • 39. Plastics to oil products_ZWS 39 The potential scale of a plastic-to-oil-products industry in Scotland is unlikely to have a significant impact on the existing oil refining, oil recovery or biodiesel industry in Scotland. Changes in vehicle type, vehicle use and engine efficiency mean that diesel is generally in short supply and gasoline long, especially in north-west Europe where refineries are predominantly configured for gasoline production. In this context, a process for converting currently unrecyclable plastic waste to a diesel-type product would be more attractive than a similar process to obtain gasoline or ethanol. A number of options exist to introduce oil products produced from plastic into the transport fuel supply chain:  Introduce a plastic-derived crude oil into the Grangemouth refinery.  Introduce distilled oil products into the fuel blending pool at the Grangemouth refinery.  Introduce drop-in fuels meeting the specifications of EN590 (diesel) or EN228 (gasoline) into the fuel distribution chain. 3.3.2 Introducing plastic-derived crude oil to Grangemouth refinery The plastic-derived crude oil products from pyrolysis or catalytic depolymerisation could be added to the feedstock currently used at the Grangemouth refinery. Although the quantity of oil introduced is very much smaller than the 9 million tonnes of geological crude oil processed by the refinery each year, refineries are highly tuned integrated systems, optimised to process a particular feedstock (in this case chiefly crude oil from the North Sea). Small changes in composition or the introduction of unusual contaminants can upset the operation of the plant. The introduction of plastic-derived crude to the crude distillation unit has been considered and rejected by INEOS on the grounds that unsaturated hydrocarbons would upset product quality and oxygenates would increase gum formation and fouling of the crude preheater train. A better option would be to introduce the plastic-derived crude to a catalytic cracking unit as this may have less of an impact on the downstream processes. The principal concerns raised by INEOS with this option were the possible presence of metals that would poison the catalyst and the impact of the presence of oxygenates in the unit. These concerns would need to be allayed before proceeding further. It may be possible, with INEOS, to identify a way to close-couple a plastic-derived crude into the refinery, but this would come at a cost: in the form of increased project capex, which would need to be included in the overall project economics. 3.3.3 Introducing distilled oil products to Grangemouth refinery At an oil refinery, the production of finished fuel products (diesel, petrol, aviation fuel, etc.) is optimised by blending a number of distilled products from various parts of the refinery such that the final product meets the relevant fuel specification. These distilled products are known as blendstocks. Depending on the technology supplier, processes for the conversion of plastic into oil products either incorporate distillation in the process or produce a plastic-derived crude oil that would need to be distilled in a separate facility. In either case, the distilled plastic-derived oil could meet the finished fuel specification, but is more likely to be useful to the refinery as a blendstock.