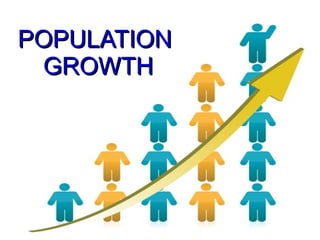
Population growth
•Download as ODP, PDF•
2 likes•323 views

A presentation with pictures and some activities aimed at my bilingual pupils in 3rd ESO to work in English.

Recommended
Recommended
More Related Content
More from FJavier GómezL
Recently uploaded
Recently uploaded (20)
Population growth
- 2. 2 In the beginning...In the beginning... ● The populationThe population ________ veryvery ________ becausebecause theythey ________ have muchhave much food.food. ● They life expectancyThey life expectancy was verywas very ________ because people didn'tbecause people didn't livelive ________.. ● The world was still anThe world was still an ________ place.place.
- 3. 3 Around 9,000 years ago...Around 9,000 years ago... ● In the NeolithicIn the Neolithic people invented ____people invented ____ and _____ .and _____ . ● This means that moreThis means that more food was ____food was ____ ● So population grewSo population grew _____ than before._____ than before. Although, it still grewAlthough, it still grew slowlyslowly..
- 4. 4 Around 2000 and 200 yearsAround 2000 and 200 years ago...ago... ● Since theSince the ______________ ofof our era to 1800, worldour era to 1800, world populationpopulation ______________ 11 billion people.billion people. ● ________ 1800 to _____1800 to _____ dayday, world popuation, world popuation has reached 7 billionhas reached 7 billion people on Earth.people on Earth. ● How has this _____How has this _____ been possible?been possible?
- 5. 5 The ______ that explain the populationThe ______ that explain the population growtn are...growtn are... ● a) …a) … ● b) …b) … ● c) ...c) ... A) B) C) A) C)
- 6. 6 ● People usually diePeople usually die when they are old,when they are old, soso l___ e____ hasl___ e____ has increased and peopleincreased and people live …live … Nowadays,...Nowadays,...
- 7. 7 ● In some places peopleIn some places people have …have … ● In other places peopleIn other places people are still having ...are still having ... Nowadays, …Nowadays, …
- 8. 8 Since the 19Since the 19thth century...century... ● The IndustrialThe Industrial Revolution ______Revolution ______ many jobs.many jobs. ● People used to getPeople used to get married young, somarried young, so they ____ morethey ____ more children.children.
- 9. 9 For thousand of years, people thought...For thousand of years, people thought... ● That diseases wereThat diseases were caused by _____ orcaused by _____ or were a punishmentwere a punishment from ____.from ____.
- 10. 10 Since the 19Since the 19thth century...century... ● I___I___ ● V___V___ ● H___ C___H___ C___ ● Have allowedHave allowed population to grow.population to grow.
- 11. 11 THE SPANISH FLUTHE SPANISH FLU
- 12. 12 POPULATION GROWTHPOPULATION GROWTH IES LA RÁBIDA DPTO GEOGRAFÍA E HISTORIA Prof. Javier Gómez
Editor's Notes
- SLIDE 2 Students will need some explanations about some words. For example, they may not know the meaning of crowded and gathering. ACTIVITIES: 1. Read aloud the slide and complete the gaps with one word from each couple; use the verbs in the appropriate tense: To grow or To decrease - Quickly or Slowly – Low or High - Long or Short – Empty or Crowded GAPS: grew, slowly, didn't, low, long, empty. 2. Answer orally the following questions about both pictures: - What do you see in these pictures? What are these people doing? - Why did they do these things? Why are they hunting and gathering? - Did they get enough food? How did this fact affect the population growth? Vocabulary: hunt, gather, to get food, did not, grow, slowly.
- SLIDE 3 ACTIVITIES Difficult word: stock-breeding. 1. Read aloud the slide and complete the gaps with one word from each pair: Help: Agriculture - Writing Stock-breeding – Mathematics Produce – Manufacture / Slower - Faster 2. Answer orally the following questions about the pictures: - What do you see in these pictures? What are people doing? - Why are they doing these activities? - Did they get enough food? How did this fact affect the population growth? Well, they got more food than before, and population grew faster. Vocabulary: harvest, crop, raise, milk, village,
- SLIDE 4 Difficult word: Steady or steadily. 1. Read aloud the slide and complete the gaps with one word from each pair: End – Beginning / Reach (Reached) – Finish From – For / Present – Last Increase - Decrease 2. Answer the following questions (ìn your exercise book): - What do you see in these pictures? Could you describe them? - What does the upper graph show? - What does the second graph show? Vocabulary: graphs, axis, two axis, vertical one..., horizontal one... red line, steady/steadily, slowly, from … to … blue line, from... to..., steady/steadily, faster growth, mainly since 1960
- SLIDE 5: Difficult words: neglect, vaccine, care. FIRST ACTIVITY: Students have to read aloud the slide, and complete the gaps with the help of the options. OPTIONS FOR THE GAPS: reasons, objects, little food, nutritious food or food pyramid, medical care, medical neglect, clean water or running water. SECOND ACTIVITY: Then, they have to answer orally some questions about the pictures, more or less like the following ones: What do you see in the pictures? a) Nutritious food. Where do you buy it? Who does the shopping in your family? b) Medical care. When was the last time you went to the doctor? When did you get your last vaccine? c) Clean water or running water. Have you ever been without water in your home? When? Why? Vocabulary: Nutritious, food pyramid, medical care, vaccine, vaccination, vaccinate, disease, tap.
- SLIDE 6: ACTIVITIES: 1. Read the slide aloud and complete the gaps. Options: Life expectancy, Live expectancy, Longer, Longevity. 2. Answer orally (or in the exercise book) these questions about the pictures: - What do you see in the picture in the bottom right-hand corner? Vocabulary: old, couple, elderly, happy, smiling, marriage, have been married for …, in love. - What does the map show? The map shows the life expectancy in the world. - What do the colours mean? Darker colours mean... Lighter colours mean... - In what continents or countries is the life expectancy higher or lower? Compare life expectancy in... and ... - What does the graph show? Could you describe the graph? Description: axis, lines, what they mean. It shows the increase in life expectancy from --- to -- and includes a forecast or estimate until – - What's the difference between more and less developed countries?
- SLIDE 7: 1. Complete the gaps: few or little children / much or many children. 2. Answer the questions orally: - What do you see in these pictures on the right side? Vocabulary: Two different kinds of families: Nuclear family-extended family Large family-little family. 3. Answer in your note book: - What does the map show? Birth rate in the world. - What do the colours mean? - Where is the birth rate higher o lower? - How is the birth rate in ….? Compare the birth rate in – and ---.
- What do you see in both pictures? People working in factories. What kind of people? How did the Industrial revolution affect the population growth? How did the Industrial revolution contribute to the population growth? GAPS: provided, had.
- What do you see in these pictures? Sick people lying on bed. Spots o pimples. A man throwing flowers against bad smell. Help: Two stars or comets. A rain of blood. Misfortunes or tragedy. Destroy, destruction. Investigation. Rational. Gaps: evils or God.
- What do you see in these pictures? People investigating, examining sth under the microscope. Looking at sth under the microscope, observing. Some syringes with vaccines. A boy or girl washing his/her hands. GAPS: investigation, vaccines, hygienic conditions.
- Do some research on the Spanish flu to answer the following questions: - What's the Spanish flu? - When did it break out? And where? - Was it really born in Spain? Why was it named Spanish flu? - What importante event was happening in Europe at the same time? - Did this event have any influence in the spread of the flu? - Answer the questions in you notebook and then write an essay with the information you have. .