SlideShare a Scribd company logo
1 of 18
Download to read offline
First Pages
94
Chapter Six
Mail
Telephone Salesperson
Order
complete?
New
customer
No
No
Set up customer
account
Accounting
prepares invoice
Shipping
checks stock
Order
preparation
Orders
received
Order
verification
Back order
placed
Shipment
made
No YesItems
in stock
Order sent to
accounting and shipping
Yes
Yes
Flowcharting
AIS in the Business World
Billing Process
The “AIS in the Business World” for Chapter 4 discussed the implementation of “lean
thinking” at Woburn Safari Park. Tatikonda (2008) applied the concepts of lean
thinking to the customer billing process most companies use. She provided the
following illustration as part of her discussion:
In this chapter, we’ll begin discussing methods for documenting accounting
information systems. We’ll start with the most commonly used method: flowcharting.
hur25338_ch06_093-111.indd 94hur25338_ch06_093-111.indd 94 20/09/11 4:01 PM20/09/11 4:01 PM
First Pages
Chapter 6 Flowcharting 95
Discussion Questions
1. How are flowcharts used in accounting information systems?
2. What are the strengths and weaknesses of Tatikonda’s flowchart?
Source: L. Tatikonda, “A Less Costly Billing Process,” Quality Progress, January 2008.
In practice, you may often be called upon to evaluate a system’s risk exposures; recom-
mend ways to achieve stronger internal control; and/or suggest one or more ways to make
a system more efficient and effective. In those situations, you’ll want a way to encapsulate
the essential features of an accounting information system: its documents, personnel
involved, information flows, and related technologies.
When you complete your study of this chapter, you should be able to:
1. List and discuss the purpose and use of systems flowcharts, document flowcharts, pro-
gram flowcharts, and hardware flowcharts.
2. Explain the basic parts of and design considerations common to all types of flowcharts.
3. Identify and describe common symbols and information technology tools used in
flowcharting.
4. Discuss ways flowcharts impact the design, implementation, and evaluation of account-
ing information systems.
5. Create and interpret systems flowcharts.
A good flowchart is like a snapshot of an information system. It can tell you, at a glance,
where information originates, who handles the information, and how it is summarized for
decision making. Like most of the rest of AIS, flowcharting is at least as much art as sci-
ence. The keys are to make your flowcharts as easy to read and as understandable as pos-
sible and to develop them in sufficient detail to provide an accurate picture of what’s going
on in an accounting information system.
FLOWCHART TYPES AND CONVENTIONS
Basically, a flowchart is a graphical representation of some part of an information system.
The information system might be focused on accounting, production, human resources, or
marketing; it might be related to a particular project such as launching the space shuttle or
evaluating employee performance. Flowcharts have been used by information technology
professionals for years to document computer programs; they also can be used to depict the
hardware associated with a computer information system.
Flowcharts often are classified by their overall purpose and function:
• Systems flowcharts give the user a “big picture” look at an information system. Con-
sider, for example, the process you use to register for classes each term. You use certain
documents and types of information technology to select and register for classes; a systems
flowchart would combine all of those resources with their related business processes.
• Program flowcharts show the logic associated with a computer program. As an
accountant, you probably won’t have much to do with program flowcharts.
I am indebted to my
colleague, Dr. Kathy
Hurtt of Baylor Univer-
sity, for focusing my
thinking and providing
valuable insights in the
revision of this chapter.
(And no, she’s not
related to me.)
hur25338_ch06_093-111.indd 95hur25338_ch06_093-111.indd 95 20/09/11 4:01 PM20/09/11 4:01 PM
First Pages
96 Part Two Documentation Techniques
• Document flowcharts, as you might expect, show the various documents involved in
a system; they also portray the procedures performed on those documents. So, for
example, a document flowchart might show your federal income tax return from the
time you receive a blank form through its eventual disposition with the Internal Reve-
nue Service.
• Hardware flowcharts will probably be a minor concern in your accounting career as
well. They show the computers, printers, monitors, input devices, and other hardware
elements associated with an information system.
Although two different people can look at the same business process and draw flowcharts
that are significantly different, they should generally observe some very common conven-
tions (habits) associated with good flowcharting:
1. Flowcharts should be read from top to bottom and left to right—the same way you read
a page in a book. Flowcharting, though, is a highly iterative process, meaning that most
folks don’t “get it right” the very first time. So, the design may not proceed in such a
neat and orderly fashion. But, when the final flowchart is produced, users should be
able to follow it easily.
2. Flowcharts should have plenty of “white space.” In other words, they shouldn’t be too
crowded on the page. If you’re like most accounting students, you’re thinking, “How do
I know if it’s too crowded? Is there a rule?”Well, no. Generally, if you think a flowchart
looks too crowded, it probably is. In that case, it needs to be broken up into more than
one page for easier reading.
3. Flowcharts should have a title. A bunch of symbols on a page can be confusing to read
and evaluate if you don’t know what they’re trying to present. So, it’s a good idea to title
your flowchart based on what it represents; for example, “Systems flowchart of the
employee evaluation process.” The title should also include the name of the company,
the date the flowchart was prepared, and the preparer’s name. If the flowchart spans
multiple pages, they should be numbered as “1 of x, 2 of x,” and so on.
4. Flowcharts should be organized in columns that depict areas of responsibility. For
example, purchasing inventory in most organizations involves departmental manag-
ers, purchasing agents, and vendors. So, a systems flowchart that shows the purchas-
ing process would typically have three columns—one for each area of responsibility.
Areas of responsibility will most commonly be the names of departments/functions/
job titles within the organization; we don’t typically use a person’s name as a column
heading.
6.1Reflection and Self-Assessment
4. Path of a sales invoice through an information
system.
5. Origination, processing, and termination of a pay-
roll check.
6. Local area network configuration.
7. Employee evaluation process.
What type of flowchart would be most appropriate in
each of the following situations?
1. Steps in a Visual Basic program for producing finan-
cial statements.
2. Steps associated with purchasing inventory.
3. Relationships between a central server and desktop
computers.
hur25338_ch06_093-111.indd 96hur25338_ch06_093-111.indd 96 20/09/11 4:01 PM20/09/11 4:01 PM
First Pages
Chapter 6 Flowcharting 97
5. Documents involved in a business process should have a clear origin and a clear termi-
nation. They shouldn’t appear “by magic” in the middle of a flowchart, nor should they
disappear from the system. A “clear origin” means the document first appears in the
column where it enters the system. Documents typically originate in one of two ways:
(a) they enter the system from some external entity, or (b) they are created by some
process within the system.
6. Rough drafts of flowcharts should be discussed by people involved in the process. Such
discussions serve as a “reality check.”They also help ensure that the flowchart is easily
understood by someone other than the designer.
Adhering to those six conventions will make your flowcharts a lot easier to read and under-
stand; they’ll also be considerably more useful in the design, evaluation, and implementa-
tion of accounting information systems.
FLOWCHARTING TOOLS AND SYMBOLS
Flowcharts can be designed using a variety of tools, both high-tech and low-tech. On
the low-tech end, you can draw a flowchart with paper and pencil. You also can use a
flowcharting template, which includes many common flowcharting symbols. While
manual methods are useful for “quick and dirty” starts at a flowchart, they can become
tedious and messy over time.
Fortunately, numerous software programs facilitate the preparation of good flowcharts.
Two programs I’ve found useful are Microsoft Visio and SmartDraw. Visio is part of
the Microsoft Office Suite, so it interfaces fairly well with other programs such as Word,
PowerPoint, and Excel. SmartDraw is an independent software program, but it also does a
good job with designing all kinds of flowcharts; generally, they also can be read by Office
software. Of course, you can use just about any software package that has some graphics
capability to design a flowchart—even something as simple as PowerPoint! The advantage
of using a program specifically designed for flowcharting, like SmartDraw or Visio, is its
adherence to the flowcharting conventions discussed earlier. Additionally, flowcharting
programs typically have a wider variety of flowcharting symbols in their libraries than
other programs designed for different purposes.
You can find more
information about Visio
at http://support
.microsoft.com/ph/2529.
Check out SmartDraw
on its Web page: www
.smartdraw.com. It
comes with a free trial
that you might find use-
ful for your AIS course.
Point your Web browser to www.download.com. Search for flowcharting programs. Identify and describe two other
programs you could use to create flowcharts.
6.2Reflection and Self-Assessment
Because flowcharts represent a kind of “universal language” in information systems
design, implementation, and evaluation, they have some common symbols with specific
meanings. According to the American National Standards Institute (ANSI), flowchart sym-
bols can be divided into four groups: data, process, line, and special. Consider the symbols
shown in Figure 6.1, which are just a small subset of the many symbols associated with
flowcharting.
Now, let’s take a look at how the symbols are put together to construct an actual
flowchart.
hur25338_ch06_093-111.indd 97hur25338_ch06_093-111.indd 97 20/09/11 4:01 PM20/09/11 4:01 PM
First Pages
98 Part Two Documentation Techniques
6.3Reflection and Self-Assessment
• File (merge)
• Generic process
• Off-page connector
• Predefined process
Which flowcharting symbol is used to depict each item
below? Give an example as well as a description. (You’ll
need to do some outside research for this exercise. You
could start by examining the “auto shapes” in Word or
PowerPoint.)
• Annotation
• Decision
FLOWCHART DESIGN STEPS
As you might suspect, there’s no “one right way” to design a flowchart. But, my AIS stu-
dents often ask me the steps I use to prepare one, so I’m adding this section. When I pre-
pare a flowchart, I normally follow this seven-step process:
1. Establish the system boundary. The system boundary is critical in designing a flow-
chart. Without a well-established system boundary, you end up “analyzing the world”
every time you draw a flowchart. The system boundary puts a virtual “box” around the
system; this process is sometimes called “delimiting.”
For example, if I’m flowcharting the process a company uses to purchase inventory,
the system boundary is likely to be the company itself. The outside vendor (i.e., inven-
tory supplier) is only important to the extent that it interacts with the company. So, while
the flowchart is likely to include a column titled “vendor,” the actions in that column do
FIGURE 6.1
Selected
Flowcharting
Symbols
On-page connector (special):
shows where a document or
process continues on the
same page.
Multiple copies of a single
document (data): shows that
a single document, such as a
purchase order, has several
copies, which would be
numbered and tracked
separately in the flowchart.
If a document doesn’t have
copies, the “top layer” only
would be enough.
Disk storage (data): denotes
storage on a hard drive,
CD, or similar medium.
Manual process (process):
used when data are processed
manually, such as writing
a check or preparing a
sales invoice.
Terminator (special):
starts or ends a business
process; also can be used
to show destinations such
as “the bank.”
hur25338_ch06_093-111.indd 98hur25338_ch06_093-111.indd 98 20/09/11 4:01 PM20/09/11 4:01 PM
First Pages
Chapter 6 Flowcharting 99
not include how the vendor processes the purchase order. The vendor column would
include receiving the purchase order, shipping the goods, and billing the client.
2. Determine column headings. As mentioned above, column headings should focus on
areas of responsibility—usually department names, functions, or position titles.
For example, in a “purchase inventory” flowchart, column headings would include
requesting departments, purchasing department, accounting department, receiving
department, and vendor.
3. List actions performed within each column. In this step, list what each department does
within the system. Notice that we haven’t yet begun thinking about how to represent
those actions with flowcharting symbols. It’s important to have a good, clear idea of
what goes on in the system before thinking about the symbols. Because flowcharting is
a highly iterative process, you might find it necessary to revisit the column headings at
this stage—always keeping in mind the system boundary so the flowchart doesn’t grow
out of control.
For example, the purchasing department would: (a) receive purchase requisitions
from requesting departments; (b) prepare a purchase order; (c) send the original pur-
chase order to the vendor; and (d) send copies of the purchase order to the requesting
department, the accounting department, and the receiving department.
4. Select appropriate symbols. Once I have the list of actions, I think about what flow-
charting symbols will best represent them. As you’ll see in the flowchart examples
throughout the text, I tend to focus on a small group of commonly recognized symbols.
Refer to Figure 6.1 and Reflection and Self-Assessment 6.3 for the actual symbols.
Here are a few comments about each one:
a. Annotation. This symbol is used to add descriptive comments or explanations to a
flowchart.
b. Decision. Decision symbols have a single point of entry, but multiple exits. For
example, in a personnel selection process, the entry point might be “receive applica-
tion documents.” The decision symbol itself would be labeled “Meets qualifica-
tions?” and the two exits would be “yes” and “no.”
c. Document. Figure 6.1 shows multiple copies of a document. The same symbol would
be used alone if a document had no copies.
d. File. Sometimes referred to as “merge,” this symbol should always indicate how the
documents are filed. Examples include by name or by date.
e. Generic process. This symbol can be used for any process in a flowchart. Because it
symbolizes a process, it should always be labeled with a verb phrase, such as “receive
applications” or “prepare purchase order.”
f. Manual process. If you know a process is manual (i.e., doesn’t involve IT), you can
use this symbol instead of the generic process.
g. On- and off-page connectors. Readability is a critical feature of flowcharts. To avoid
crossed lines on a page, use an on-page connector. To avoid overcrowding and move
the action of a flowchart between pages, use an off-page connector. On- and off-page
connectors always come in pairs with the same label. You can use letters for on-page
connectors and numbers for off-page, or vice versa—just be consistent.
h. Predefined process. Use this symbol to encapsulate a named process with multiple
steps. The multiple steps should either be readily understood by the person reading the
flowchart, OR they should be specified elsewhere (such as in a separate flowchart).
“Complete the steps in the accounting cycle” is an example of a predefined process.
hur25338_ch06_093-111.indd 99hur25338_ch06_093-111.indd 99 20/09/11 4:01 PM20/09/11 4:01 PM
First Pages
100 Part Two Documentation Techniques
i. Terminator. I tend to use the terminator symbol only to mark the start and end of a
flowchart. But, it can also be used to show entry from/exit to some point outside the
system boundary.
5. Prepare a first draft. Once I’ve decided on symbols, I draw a first draft of the flowchart,
keeping in mind the design conventions listed above.
6. Discuss the flowchart with others. Because flowcharting is somewhat subjective and
highly iterative, the first draft is rarely the final product. It’s important to get feedback
on the draft from other people, because they can tell you what seems unclear from an
outsider’s point of view. Although there’s no “magic number” of people you should con-
sult, I usually try to ask two or three colleagues about the draft.
7. Revise as needed. Based on those suggestions, I revise the flowchart as necessary to
make it clearer. For your first few flowcharts, you might need several rounds of revi-
sion. As you become more experienced, you might be able to cut them down to just one
or two.
In the next section, we’ll look at an example flowchart.
SAMPLE FLOWCHARTS
In this section, we’ll look at an example flowchart for common parts of an accounting informa-
tion system. Carefully read and study the example. As an AIS professional, you’ll need to be
comfortable in “both directions” with flowcharts; that is, looking at a flowchart and describing
it in narrative form and reading a narrative description and preparing a flowchart.
As a student, you see a “finished product” when your professor comes into the class-
room at the start of a new term. But, have you ever thought about what happens in prepara-
tion for that first class meeting? Even for a class a professor who has taught repeatedly,
most of us spend considerable time “up front” designing a course. In this section, we’ll use
the first five flowchart design steps listed above to create a systems flowchart of the course
design process. (I’m omitting the last two steps from the discussion because they are fairly
self-explanatory.)
1. Establish the system boundary. This flowchart begins with an already established course;
that is, a course that already has a title, a description, a course number, and other details.
It’s already been through whatever approval process the university has established. The
task before us is to figure out how to apply the general ideas from the approved docu-
ments to design a particular offering of a class. The process will end when all the course
materials are ready; it will not include the delivery of the course to students.
2. Determine column headings. Given that system boundary, what parties are involved in
course design? We’ll include two in our flowchart: the designer (i.e., the faculty member
teaching the course) and the publishers (who will provide materials like textbooks).
3. List actions performed within each column. Here are the actions commonly performed
by each party identified above:
a. Designer
i. Establish expected student outcomes. (generic process)
ii. Develop preliminary list of possible textbooks/articles/cases. (generic process)
iii. Order exam copies. (predefined process and document)
iv. Review exam copies. (predefined process)
v. Select course materials. (manual process)
hur25338_ch06_093-111.indd 100hur25338_ch06_093-111.indd 100 20/09/11 4:01 PM20/09/11 4:01 PM
First Pages
Chapter 6 Flowcharting 101
vi. Determine topic sequence. (generic process)
vii. Develop grading plan. (predefined process)
viii. Choose/create additional course materials. (decision, predefined process, document)
ix. Write syllabus. (generic process and document)
x. File course materials. (file)
b. Publisher
i. Receive and process orders for exam copies. (predefined process)
ii. Send exam copies to the designer. (document)
4. Select appropriate symbols. The symbol we’ll use for each action above is shown in
parentheses after the action.
5. Prepare a first draft. See Figures 6.2 and 6.3 for the flowchart.
Does every professor follow those exact steps to design a course? Probably not. Would
every flowchart of those exact steps look like Figures 6.2 and 6.3? Definitely not. But, you
could use the flowchart as a basis for teaching someone how to design a course or for help-
ing someone (like an AIS student) understand what happens before their professor sets foot
in the classroom each term.
Here are some additional notes about the flowchart:
1. In this example, the on-page connectors are labeled with numbers. You could also use
letters instead.
2. The off-page connector has two important pieces of information. In Figure 6.2, it shows
the destination page (p. 2) and an identifier (A). In Figure 6.3, it shows the source page
(p. 1) and the same identifier (A). If you use letters for on-page connectors, it’s a good
idea to use numbers for off-page connectors.
FIGURE 6.2 Systems Flowchart of Course Design Process Page 1 of 2
Publisher
Process
order
Exam
copies
1
2
Designer
Establish
expected
student
outcomes
Start
Develop
preliminary
materials list.
Order
exam
copies
Select
course
materials
Determine
topic
sequence.
Develop
grading
plan
Exam
copy
order
p. 2
A
2
1
hur25338_ch06_093-111.indd 101hur25338_ch06_093-111.indd 101 20/09/11 4:01 PM20/09/11 4:01 PM
First Pages
102 Part Two Documentation Techniques
3. The document, “exam copy order,” appears only in the first column. Some flowchart
designers would also put it in the second column just to clarify what’s entering the pub-
lisher’s part of the system.
4. The file symbol indicates how the documents are filed. If they were stored in a computer
database, you would use a cylindrical symbol labeled with the name of the database.
5. Figure 6.3 (the second page of the flowchart) includes only the designer column. Because
no actions take place on that page for the publisher, you don’t need a “publisher”column
on the second page.
6. Although the designer makes several decisions along the way, only one is represented
with a decision symbol. My general guideline is to use the decision symbol when an
action has a fixed number of outcomes—usually two, but sometimes more than two.
FLOWCHARTING AND ACCOUNTING INFORMATION SYSTEMS
So how does all this material relate to your study of accounting information systems? AIS
professionals use flowcharts in many different ways, including confirming how a system is
currently operating, suggesting improvements to an accounting information system, evalu-
ating internal control deficiencies, and designing procedures manuals.
In your very first accounting job after you graduate, you’ll likely be coming into an
unfamiliar environment.You may wonder “how things work” in the accounting information
system, especially if you’re in charge of a particular function such as accounts payable or
accounts receivable. Additionally, if you’re working for a CPA firm or as a consultant, you
may need to confirm how a system is operating currently before you start an audit or make
FIGURE 6.3 Systems Flowchart of Course Design Process Page 2 of 2
Syllabus
Additional
materials
Write
syllabus
Course
number
Additional
materials
needed?
No
Yes
Choose /
create
materials
End
p. 1
A
Designer
hur25338_ch06_093-111.indd 102hur25338_ch06_093-111.indd 102 20/09/11 4:01 PM20/09/11 4:01 PM
First Pages
Chapter 6 Flowcharting 103
recommendations regarding operational efficiency. In all those cases, a flowchart can be a
useful way to conceptualize the big picture of a system. You’d probably want to look over
any existing procedures manuals and talk with employees familiar with the system already.
Then, you can try designing a flowchart to model a business process. Once you’ve com-
pleted a first draft, discuss it further with others in the organization. Explain to them what
it says and ask if that’s the way things “really work” in the company, or if you’re misunder-
standing something. Remember: The overall goal of a flowchart in this situation is to under-
stand the current state of things—the way they are, not necessarily the way they should be.
If you’re looking at a previously constructed flowchart, whether you’ve created it or not,
you can try to spot opportunities for improvement. Critically analyzing a flowchart is a
tough job—there are no hard-and-fast rules for doing it. You’ll need to draw on your train-
ing, experience, and ordinary business sense to identify and describe possible improve-
ments in an accounting information system. Once again, interviewing and other kinds of
research will help in this task. Ask employees, for example, what their biggest complaint is
about the current process. If they’ve thought about ways to improve it, listen to those as
well. You could ask employees in one-on-one or small group interviews; written surveys,
e-mail exchanges, and employee suggestion boxes also can help in gathering ideas about
process improvements. In many cases, the employees closest to a process can provide the
best suggestions for making things better; in some cases, a system outsider can provide a
new, fresh idea based on experience in other organizations. Opportunities for improve-
ments might include redesigning forms, increasing or decreasing the number of copies of a
particular form, obtaining authorizing signatures for transactions, filing in a different way
(for example, based on date rather than customer name or vice versa), or changing a form
from paper-based to electronic (or vice versa).
Flowcharts also can be used to spot internal control deficiencies in an accounting informa-
tion system. A flowchart can enhance a risk analysis by providing a concrete picture of an
accounting information system. To use a flowchart to spot internal control deficiencies, start
by making a list of the system’s risk exposures. Then, look at the flowchart with those risk
exposures in mind. Do any of the organization’s processes or documents increase its exposure
to specific risks? For example, if a company maintains only an electronic record of inventory
purchases, you’ll see that in a flowchart. In that case, the company is exposed to a systems risk.
What controls has the company implemented to reduce its exposure to systems risk? Are the
controls strong and adequate given the level of the risk? For example, does the company also
maintain a paper file that is not shown on the flowchart? Or is a paper file missing from the
flowchart because it doesn’t exist?
Finally, flowcharts can be a starting point for the development of procedures manuals. A
procedures manual is simply an “instruction book” that explains how everyday tasks in an
organization are accomplished. Halbert (2003) recommends that “every staff member . . .
document his or her duties and write a procedures manual—a time-consuming effort but
worth doing.”A well-constructed flowchart can easily be “translated” into regular, step-by-
step text for use by future employees.
CRITICAL THINKING
As you read earlier in this chapter, developing flowcharts is as much “art” as “science.”
Therefore, learning to create good, descriptive flowcharts is often a challenge for account-
ing students—knowing the rules and conventions only takes you part of the way, in just the
same way that you can’t really learn to drive a car simply by reading a book. So, for this
section, I’m going to show you how I usually go about creating a flowchart; please keep in
Systems risk relates
directly to information
technology. As organiza-
tions become
increaingly dependent
on computers and
related IT to deliver
goods and services to
customers, they risk the
possibility that IT
resources will fail at a
critical moment.
hur25338_ch06_093-111.indd 103hur25338_ch06_093-111.indd 103 20/09/11 4:01 PM20/09/11 4:01 PM
First Pages
104 Part Two Documentation Techniques
mind that the way I do it is a result of my own experience and training. It’s not the “one
right way” to develop flowcharts.
If you’ve had some intermediate accounting already, you probably know the process the
Financial Accounting Standards Board uses to develop new accounting pronouncements.
In case you haven’t studied that yet, here’s a summary (Spiceland et al., 2009, p. 14):
1. Identification of problem. A measurement or reporting issue is identified by the Emerg-
ing Issues Task Force and placed on the FASB’s agenda.
2. The task force. A task force of approximately 15 knowledgeable persons is appointed to
advise the Board on various matters.
3. Research and analysis. The FASB’s technical staff investigates the issue.
4. Discussion memorandum (DM). The DM, a detailed analysis of the problem along with
alternative solutions, is prepared and disseminated to interested parties.
5. Public response. Public hearings are held to discuss the issue and letters of response are
sent to the FASB, which then analyzes this feedback.
6. Exposure draft (ED). A preliminary draft of a proposed statement, called an exposure
draft, is issued. The ED details the proposed treatment for the problem.
7. Public response. Written responses to the ED are accepted and analyzed. The ED is
revised, if necessary, depending on the Board’s analysis.
8. Statement issued. An SFAS [Statement of Financial Accounting Standards] is issued if
four of the seven FASB members support the revised ED.
So how would you encapsulate those eight steps in a systems flowchart? First, I usually
decide how many columns the flowchart will have, keeping in mind that you need one col-
umn for each area of responsibility. In the eight-step process, the groups involved are the
Emerging Issues Task Force, the advisory task force, technical staff, the public, and the
FASB. So, the flowchart will need five columns. Next, I normally consider what each
group does and how to translate those actions into flowcharting symbols. The Emerging
Issues Task Force identifies issues; a generic process symbol could be used to represent
that. The Board does several things: appoints the advisory task force (generic process or
predetermined process symbol), prepares documents (document symbol), analyzes feed-
back (generic process), and votes (decision symbol). The advisory task force advises the
Board, while the technical staff conduct research. The process also involves several docu-
ments, each of which should be depicted with a document symbol.
Once I know how many columns and what kinds of symbols to use, it’s time to start
drawing the flowchart. I usually use graphics software like Visio or SmartDraw; you could
also start with a paper-and-pencil sketch. Keep in mind that the flowchart should have a
single “start” symbol and a single “end” symbol; it should also follow the rules and con-
ventions discussed at the beginning of this chapter. Once the first draft is done, I discuss it
with other people, make any needed changes, and then discuss it again; the flowchart is
“done” when it fairly represents the process involved.
Try drawing a flowchart of the standard-setting process
based on the preceding description. Share your work
6.4Reflection and Self-Assessment
with at least one other person—perhaps someone in
your AIS course. Then, revise the flowchart as needed.
hur25338_ch06_093-111.indd 104hur25338_ch06_093-111.indd 104 20/09/11 4:01 PM20/09/11 4:01 PM
First Pages
Chapter 6 Flowcharting 105
Here is a summary of the chapter:
1. List and discuss the purpose and use of systems flowcharts, document flowcharts, pro-
gram flowcharts, and hardware flowcharts. A systems flowchart provides a top-level
view of an information system; it shows the “big picture” of what is happening. A docu-
ment flowchart, as the name implies, shows how documents (paper and electronic) flow
through an information system, while a program flowchart details the steps in a specific
computer program. A hardware flowchart lays out the computers, printers, monitors,
and other hardware devices used in an information system.
2. Explain the basic parts of and design considerations common to all types of flowcharts.
In general, a flowchart should be read from top to bottom and left to right. Since flow-
charts are communication tools, they should be easy to read, incorporating plenty of
white space. Every flowchart should have a title to make it easier to reference after its
creation; flowcharts also should be organized into columns based on areas of responsi-
bility in the information system. Documents should have clear beginning and ending
points as well. Finally, flowcharts are usually the product of discussion among col-
leagues, rather than the product of a single individual.
3. Identify and describe common symbols and information technology tools used in flow-
charting. Figure 6.1 shows various flowcharting symbols; your individual research
(Reflection and Self-Assessment 6.3) revealed more. Two popular IT tools for flowchart
creation are SmartDraw and Visio.
4. Discuss ways flowcharts impact the design, implementation, and evaluation of account-
ing information systems. A well-constructed flowchart can give a new accountant or
consultant a quick overview of how a system works. Flowcharts also can be used as part
of the auditing process and/or to suggest process improvements in the accounting infor-
mation system, particularly when combined with a risk/control matrix. They also can
inform recommendations regarding internal controls.
5. Create and interpret systems flowcharts. Three key ideas are important in creating flow-
charts: (a) strive to achieve a clear representation of the system, not a deterministic
response to a particular problem or case situation; (b) practice will increase your skill in
flowcharting; and (c) seldom will your first creation be your final one—flowcharts can
almost always be improved via dialogue and consultation with other professionals.
Flowcharting is one commonly used documentation techniques for accounting information
systems. For accounting students, who typically like dealing with numbers better than
words and symbols, they can be challenging. But, with time, practice, and patience, you
can learn the art of developing clear, meaningful flowcharts and using them as analytical
tools in the accounting information system.
Summary
document flowcharts, 95
hardware flowcharts, 95
Microsoft Visio, 97
program flowcharts, 95
SmartDraw, 97
symbols, 97
systems flowcharts, 95
Key Terms
Egerdahl, R. 1995. “A Risk Matrix Approach to Data Processing Facility Audits.” Internal Auditor,
June, pp. 34–40.
Halbert, J. 2003. “Mining Back-Office Operations May Bolster the Bottom Line.” Los Angeles
Business Journal, April 14, www.findarticles.com (last visited November 4, 2004).
Spiceland, J. D., J. Sepe, M. W. Nelson, and L. A. Tomassini. 2000. Intermediate Accounting 5th ed.
New York: Irwin/McGraw-Hill.
Chapter
References
hur25338_ch06_093-111.indd 105hur25338_ch06_093-111.indd 105 20/09/11 4:01 PM20/09/11 4:01 PM
First Pages
106 Part Two Documentation Techniques
End-of-
Chapter
Activities
1. Reading review questions.
a. What is a flowchart? Describe four different kinds of flowcharts and explain which are most
often used in an accounting information system.
b. Summarize the rules and conventions commonly observed in the preparation of flowcharts.
c. List and explain the meaning and use of 10 common flowcharting symbols. What sources
would you consult for learning about additional symbols not on your list?
d. How are flowcharts used in working with accounting information systems?
e. Respond to the questions for this chapter’s “AIS in the Business World.”
2. Reading review problem. The Sarbanes-Oxley Act of 2002 (SOX) was a reaction to
the corporate accounting scandals of the late 20th century. In discussing some of the
positive results of SOX, Harrington stated:
Companies can find additional uses for Sarbanes-Oxley documentation as a
tool for audit committees, a way to enhance employee decisions based on cross-
function process information and a means of increasing efficiencies by eliminating
duplicate controls. Alltel Corporation (www.alltel.com) documented 100 company
processes within the scope of [SOX]. Alltel’s internal audit team reports to the
company’s audit committee. Its process documentation includes six flowcharts per
process, supported by memos and narratives. The audit committee can use this
information to support its decisions.
She concluded her article with these summary comments:
CPAs can use the documentation to provide audit committees with more detailed
information, to empower all employees to consider cross-functional processes and
to lead the entire company in using section-404-type documentation. Since there
is no way to avoid the cost, might just as well find ways to spread the expenditures
over this greater array of benefits.
So, flowcharts aren’t just something you study in AIS class. In fact, in a survey conducted
by Bradford, Richtermeyer, and Roberts, nearly half of the respondents reported using
flowcharts to document accounting information systems.
Sources: Cynthia Harrington, “The Value Proposition,” Journal of Accountancy (September 2005),
pp. 77—81; Marianne Bradford, Sandra B. Richtermeyer, and Douglas F. Roberts, “System Diagramming
Techniques: An Analysis of Methods Used in Accounting Education and Practice,” Journal of Information
Systems (Spring 2007), pp. 173–212.
a. Which type(s) of flowcharts discussed in the chapter would be relevant in this case?
Explain your response.
b. SOX imposes serious requirements regarding internal control on publicly-traded corpora-
tions. Those requirements include the CEO and CFO personally reviewing the company’s
internal control system, identifying weaknesses and known cases of fraud. Suppose you
were creating a systems flowchart depicting a typical SOX process; identify three or four
symbols you would expect to use in that flowchart, and explain how you would use them.
3. Multiple choice review questions. Please select the best answer for each question.
1. Which of the following best describes a systems flowchart?
a. Shows the flow of documents through an information system
b. Shows the logic used to create a program
c. Shows the “big picture” view
d. Shows how hardware elements are configured in a system
2. Which of the following statements about “white space” in a flowchart is most true?
a. White space prohibits the use of color in flowcharts.
b. At least 50 percent of the page should be devoted to white space.
hur25338_ch06_093-111.indd 106hur25338_ch06_093-111.indd 106 20/09/11 4:01 PM20/09/11 4:01 PM
First Pages
Chapter 6 Flowcharting 107
c. White space is unimportant in document flowcharts.
d. Adequate white space is a matter of judgment.
3. In a systems flowchart, columns denote:
a. Areas of responsibility.
b. People’s names and titles.
c. That the flowchart is unfinished.
d. A lack of adequate white space.
4. In a systems flowchart, a terminator symbol can be used to indicate: (i) the start or end of a
business process or (ii) a destination outside the system boundary.
a. i only
b. ii only
c. Both i and ii
d. Neither i nor ii
5. In creating a systems flowchart, selecting appropriate symbols comes immediately after:
a. Determining column headings.
b. Establishing the system boundary.
c. Discussing the flowchart with others.
d. Listing actions performed within each column.
4. Making choices and exercising judgment. Compare and contrast SmartDraw and Micro-
soft Visio. Prepare a paper and/or PowerPoint presentation that include a recommen-
dation regarding your preferred flowcharting software; justify your recommendation.
5. Field exercises. Visit a local restaurant for lunch or dinner. Pay close attention to the
steps involved in ordering, receiving, and paying for a meal. Create a flowchart that
depicts the process. List and discuss one or two internal controls you observe in the
process; also suggest one or two ways the system could be improved.
6. Flowchart creation. Create a flowchart based on each of the following independent
situations (one flowchart per situation).
a. Case 1. Cori’s Catering Services Cori is the owner and manager of a catering company. CCS
provides complete meals (breakfast, lunch, and dinner), as well as an assortment of hot and
cold appetizers and drinks, for groups of 12 to 500. CCS receives orders in three main ways:
e-mail, telephone, and personal office consultation. In some cases, the customer has an idea
of what he/she wants; in others, the customer relies on Cori’s expertise to select appropriate
items. For each catering job, Cori prepares an estimate for the client; she files one copy of the
estimate and sends the other to the client for approval. The client may make changes to the
estimate over the phone, via e-mail, or through a personal consultation. Once the estimate
has been finalized, Cori prepares a catering contract for the client’s signature. She requires a
50 percent deposit with the signed contract; the remaining catering fees can be paid within
30 days of the catering event. Cori accepts cash and checks; she does not accept credit cards.
The client signs the contract and sends it back to Cori. Cori also signs it, files a copy for her
own records, and sends a copy with both signatures back to the client. Cori and her staff
deliver the catering order as scheduled, and she bills the client for any remaining fees. The
client pays the invoice within 30 days and Cori deposits the funds in her bank account.
b. Case 2. University Bookstore Ordering textbooks in a university bookstore is a massive
undertaking that requires good organizational, communication, and coordination skills. The
process begins with faculty deciding which textbooks they want to use. Professors communi-
cate relevant information about the textbook (title, author, ISBN, edition, publisher, copy-
right date) to a department chair or secretary, who consolidates all the orders. That
communication may take place with a paper form or an e-mail. In either case, the departmental
representative prepares a standard university book requisition form in triplicate: one copy for
hur25338_ch06_093-111.indd 107hur25338_ch06_093-111.indd 107 20/09/11 4:01 PM20/09/11 4:01 PM
First Pages
108 Part Two Documentation Techniques
the requesting faculty member, one for the department, and one for the bookstore. The book-
store receives and consolidates requisition forms from all across the university and prepares
purchase orders for textbook publishers. Each purchase order has three copies: one for the
publisher, one for the purchasing department, and one for the accounting department. When
the publisher sends the books, the bookstore’s receiving department prepares two copies of a
receiving report; one is filed to indicate that the goods were received, while the second is
forwarded to the accounting department. The publisher sends a billing statement (invoice)
directly to the accounting department. Once all three documents have been matched and veri-
fied, the accounting department writes a check or sends an electronic funds transfer to the
publisher. The bookstore staff then sort the books based on class and stock the shelves, where
the books await purchase by students.
c. Horacio is a college student at Feng Shui University. He rents an apartment from the univer-
sity for $600 a month. On the 15th of every month, Horacio writes a check for the rent. He
mails the check to the Housing Services office on campus; in turn, Housing Services sends
an e-mail receipt back to Horacio. The mailroom staff in Housing Services makes a copy of
the check for Horacio’s file and sends the original, with all the other rent checks for the
month, to the bank. Once a month, the treasurer of Housing Services reconciles the bank
statement. Prepare a flowchart of the preceding scenario.
d. Visit the Web site of the International Accounting Standards Board. Summarize the process
the Board uses to develop International Financial Reporting Standards (IFRS), then create a
systems flowchart of the process.
7. (CMA adapted) Narrative preparation from a flowchart.
a. Consider the Richards Furniture Company flowchart presented below in Figure 6.4. Write a
narrative description of the business process it depicts.
b. Consider the PriceRight Electronics Inc. flowchart presented below in Figure 6.5. Write a
narrative description of the business process it depicts.
FIGURE 6.4 Flowchart for Richards Furniture Company
Salesperson Cashier Assistant Manager Manager
Three copies go to the
cashier; one is retained in
the sales book.
Prepare
sales
Sales invoice (4
invoice
copies)
Sales invoice (3
copies)
Cash register
Tape
1
Assign
Approve
sale and
process
Validated invoice,
check or cash,
return slip
Reconcile
Reconciled
report
and prepare
Prepare
bank
deposit
Deposit
documents To bank
bank
Review
Date
deposit
report
1
consecutive
number
One copy of the validated
invoice goes to the
customer; one stays in the
store, and the third goes to the
assistant manager.
hur25338_ch06_093-111.indd 108hur25338_ch06_093-111.indd 108 20/09/11 4:01 PM20/09/11 4:01 PM
First Pages
Chapter 6 Flowcharting 109
8. Flowchart and system critiques.
a. Consider the Richards Furniture Company flowchart again. Describe at least two strengths
and at least two weaknesses of the flowchart itself. Then, identify and describe at least two
strengths and at least two weaknesses of the process it depicts. For each process weakness,
suggest a way to correct it.
b. Consider the PriceRight Electronics Inc. flowchart again. Describe at least two strengths
and at least two weaknesses of the flowchart itself. Then, identify and describe at least two
strengths and at least two weaknesses of the process it depicts. For each process weakness,
suggest a way to correct it.
9. Terminology. Please match each item on the left with the best item on the right.
1. Areas of responsibility
2. Document flowchart
3. Hardware flowchart
4. Inverted triangle
5. Origin and termination
6. Overlapping shapes
7. Program flowchart
8. Spotting internal control
deficiencies
9. Systems flowchart
10. Title
a. A flowchart depicting the process of buying a car.
b. Based on lines of computer code.
c. Can trace remittance advices and invoices
through a system.
d. Documents in a flowchart should have these.
e. Every flowchart should have one of these.
f. One application of flowcharting in AIS.
g. Represents a file in a flowchart.
h. Shows monitors, input devices, and computers.
i. Used to show multiple copies of a document.
j. What columns represent in a flowchart.
FIGURE 6.5 Flowchart for PriceRight Electronics Inc.
Customer Marketing Credit Warehouse Shipping and Receiving
Customer
order Sales order
New
customer
credit
check
Sales order
(to shipping
and receiving)
Maintain
inventory
master file
Stock
status
report
Sales order
system
Sales order
(to customer)
Compare for
material
availability
Assemble
order
Update
inventory
master file
Accept and
inspect
material
Master file
of customer
credit limits
Pack and
ship
order
Sales order/
packing slip
(to customer)
hur25338_ch06_093-111.indd 109hur25338_ch06_093-111.indd 109 20/09/11 4:01 PM20/09/11 4:01 PM
First Pages
110 Part Two Documentation Techniques
10. Multiple choice questions.
Consider the following narrative as you respond to these questions:
When staff at IGV Corporation need to travel on company business, they first submit a
travel request to their immediate supervisor. The travel request includes the employee’s
identifying information; dates, location, and purpose of the trip; and a budget. The
supervisor compares the travel budget to the department’s total travel budget; if
sufficient funds are available, the supervisor evaluates the need for the trip by
comparing it to the department’s strategic plan. If the trip is approved, the supervisor
submits the budget to the cash expenditures department, where a staff member issues a
travel advance to the employee. After the trip, the employee submits receipts and either
pays back any excess advance funds or receives additional reimbursement for expenses
incurred. If insufficient funds are available or if the trip does not support the strategic
plan, the request is filed by employee name.
In each question, assume you are creating a systems flowchart of the narrative.
1. All of the following would be column headings except:
a. Cash expenditures department.
b. Department strategic plan.
c. Staff member.
d. Supervisor.
2. Which of the following actions would require the use of this symbol?
a. Compare travel budget to total budget
b. File request
c. Issue travel advance
d. Prepare budget
3. Which of the following actions would require the use of this symbol?
a. Compare travel budget to total budget
b. File request
c. Issue travel advance
d. Prepare budget
4. Which of the following is most likely to fall outside the system boundary?
a. Supervisor
b. Receipts
c. Conference hotel
d. Additional reimbursement
hur25338_ch06_093-111.indd 110hur25338_ch06_093-111.indd 110 20/09/11 4:01 PM20/09/11 4:01 PM
First Pages
Chapter 6 Flowcharting 111
5. Which of the following actions is most likely to be depicted with this symbol?
a. Evaluate the need for the trip
b. File receipts
c. Prepare strategic plan
d. Issue travel advance
11. Statement evaluation. Indicate whether each statement below is (i) always true,
(ii) sometimes true, or (iii) never true. For those that are (ii) sometimes true, explain
when the statement is true.
a. Columns in a systems flowchart denote areas of responsibility.
b. Flowcharts are focused on business documents.
c. Flowcharts should include off-page connectors for easier reading.
d. Monthly bank reconciliations ensure that no one embezzles cash.
e. Once designed, flowcharts do not need to be revised.
f. On-page connectors help keep flowcharts uncluttered and easy to read.
g. Process symbols should be sandwiched between an input and an output.
h. The first step in drawing a flowchart is to decide which software package to use.
i. Two designers would independently create identical flowcharts for the same business process.
j. Visio is the best tool for drawing flowcharts.
hur25338_ch06_093-111.indd 111hur25338_ch06_093-111.indd 111 20/09/11 4:01 PM20/09/11 4:01 PM

More Related Content

What's hot

Oracle Fusion Applications Accounts Payables
Oracle Fusion Applications Accounts PayablesOracle Fusion Applications Accounts Payables
Oracle Fusion Applications Accounts PayablesBerry Clemens
 
Financial Accounting ICAB chapter 1 Conceptual and regulatory framework
Financial Accounting ICAB chapter 1 Conceptual and regulatory frameworkFinancial Accounting ICAB chapter 1 Conceptual and regulatory framework
Financial Accounting ICAB chapter 1 Conceptual and regulatory frameworkSazzad Hossain, ITP, MBA, CSCA™
 
Shipping execution user guide r12
Shipping execution user guide r12Shipping execution user guide r12
Shipping execution user guide r12aruna777
 
Oracle Applications - Sales Order Entering,Booking,Picking And Shipping Made ...
Oracle Applications - Sales Order Entering,Booking,Picking And Shipping Made ...Oracle Applications - Sales Order Entering,Booking,Picking And Shipping Made ...
Oracle Applications - Sales Order Entering,Booking,Picking And Shipping Made ...Bala Murugan
 
Understanding oracle fusion accounting hub
Understanding oracle fusion accounting hubUnderstanding oracle fusion accounting hub
Understanding oracle fusion accounting hubManoj Sharma
 
Cloudy with a chance of 1099
Cloudy with a chance of 1099Cloudy with a chance of 1099
Cloudy with a chance of 1099Mahesh Vallampati
 
Chapter 01 INTRODUCTION TO COMPUTER BASED ACCOUNTING
Chapter 01 INTRODUCTION TO COMPUTER BASED ACCOUNTINGChapter 01 INTRODUCTION TO COMPUTER BASED ACCOUNTING
Chapter 01 INTRODUCTION TO COMPUTER BASED ACCOUNTINGayanthimadhumali
 
Financial accounting icab chapter 2 format of financial statements
Financial accounting icab chapter 2 format of financial statementsFinancial accounting icab chapter 2 format of financial statements
Financial accounting icab chapter 2 format of financial statementsSazzad Hossain, ITP, MBA, CSCA™
 
Using backlog-management
Using backlog-managementUsing backlog-management
Using backlog-managementrani0028
 
Oracle fusion cloud financial : How to create Journal , Manual Vs Spreadsheet?
Oracle fusion cloud financial : How to create Journal , Manual Vs Spreadsheet?Oracle fusion cloud financial : How to create Journal , Manual Vs Spreadsheet?
Oracle fusion cloud financial : How to create Journal , Manual Vs Spreadsheet?Pranav Pandya
 
SA 700, SA 705 and SA 706
SA 700, SA 705 and SA 706SA 700, SA 705 and SA 706
SA 700, SA 705 and SA 706Gaurav Sehgal
 
Oracle Revenue Management Cloud Service
Oracle Revenue Management Cloud ServiceOracle Revenue Management Cloud Service
Oracle Revenue Management Cloud Servicemykalz71
 
Lecture 18 revenue cycle - accounting information systesm james a. hall boo...
Lecture 18  revenue cycle - accounting information systesm  james a. hall boo...Lecture 18  revenue cycle - accounting information systesm  james a. hall boo...
Lecture 18 revenue cycle - accounting information systesm james a. hall boo...Habib Ullah Qamar
 
Fusion Cash Management - Bank Account Reconciliation.pptx
Fusion Cash Management - Bank Account Reconciliation.pptxFusion Cash Management - Bank Account Reconciliation.pptx
Fusion Cash Management - Bank Account Reconciliation.pptxVatsalaC1
 
Auditing and Assurance Services an Integrated Approach 15th Edition Arens Sol...
Auditing and Assurance Services an Integrated Approach 15th Edition Arens Sol...Auditing and Assurance Services an Integrated Approach 15th Edition Arens Sol...
Auditing and Assurance Services an Integrated Approach 15th Edition Arens Sol...nofygisu
 
Check printingxmlp r12
Check printingxmlp r12Check printingxmlp r12
Check printingxmlp r12Venkatesh Tati
 

What's hot (20)

Oracle Fusion Applications Accounts Payables
Oracle Fusion Applications Accounts PayablesOracle Fusion Applications Accounts Payables
Oracle Fusion Applications Accounts Payables
 
Financial Accounting ICAB chapter 1 Conceptual and regulatory framework
Financial Accounting ICAB chapter 1 Conceptual and regulatory frameworkFinancial Accounting ICAB chapter 1 Conceptual and regulatory framework
Financial Accounting ICAB chapter 1 Conceptual and regulatory framework
 
Shipping execution user guide r12
Shipping execution user guide r12Shipping execution user guide r12
Shipping execution user guide r12
 
Oracle Applications - Sales Order Entering,Booking,Picking And Shipping Made ...
Oracle Applications - Sales Order Entering,Booking,Picking And Shipping Made ...Oracle Applications - Sales Order Entering,Booking,Picking And Shipping Made ...
Oracle Applications - Sales Order Entering,Booking,Picking And Shipping Made ...
 
Understanding oracle fusion accounting hub
Understanding oracle fusion accounting hubUnderstanding oracle fusion accounting hub
Understanding oracle fusion accounting hub
 
Cloudy with a chance of 1099
Cloudy with a chance of 1099Cloudy with a chance of 1099
Cloudy with a chance of 1099
 
Fusion Accounting Hub
Fusion Accounting HubFusion Accounting Hub
Fusion Accounting Hub
 
Pp 02-new
Pp 02-newPp 02-new
Pp 02-new
 
Chapter 01 INTRODUCTION TO COMPUTER BASED ACCOUNTING
Chapter 01 INTRODUCTION TO COMPUTER BASED ACCOUNTINGChapter 01 INTRODUCTION TO COMPUTER BASED ACCOUNTING
Chapter 01 INTRODUCTION TO COMPUTER BASED ACCOUNTING
 
Financial accounting icab chapter 2 format of financial statements
Financial accounting icab chapter 2 format of financial statementsFinancial accounting icab chapter 2 format of financial statements
Financial accounting icab chapter 2 format of financial statements
 
Using backlog-management
Using backlog-managementUsing backlog-management
Using backlog-management
 
Oracle fusion cloud financial : How to create Journal , Manual Vs Spreadsheet?
Oracle fusion cloud financial : How to create Journal , Manual Vs Spreadsheet?Oracle fusion cloud financial : How to create Journal , Manual Vs Spreadsheet?
Oracle fusion cloud financial : How to create Journal , Manual Vs Spreadsheet?
 
James hall ch 7
James hall ch 7James hall ch 7
James hall ch 7
 
SA 700, SA 705 and SA 706
SA 700, SA 705 and SA 706SA 700, SA 705 and SA 706
SA 700, SA 705 and SA 706
 
Oracle Revenue Management Cloud Service
Oracle Revenue Management Cloud ServiceOracle Revenue Management Cloud Service
Oracle Revenue Management Cloud Service
 
Lecture 18 revenue cycle - accounting information systesm james a. hall boo...
Lecture 18  revenue cycle - accounting information systesm  james a. hall boo...Lecture 18  revenue cycle - accounting information systesm  james a. hall boo...
Lecture 18 revenue cycle - accounting information systesm james a. hall boo...
 
Fusion Cash Management - Bank Account Reconciliation.pptx
Fusion Cash Management - Bank Account Reconciliation.pptxFusion Cash Management - Bank Account Reconciliation.pptx
Fusion Cash Management - Bank Account Reconciliation.pptx
 
transaction processing system
transaction processing systemtransaction processing system
transaction processing system
 
Auditing and Assurance Services an Integrated Approach 15th Edition Arens Sol...
Auditing and Assurance Services an Integrated Approach 15th Edition Arens Sol...Auditing and Assurance Services an Integrated Approach 15th Edition Arens Sol...
Auditing and Assurance Services an Integrated Approach 15th Edition Arens Sol...
 
Check printingxmlp r12
Check printingxmlp r12Check printingxmlp r12
Check printingxmlp r12
 

Similar to Customer Billing Process Flowchart

What is the relationship between Accounting and an Accounting inform.pdf
What is the relationship between Accounting and an Accounting inform.pdfWhat is the relationship between Accounting and an Accounting inform.pdf
What is the relationship between Accounting and an Accounting inform.pdfannikasarees
 
Chapter 4 computer enabled project topic.pptx To familiarise Computer applica...
Chapter 4 computer enabled project topic.pptx To familiarise Computer applica...Chapter 4 computer enabled project topic.pptx To familiarise Computer applica...
Chapter 4 computer enabled project topic.pptx To familiarise Computer applica...anamikaghosh21
 
How To Elminate Errors and Increase Efficiency
How To Elminate Errors and Increase EfficiencyHow To Elminate Errors and Increase Efficiency
How To Elminate Errors and Increase EfficiencySmartDraw Software
 
How to Choose a Legal Document Automation Solution
How to Choose a Legal Document Automation SolutionHow to Choose a Legal Document Automation Solution
How to Choose a Legal Document Automation SolutionHelen Coyne
 
What every managemenet accountants should know about the cloud by l iv watson
What every managemenet accountants should know about the cloud by l iv watsonWhat every managemenet accountants should know about the cloud by l iv watson
What every managemenet accountants should know about the cloud by l iv watsonWorkiva
 
Scheduling Survival Guide
Scheduling Survival Guide Scheduling Survival Guide
Scheduling Survival Guide HelpSystems
 
Cryptography is the application of algorithms to ensure the confiden.docx
Cryptography is the application of algorithms to ensure the confiden.docxCryptography is the application of algorithms to ensure the confiden.docx
Cryptography is the application of algorithms to ensure the confiden.docxmydrynan
 
Blue Prism_White Paper_ Technical Kickstarter
Blue Prism_White Paper_ Technical KickstarterBlue Prism_White Paper_ Technical Kickstarter
Blue Prism_White Paper_ Technical KickstarterKeith Bowman
 
Sixfoot4 business architecture
Sixfoot4 business architectureSixfoot4 business architecture
Sixfoot4 business architectureGarth Holloway
 
Intelligent Process Management
Intelligent Process ManagementIntelligent Process Management
Intelligent Process ManagementDafna Levy
 
BPM - The Promise And Challenges
BPM  - The Promise And ChallengesBPM  - The Promise And Challenges
BPM - The Promise And ChallengesJerald Burget
 
Six sigma fast track course
Six sigma fast track courseSix sigma fast track course
Six sigma fast track courseMuhammad Asim
 
5 Best Workflow Tools to Master Productivity in 2023
5 Best Workflow Tools to Master Productivity in 20235 Best Workflow Tools to Master Productivity in 2023
5 Best Workflow Tools to Master Productivity in 2023Kashish Trivedi
 

Similar to Customer Billing Process Flowchart (20)

What is the relationship between Accounting and an Accounting inform.pdf
What is the relationship between Accounting and an Accounting inform.pdfWhat is the relationship between Accounting and an Accounting inform.pdf
What is the relationship between Accounting and an Accounting inform.pdf
 
Game-Changing Document Management Strategies
Game-Changing Document Management StrategiesGame-Changing Document Management Strategies
Game-Changing Document Management Strategies
 
Chapter 4 computer enabled project topic.pptx To familiarise Computer applica...
Chapter 4 computer enabled project topic.pptx To familiarise Computer applica...Chapter 4 computer enabled project topic.pptx To familiarise Computer applica...
Chapter 4 computer enabled project topic.pptx To familiarise Computer applica...
 
How To Elminate Errors and Increase Efficiency
How To Elminate Errors and Increase EfficiencyHow To Elminate Errors and Increase Efficiency
How To Elminate Errors and Increase Efficiency
 
How to Choose a Legal Document Automation Solution
How to Choose a Legal Document Automation SolutionHow to Choose a Legal Document Automation Solution
How to Choose a Legal Document Automation Solution
 
What every managemenet accountants should know about the cloud by l iv watson
What every managemenet accountants should know about the cloud by l iv watsonWhat every managemenet accountants should know about the cloud by l iv watson
What every managemenet accountants should know about the cloud by l iv watson
 
Acc 340 Preview Full Course
Acc 340 Preview Full Course Acc 340 Preview Full Course
Acc 340 Preview Full Course
 
Acc 340 Preview Full Course
Acc 340 Preview Full CourseAcc 340 Preview Full Course
Acc 340 Preview Full Course
 
Scheduling Survival Guide
Scheduling Survival Guide Scheduling Survival Guide
Scheduling Survival Guide
 
Dit yvol5iss41
Dit yvol5iss41Dit yvol5iss41
Dit yvol5iss41
 
Cryptography is the application of algorithms to ensure the confiden.docx
Cryptography is the application of algorithms to ensure the confiden.docxCryptography is the application of algorithms to ensure the confiden.docx
Cryptography is the application of algorithms to ensure the confiden.docx
 
How To Plan a Software Project
How To Plan a Software ProjectHow To Plan a Software Project
How To Plan a Software Project
 
Flow-ABriefExplanation
Flow-ABriefExplanationFlow-ABriefExplanation
Flow-ABriefExplanation
 
Blue Prism_White Paper_ Technical Kickstarter
Blue Prism_White Paper_ Technical KickstarterBlue Prism_White Paper_ Technical Kickstarter
Blue Prism_White Paper_ Technical Kickstarter
 
2 flow charts
2 flow charts2 flow charts
2 flow charts
 
Sixfoot4 business architecture
Sixfoot4 business architectureSixfoot4 business architecture
Sixfoot4 business architecture
 
Intelligent Process Management
Intelligent Process ManagementIntelligent Process Management
Intelligent Process Management
 
BPM - The Promise And Challenges
BPM  - The Promise And ChallengesBPM  - The Promise And Challenges
BPM - The Promise And Challenges
 
Six sigma fast track course
Six sigma fast track courseSix sigma fast track course
Six sigma fast track course
 
5 Best Workflow Tools to Master Productivity in 2023
5 Best Workflow Tools to Master Productivity in 20235 Best Workflow Tools to Master Productivity in 2023
5 Best Workflow Tools to Master Productivity in 2023
 

Recently uploaded

Organic Name Reactions for the students and aspirants of Chemistry12th.pptx
Organic Name Reactions  for the students and aspirants of Chemistry12th.pptxOrganic Name Reactions  for the students and aspirants of Chemistry12th.pptx
Organic Name Reactions for the students and aspirants of Chemistry12th.pptxVS Mahajan Coaching Centre
 
ECONOMIC CONTEXT - PAPER 1 Q3: NEWSPAPERS.pptx
ECONOMIC CONTEXT - PAPER 1 Q3: NEWSPAPERS.pptxECONOMIC CONTEXT - PAPER 1 Q3: NEWSPAPERS.pptx
ECONOMIC CONTEXT - PAPER 1 Q3: NEWSPAPERS.pptxiammrhaywood
 
Types of Journalistic Writing Grade 8.pptx
Types of Journalistic Writing Grade 8.pptxTypes of Journalistic Writing Grade 8.pptx
Types of Journalistic Writing Grade 8.pptxEyham Joco
 
How to Configure Email Server in Odoo 17
How to Configure Email Server in Odoo 17How to Configure Email Server in Odoo 17
How to Configure Email Server in Odoo 17Celine George
 
Pharmacognosy Flower 3. Compositae 2023.pdf
Pharmacognosy Flower 3. Compositae 2023.pdfPharmacognosy Flower 3. Compositae 2023.pdf
Pharmacognosy Flower 3. Compositae 2023.pdfMahmoud M. Sallam
 
POINT- BIOCHEMISTRY SEM 2 ENZYMES UNIT 5.pptx
POINT- BIOCHEMISTRY SEM 2 ENZYMES UNIT 5.pptxPOINT- BIOCHEMISTRY SEM 2 ENZYMES UNIT 5.pptx
POINT- BIOCHEMISTRY SEM 2 ENZYMES UNIT 5.pptxSayali Powar
 
Hierarchy of management that covers different levels of management
Hierarchy of management that covers different levels of managementHierarchy of management that covers different levels of management
Hierarchy of management that covers different levels of managementmkooblal
 
Interactive Powerpoint_How to Master effective communication
Interactive Powerpoint_How to Master effective communicationInteractive Powerpoint_How to Master effective communication
Interactive Powerpoint_How to Master effective communicationnomboosow
 
Final demo Grade 9 for demo Plan dessert.pptx
Final demo Grade 9 for demo Plan dessert.pptxFinal demo Grade 9 for demo Plan dessert.pptx
Final demo Grade 9 for demo Plan dessert.pptxAvyJaneVismanos
 
Computed Fields and api Depends in the Odoo 17
Computed Fields and api Depends in the Odoo 17Computed Fields and api Depends in the Odoo 17
Computed Fields and api Depends in the Odoo 17Celine George
 
Capitol Tech U Doctoral Presentation - April 2024.pptx
Capitol Tech U Doctoral Presentation - April 2024.pptxCapitol Tech U Doctoral Presentation - April 2024.pptx
Capitol Tech U Doctoral Presentation - April 2024.pptxCapitolTechU
 
MARGINALIZATION (Different learners in Marginalized Group
MARGINALIZATION (Different learners in Marginalized GroupMARGINALIZATION (Different learners in Marginalized Group
MARGINALIZATION (Different learners in Marginalized GroupJonathanParaisoCruz
 
Solving Puzzles Benefits Everyone (English).pptx
Solving Puzzles Benefits Everyone (English).pptxSolving Puzzles Benefits Everyone (English).pptx
Solving Puzzles Benefits Everyone (English).pptxOH TEIK BIN
 
Enzyme, Pharmaceutical Aids, Miscellaneous Last Part of Chapter no 5th.pdf
Enzyme, Pharmaceutical Aids, Miscellaneous Last Part of Chapter no 5th.pdfEnzyme, Pharmaceutical Aids, Miscellaneous Last Part of Chapter no 5th.pdf
Enzyme, Pharmaceutical Aids, Miscellaneous Last Part of Chapter no 5th.pdfSumit Tiwari
 
How to Make a Pirate ship Primary Education.pptx
How to Make a Pirate ship Primary Education.pptxHow to Make a Pirate ship Primary Education.pptx
How to Make a Pirate ship Primary Education.pptxmanuelaromero2013
 
call girls in Kamla Market (DELHI) 🔝 >༒9953330565🔝 genuine Escort Service 🔝✔️✔️
call girls in Kamla Market (DELHI) 🔝 >༒9953330565🔝 genuine Escort Service 🔝✔️✔️call girls in Kamla Market (DELHI) 🔝 >༒9953330565🔝 genuine Escort Service 🔝✔️✔️
call girls in Kamla Market (DELHI) 🔝 >༒9953330565🔝 genuine Escort Service 🔝✔️✔️9953056974 Low Rate Call Girls In Saket, Delhi NCR
 

Recently uploaded (20)

Organic Name Reactions for the students and aspirants of Chemistry12th.pptx
Organic Name Reactions  for the students and aspirants of Chemistry12th.pptxOrganic Name Reactions  for the students and aspirants of Chemistry12th.pptx
Organic Name Reactions for the students and aspirants of Chemistry12th.pptx
 
ECONOMIC CONTEXT - PAPER 1 Q3: NEWSPAPERS.pptx
ECONOMIC CONTEXT - PAPER 1 Q3: NEWSPAPERS.pptxECONOMIC CONTEXT - PAPER 1 Q3: NEWSPAPERS.pptx
ECONOMIC CONTEXT - PAPER 1 Q3: NEWSPAPERS.pptx
 
Types of Journalistic Writing Grade 8.pptx
Types of Journalistic Writing Grade 8.pptxTypes of Journalistic Writing Grade 8.pptx
Types of Journalistic Writing Grade 8.pptx
 
How to Configure Email Server in Odoo 17
How to Configure Email Server in Odoo 17How to Configure Email Server in Odoo 17
How to Configure Email Server in Odoo 17
 
Pharmacognosy Flower 3. Compositae 2023.pdf
Pharmacognosy Flower 3. Compositae 2023.pdfPharmacognosy Flower 3. Compositae 2023.pdf
Pharmacognosy Flower 3. Compositae 2023.pdf
 
POINT- BIOCHEMISTRY SEM 2 ENZYMES UNIT 5.pptx
POINT- BIOCHEMISTRY SEM 2 ENZYMES UNIT 5.pptxPOINT- BIOCHEMISTRY SEM 2 ENZYMES UNIT 5.pptx
POINT- BIOCHEMISTRY SEM 2 ENZYMES UNIT 5.pptx
 
Hierarchy of management that covers different levels of management
Hierarchy of management that covers different levels of managementHierarchy of management that covers different levels of management
Hierarchy of management that covers different levels of management
 
Interactive Powerpoint_How to Master effective communication
Interactive Powerpoint_How to Master effective communicationInteractive Powerpoint_How to Master effective communication
Interactive Powerpoint_How to Master effective communication
 
TataKelola dan KamSiber Kecerdasan Buatan v022.pdf
TataKelola dan KamSiber Kecerdasan Buatan v022.pdfTataKelola dan KamSiber Kecerdasan Buatan v022.pdf
TataKelola dan KamSiber Kecerdasan Buatan v022.pdf
 
9953330565 Low Rate Call Girls In Rohini Delhi NCR
9953330565 Low Rate Call Girls In Rohini  Delhi NCR9953330565 Low Rate Call Girls In Rohini  Delhi NCR
9953330565 Low Rate Call Girls In Rohini Delhi NCR
 
Final demo Grade 9 for demo Plan dessert.pptx
Final demo Grade 9 for demo Plan dessert.pptxFinal demo Grade 9 for demo Plan dessert.pptx
Final demo Grade 9 for demo Plan dessert.pptx
 
Computed Fields and api Depends in the Odoo 17
Computed Fields and api Depends in the Odoo 17Computed Fields and api Depends in the Odoo 17
Computed Fields and api Depends in the Odoo 17
 
Model Call Girl in Tilak Nagar Delhi reach out to us at 🔝9953056974🔝
Model Call Girl in Tilak Nagar Delhi reach out to us at 🔝9953056974🔝Model Call Girl in Tilak Nagar Delhi reach out to us at 🔝9953056974🔝
Model Call Girl in Tilak Nagar Delhi reach out to us at 🔝9953056974🔝
 
Capitol Tech U Doctoral Presentation - April 2024.pptx
Capitol Tech U Doctoral Presentation - April 2024.pptxCapitol Tech U Doctoral Presentation - April 2024.pptx
Capitol Tech U Doctoral Presentation - April 2024.pptx
 
OS-operating systems- ch04 (Threads) ...
OS-operating systems- ch04 (Threads) ...OS-operating systems- ch04 (Threads) ...
OS-operating systems- ch04 (Threads) ...
 
MARGINALIZATION (Different learners in Marginalized Group
MARGINALIZATION (Different learners in Marginalized GroupMARGINALIZATION (Different learners in Marginalized Group
MARGINALIZATION (Different learners in Marginalized Group
 
Solving Puzzles Benefits Everyone (English).pptx
Solving Puzzles Benefits Everyone (English).pptxSolving Puzzles Benefits Everyone (English).pptx
Solving Puzzles Benefits Everyone (English).pptx
 
Enzyme, Pharmaceutical Aids, Miscellaneous Last Part of Chapter no 5th.pdf
Enzyme, Pharmaceutical Aids, Miscellaneous Last Part of Chapter no 5th.pdfEnzyme, Pharmaceutical Aids, Miscellaneous Last Part of Chapter no 5th.pdf
Enzyme, Pharmaceutical Aids, Miscellaneous Last Part of Chapter no 5th.pdf
 
How to Make a Pirate ship Primary Education.pptx
How to Make a Pirate ship Primary Education.pptxHow to Make a Pirate ship Primary Education.pptx
How to Make a Pirate ship Primary Education.pptx
 
call girls in Kamla Market (DELHI) 🔝 >༒9953330565🔝 genuine Escort Service 🔝✔️✔️
call girls in Kamla Market (DELHI) 🔝 >༒9953330565🔝 genuine Escort Service 🔝✔️✔️call girls in Kamla Market (DELHI) 🔝 >༒9953330565🔝 genuine Escort Service 🔝✔️✔️
call girls in Kamla Market (DELHI) 🔝 >༒9953330565🔝 genuine Escort Service 🔝✔️✔️
 

Customer Billing Process Flowchart

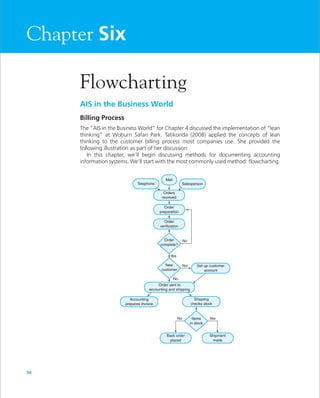
  • 1. First Pages 94 Chapter Six Mail Telephone Salesperson Order complete? New customer No No Set up customer account Accounting prepares invoice Shipping checks stock Order preparation Orders received Order verification Back order placed Shipment made No YesItems in stock Order sent to accounting and shipping Yes Yes Flowcharting AIS in the Business World Billing Process The “AIS in the Business World” for Chapter 4 discussed the implementation of “lean thinking” at Woburn Safari Park. Tatikonda (2008) applied the concepts of lean thinking to the customer billing process most companies use. She provided the following illustration as part of her discussion: In this chapter, we’ll begin discussing methods for documenting accounting information systems. We’ll start with the most commonly used method: flowcharting. hur25338_ch06_093-111.indd 94hur25338_ch06_093-111.indd 94 20/09/11 4:01 PM20/09/11 4:01 PM
  • 2. First Pages Chapter 6 Flowcharting 95 Discussion Questions 1. How are flowcharts used in accounting information systems? 2. What are the strengths and weaknesses of Tatikonda’s flowchart? Source: L. Tatikonda, “A Less Costly Billing Process,” Quality Progress, January 2008. In practice, you may often be called upon to evaluate a system’s risk exposures; recom- mend ways to achieve stronger internal control; and/or suggest one or more ways to make a system more efficient and effective. In those situations, you’ll want a way to encapsulate the essential features of an accounting information system: its documents, personnel involved, information flows, and related technologies. When you complete your study of this chapter, you should be able to: 1. List and discuss the purpose and use of systems flowcharts, document flowcharts, pro- gram flowcharts, and hardware flowcharts. 2. Explain the basic parts of and design considerations common to all types of flowcharts. 3. Identify and describe common symbols and information technology tools used in flowcharting. 4. Discuss ways flowcharts impact the design, implementation, and evaluation of account- ing information systems. 5. Create and interpret systems flowcharts. A good flowchart is like a snapshot of an information system. It can tell you, at a glance, where information originates, who handles the information, and how it is summarized for decision making. Like most of the rest of AIS, flowcharting is at least as much art as sci- ence. The keys are to make your flowcharts as easy to read and as understandable as pos- sible and to develop them in sufficient detail to provide an accurate picture of what’s going on in an accounting information system. FLOWCHART TYPES AND CONVENTIONS Basically, a flowchart is a graphical representation of some part of an information system. The information system might be focused on accounting, production, human resources, or marketing; it might be related to a particular project such as launching the space shuttle or evaluating employee performance. Flowcharts have been used by information technology professionals for years to document computer programs; they also can be used to depict the hardware associated with a computer information system. Flowcharts often are classified by their overall purpose and function: • Systems flowcharts give the user a “big picture” look at an information system. Con- sider, for example, the process you use to register for classes each term. You use certain documents and types of information technology to select and register for classes; a systems flowchart would combine all of those resources with their related business processes. • Program flowcharts show the logic associated with a computer program. As an accountant, you probably won’t have much to do with program flowcharts. I am indebted to my colleague, Dr. Kathy Hurtt of Baylor Univer- sity, for focusing my thinking and providing valuable insights in the revision of this chapter. (And no, she’s not related to me.) hur25338_ch06_093-111.indd 95hur25338_ch06_093-111.indd 95 20/09/11 4:01 PM20/09/11 4:01 PM
  • 3. First Pages 96 Part Two Documentation Techniques • Document flowcharts, as you might expect, show the various documents involved in a system; they also portray the procedures performed on those documents. So, for example, a document flowchart might show your federal income tax return from the time you receive a blank form through its eventual disposition with the Internal Reve- nue Service. • Hardware flowcharts will probably be a minor concern in your accounting career as well. They show the computers, printers, monitors, input devices, and other hardware elements associated with an information system. Although two different people can look at the same business process and draw flowcharts that are significantly different, they should generally observe some very common conven- tions (habits) associated with good flowcharting: 1. Flowcharts should be read from top to bottom and left to right—the same way you read a page in a book. Flowcharting, though, is a highly iterative process, meaning that most folks don’t “get it right” the very first time. So, the design may not proceed in such a neat and orderly fashion. But, when the final flowchart is produced, users should be able to follow it easily. 2. Flowcharts should have plenty of “white space.” In other words, they shouldn’t be too crowded on the page. If you’re like most accounting students, you’re thinking, “How do I know if it’s too crowded? Is there a rule?”Well, no. Generally, if you think a flowchart looks too crowded, it probably is. In that case, it needs to be broken up into more than one page for easier reading. 3. Flowcharts should have a title. A bunch of symbols on a page can be confusing to read and evaluate if you don’t know what they’re trying to present. So, it’s a good idea to title your flowchart based on what it represents; for example, “Systems flowchart of the employee evaluation process.” The title should also include the name of the company, the date the flowchart was prepared, and the preparer’s name. If the flowchart spans multiple pages, they should be numbered as “1 of x, 2 of x,” and so on. 4. Flowcharts should be organized in columns that depict areas of responsibility. For example, purchasing inventory in most organizations involves departmental manag- ers, purchasing agents, and vendors. So, a systems flowchart that shows the purchas- ing process would typically have three columns—one for each area of responsibility. Areas of responsibility will most commonly be the names of departments/functions/ job titles within the organization; we don’t typically use a person’s name as a column heading. 6.1Reflection and Self-Assessment 4. Path of a sales invoice through an information system. 5. Origination, processing, and termination of a pay- roll check. 6. Local area network configuration. 7. Employee evaluation process. What type of flowchart would be most appropriate in each of the following situations? 1. Steps in a Visual Basic program for producing finan- cial statements. 2. Steps associated with purchasing inventory. 3. Relationships between a central server and desktop computers. hur25338_ch06_093-111.indd 96hur25338_ch06_093-111.indd 96 20/09/11 4:01 PM20/09/11 4:01 PM
  • 4. First Pages Chapter 6 Flowcharting 97 5. Documents involved in a business process should have a clear origin and a clear termi- nation. They shouldn’t appear “by magic” in the middle of a flowchart, nor should they disappear from the system. A “clear origin” means the document first appears in the column where it enters the system. Documents typically originate in one of two ways: (a) they enter the system from some external entity, or (b) they are created by some process within the system. 6. Rough drafts of flowcharts should be discussed by people involved in the process. Such discussions serve as a “reality check.”They also help ensure that the flowchart is easily understood by someone other than the designer. Adhering to those six conventions will make your flowcharts a lot easier to read and under- stand; they’ll also be considerably more useful in the design, evaluation, and implementa- tion of accounting information systems. FLOWCHARTING TOOLS AND SYMBOLS Flowcharts can be designed using a variety of tools, both high-tech and low-tech. On the low-tech end, you can draw a flowchart with paper and pencil. You also can use a flowcharting template, which includes many common flowcharting symbols. While manual methods are useful for “quick and dirty” starts at a flowchart, they can become tedious and messy over time. Fortunately, numerous software programs facilitate the preparation of good flowcharts. Two programs I’ve found useful are Microsoft Visio and SmartDraw. Visio is part of the Microsoft Office Suite, so it interfaces fairly well with other programs such as Word, PowerPoint, and Excel. SmartDraw is an independent software program, but it also does a good job with designing all kinds of flowcharts; generally, they also can be read by Office software. Of course, you can use just about any software package that has some graphics capability to design a flowchart—even something as simple as PowerPoint! The advantage of using a program specifically designed for flowcharting, like SmartDraw or Visio, is its adherence to the flowcharting conventions discussed earlier. Additionally, flowcharting programs typically have a wider variety of flowcharting symbols in their libraries than other programs designed for different purposes. You can find more information about Visio at http://support .microsoft.com/ph/2529. Check out SmartDraw on its Web page: www .smartdraw.com. It comes with a free trial that you might find use- ful for your AIS course. Point your Web browser to www.download.com. Search for flowcharting programs. Identify and describe two other programs you could use to create flowcharts. 6.2Reflection and Self-Assessment Because flowcharts represent a kind of “universal language” in information systems design, implementation, and evaluation, they have some common symbols with specific meanings. According to the American National Standards Institute (ANSI), flowchart sym- bols can be divided into four groups: data, process, line, and special. Consider the symbols shown in Figure 6.1, which are just a small subset of the many symbols associated with flowcharting. Now, let’s take a look at how the symbols are put together to construct an actual flowchart. hur25338_ch06_093-111.indd 97hur25338_ch06_093-111.indd 97 20/09/11 4:01 PM20/09/11 4:01 PM
  • 5. First Pages 98 Part Two Documentation Techniques 6.3Reflection and Self-Assessment • File (merge) • Generic process • Off-page connector • Predefined process Which flowcharting symbol is used to depict each item below? Give an example as well as a description. (You’ll need to do some outside research for this exercise. You could start by examining the “auto shapes” in Word or PowerPoint.) • Annotation • Decision FLOWCHART DESIGN STEPS As you might suspect, there’s no “one right way” to design a flowchart. But, my AIS stu- dents often ask me the steps I use to prepare one, so I’m adding this section. When I pre- pare a flowchart, I normally follow this seven-step process: 1. Establish the system boundary. The system boundary is critical in designing a flow- chart. Without a well-established system boundary, you end up “analyzing the world” every time you draw a flowchart. The system boundary puts a virtual “box” around the system; this process is sometimes called “delimiting.” For example, if I’m flowcharting the process a company uses to purchase inventory, the system boundary is likely to be the company itself. The outside vendor (i.e., inven- tory supplier) is only important to the extent that it interacts with the company. So, while the flowchart is likely to include a column titled “vendor,” the actions in that column do FIGURE 6.1 Selected Flowcharting Symbols On-page connector (special): shows where a document or process continues on the same page. Multiple copies of a single document (data): shows that a single document, such as a purchase order, has several copies, which would be numbered and tracked separately in the flowchart. If a document doesn’t have copies, the “top layer” only would be enough. Disk storage (data): denotes storage on a hard drive, CD, or similar medium. Manual process (process): used when data are processed manually, such as writing a check or preparing a sales invoice. Terminator (special): starts or ends a business process; also can be used to show destinations such as “the bank.” hur25338_ch06_093-111.indd 98hur25338_ch06_093-111.indd 98 20/09/11 4:01 PM20/09/11 4:01 PM
  • 6. First Pages Chapter 6 Flowcharting 99 not include how the vendor processes the purchase order. The vendor column would include receiving the purchase order, shipping the goods, and billing the client. 2. Determine column headings. As mentioned above, column headings should focus on areas of responsibility—usually department names, functions, or position titles. For example, in a “purchase inventory” flowchart, column headings would include requesting departments, purchasing department, accounting department, receiving department, and vendor. 3. List actions performed within each column. In this step, list what each department does within the system. Notice that we haven’t yet begun thinking about how to represent those actions with flowcharting symbols. It’s important to have a good, clear idea of what goes on in the system before thinking about the symbols. Because flowcharting is a highly iterative process, you might find it necessary to revisit the column headings at this stage—always keeping in mind the system boundary so the flowchart doesn’t grow out of control. For example, the purchasing department would: (a) receive purchase requisitions from requesting departments; (b) prepare a purchase order; (c) send the original pur- chase order to the vendor; and (d) send copies of the purchase order to the requesting department, the accounting department, and the receiving department. 4. Select appropriate symbols. Once I have the list of actions, I think about what flow- charting symbols will best represent them. As you’ll see in the flowchart examples throughout the text, I tend to focus on a small group of commonly recognized symbols. Refer to Figure 6.1 and Reflection and Self-Assessment 6.3 for the actual symbols. Here are a few comments about each one: a. Annotation. This symbol is used to add descriptive comments or explanations to a flowchart. b. Decision. Decision symbols have a single point of entry, but multiple exits. For example, in a personnel selection process, the entry point might be “receive applica- tion documents.” The decision symbol itself would be labeled “Meets qualifica- tions?” and the two exits would be “yes” and “no.” c. Document. Figure 6.1 shows multiple copies of a document. The same symbol would be used alone if a document had no copies. d. File. Sometimes referred to as “merge,” this symbol should always indicate how the documents are filed. Examples include by name or by date. e. Generic process. This symbol can be used for any process in a flowchart. Because it symbolizes a process, it should always be labeled with a verb phrase, such as “receive applications” or “prepare purchase order.” f. Manual process. If you know a process is manual (i.e., doesn’t involve IT), you can use this symbol instead of the generic process. g. On- and off-page connectors. Readability is a critical feature of flowcharts. To avoid crossed lines on a page, use an on-page connector. To avoid overcrowding and move the action of a flowchart between pages, use an off-page connector. On- and off-page connectors always come in pairs with the same label. You can use letters for on-page connectors and numbers for off-page, or vice versa—just be consistent. h. Predefined process. Use this symbol to encapsulate a named process with multiple steps. The multiple steps should either be readily understood by the person reading the flowchart, OR they should be specified elsewhere (such as in a separate flowchart). “Complete the steps in the accounting cycle” is an example of a predefined process. hur25338_ch06_093-111.indd 99hur25338_ch06_093-111.indd 99 20/09/11 4:01 PM20/09/11 4:01 PM
  • 7. First Pages 100 Part Two Documentation Techniques i. Terminator. I tend to use the terminator symbol only to mark the start and end of a flowchart. But, it can also be used to show entry from/exit to some point outside the system boundary. 5. Prepare a first draft. Once I’ve decided on symbols, I draw a first draft of the flowchart, keeping in mind the design conventions listed above. 6. Discuss the flowchart with others. Because flowcharting is somewhat subjective and highly iterative, the first draft is rarely the final product. It’s important to get feedback on the draft from other people, because they can tell you what seems unclear from an outsider’s point of view. Although there’s no “magic number” of people you should con- sult, I usually try to ask two or three colleagues about the draft. 7. Revise as needed. Based on those suggestions, I revise the flowchart as necessary to make it clearer. For your first few flowcharts, you might need several rounds of revi- sion. As you become more experienced, you might be able to cut them down to just one or two. In the next section, we’ll look at an example flowchart. SAMPLE FLOWCHARTS In this section, we’ll look at an example flowchart for common parts of an accounting informa- tion system. Carefully read and study the example. As an AIS professional, you’ll need to be comfortable in “both directions” with flowcharts; that is, looking at a flowchart and describing it in narrative form and reading a narrative description and preparing a flowchart. As a student, you see a “finished product” when your professor comes into the class- room at the start of a new term. But, have you ever thought about what happens in prepara- tion for that first class meeting? Even for a class a professor who has taught repeatedly, most of us spend considerable time “up front” designing a course. In this section, we’ll use the first five flowchart design steps listed above to create a systems flowchart of the course design process. (I’m omitting the last two steps from the discussion because they are fairly self-explanatory.) 1. Establish the system boundary. This flowchart begins with an already established course; that is, a course that already has a title, a description, a course number, and other details. It’s already been through whatever approval process the university has established. The task before us is to figure out how to apply the general ideas from the approved docu- ments to design a particular offering of a class. The process will end when all the course materials are ready; it will not include the delivery of the course to students. 2. Determine column headings. Given that system boundary, what parties are involved in course design? We’ll include two in our flowchart: the designer (i.e., the faculty member teaching the course) and the publishers (who will provide materials like textbooks). 3. List actions performed within each column. Here are the actions commonly performed by each party identified above: a. Designer i. Establish expected student outcomes. (generic process) ii. Develop preliminary list of possible textbooks/articles/cases. (generic process) iii. Order exam copies. (predefined process and document) iv. Review exam copies. (predefined process) v. Select course materials. (manual process) hur25338_ch06_093-111.indd 100hur25338_ch06_093-111.indd 100 20/09/11 4:01 PM20/09/11 4:01 PM
  • 8. First Pages Chapter 6 Flowcharting 101 vi. Determine topic sequence. (generic process) vii. Develop grading plan. (predefined process) viii. Choose/create additional course materials. (decision, predefined process, document) ix. Write syllabus. (generic process and document) x. File course materials. (file) b. Publisher i. Receive and process orders for exam copies. (predefined process) ii. Send exam copies to the designer. (document) 4. Select appropriate symbols. The symbol we’ll use for each action above is shown in parentheses after the action. 5. Prepare a first draft. See Figures 6.2 and 6.3 for the flowchart. Does every professor follow those exact steps to design a course? Probably not. Would every flowchart of those exact steps look like Figures 6.2 and 6.3? Definitely not. But, you could use the flowchart as a basis for teaching someone how to design a course or for help- ing someone (like an AIS student) understand what happens before their professor sets foot in the classroom each term. Here are some additional notes about the flowchart: 1. In this example, the on-page connectors are labeled with numbers. You could also use letters instead. 2. The off-page connector has two important pieces of information. In Figure 6.2, it shows the destination page (p. 2) and an identifier (A). In Figure 6.3, it shows the source page (p. 1) and the same identifier (A). If you use letters for on-page connectors, it’s a good idea to use numbers for off-page connectors. FIGURE 6.2 Systems Flowchart of Course Design Process Page 1 of 2 Publisher Process order Exam copies 1 2 Designer Establish expected student outcomes Start Develop preliminary materials list. Order exam copies Select course materials Determine topic sequence. Develop grading plan Exam copy order p. 2 A 2 1 hur25338_ch06_093-111.indd 101hur25338_ch06_093-111.indd 101 20/09/11 4:01 PM20/09/11 4:01 PM
  • 9. First Pages 102 Part Two Documentation Techniques 3. The document, “exam copy order,” appears only in the first column. Some flowchart designers would also put it in the second column just to clarify what’s entering the pub- lisher’s part of the system. 4. The file symbol indicates how the documents are filed. If they were stored in a computer database, you would use a cylindrical symbol labeled with the name of the database. 5. Figure 6.3 (the second page of the flowchart) includes only the designer column. Because no actions take place on that page for the publisher, you don’t need a “publisher”column on the second page. 6. Although the designer makes several decisions along the way, only one is represented with a decision symbol. My general guideline is to use the decision symbol when an action has a fixed number of outcomes—usually two, but sometimes more than two. FLOWCHARTING AND ACCOUNTING INFORMATION SYSTEMS So how does all this material relate to your study of accounting information systems? AIS professionals use flowcharts in many different ways, including confirming how a system is currently operating, suggesting improvements to an accounting information system, evalu- ating internal control deficiencies, and designing procedures manuals. In your very first accounting job after you graduate, you’ll likely be coming into an unfamiliar environment.You may wonder “how things work” in the accounting information system, especially if you’re in charge of a particular function such as accounts payable or accounts receivable. Additionally, if you’re working for a CPA firm or as a consultant, you may need to confirm how a system is operating currently before you start an audit or make FIGURE 6.3 Systems Flowchart of Course Design Process Page 2 of 2 Syllabus Additional materials Write syllabus Course number Additional materials needed? No Yes Choose / create materials End p. 1 A Designer hur25338_ch06_093-111.indd 102hur25338_ch06_093-111.indd 102 20/09/11 4:01 PM20/09/11 4:01 PM
  • 10. First Pages Chapter 6 Flowcharting 103 recommendations regarding operational efficiency. In all those cases, a flowchart can be a useful way to conceptualize the big picture of a system. You’d probably want to look over any existing procedures manuals and talk with employees familiar with the system already. Then, you can try designing a flowchart to model a business process. Once you’ve com- pleted a first draft, discuss it further with others in the organization. Explain to them what it says and ask if that’s the way things “really work” in the company, or if you’re misunder- standing something. Remember: The overall goal of a flowchart in this situation is to under- stand the current state of things—the way they are, not necessarily the way they should be. If you’re looking at a previously constructed flowchart, whether you’ve created it or not, you can try to spot opportunities for improvement. Critically analyzing a flowchart is a tough job—there are no hard-and-fast rules for doing it. You’ll need to draw on your train- ing, experience, and ordinary business sense to identify and describe possible improve- ments in an accounting information system. Once again, interviewing and other kinds of research will help in this task. Ask employees, for example, what their biggest complaint is about the current process. If they’ve thought about ways to improve it, listen to those as well. You could ask employees in one-on-one or small group interviews; written surveys, e-mail exchanges, and employee suggestion boxes also can help in gathering ideas about process improvements. In many cases, the employees closest to a process can provide the best suggestions for making things better; in some cases, a system outsider can provide a new, fresh idea based on experience in other organizations. Opportunities for improve- ments might include redesigning forms, increasing or decreasing the number of copies of a particular form, obtaining authorizing signatures for transactions, filing in a different way (for example, based on date rather than customer name or vice versa), or changing a form from paper-based to electronic (or vice versa). Flowcharts also can be used to spot internal control deficiencies in an accounting informa- tion system. A flowchart can enhance a risk analysis by providing a concrete picture of an accounting information system. To use a flowchart to spot internal control deficiencies, start by making a list of the system’s risk exposures. Then, look at the flowchart with those risk exposures in mind. Do any of the organization’s processes or documents increase its exposure to specific risks? For example, if a company maintains only an electronic record of inventory purchases, you’ll see that in a flowchart. In that case, the company is exposed to a systems risk. What controls has the company implemented to reduce its exposure to systems risk? Are the controls strong and adequate given the level of the risk? For example, does the company also maintain a paper file that is not shown on the flowchart? Or is a paper file missing from the flowchart because it doesn’t exist? Finally, flowcharts can be a starting point for the development of procedures manuals. A procedures manual is simply an “instruction book” that explains how everyday tasks in an organization are accomplished. Halbert (2003) recommends that “every staff member . . . document his or her duties and write a procedures manual—a time-consuming effort but worth doing.”A well-constructed flowchart can easily be “translated” into regular, step-by- step text for use by future employees. CRITICAL THINKING As you read earlier in this chapter, developing flowcharts is as much “art” as “science.” Therefore, learning to create good, descriptive flowcharts is often a challenge for account- ing students—knowing the rules and conventions only takes you part of the way, in just the same way that you can’t really learn to drive a car simply by reading a book. So, for this section, I’m going to show you how I usually go about creating a flowchart; please keep in Systems risk relates directly to information technology. As organiza- tions become increaingly dependent on computers and related IT to deliver goods and services to customers, they risk the possibility that IT resources will fail at a critical moment. hur25338_ch06_093-111.indd 103hur25338_ch06_093-111.indd 103 20/09/11 4:01 PM20/09/11 4:01 PM
  • 11. First Pages 104 Part Two Documentation Techniques mind that the way I do it is a result of my own experience and training. It’s not the “one right way” to develop flowcharts. If you’ve had some intermediate accounting already, you probably know the process the Financial Accounting Standards Board uses to develop new accounting pronouncements. In case you haven’t studied that yet, here’s a summary (Spiceland et al., 2009, p. 14): 1. Identification of problem. A measurement or reporting issue is identified by the Emerg- ing Issues Task Force and placed on the FASB’s agenda. 2. The task force. A task force of approximately 15 knowledgeable persons is appointed to advise the Board on various matters. 3. Research and analysis. The FASB’s technical staff investigates the issue. 4. Discussion memorandum (DM). The DM, a detailed analysis of the problem along with alternative solutions, is prepared and disseminated to interested parties. 5. Public response. Public hearings are held to discuss the issue and letters of response are sent to the FASB, which then analyzes this feedback. 6. Exposure draft (ED). A preliminary draft of a proposed statement, called an exposure draft, is issued. The ED details the proposed treatment for the problem. 7. Public response. Written responses to the ED are accepted and analyzed. The ED is revised, if necessary, depending on the Board’s analysis. 8. Statement issued. An SFAS [Statement of Financial Accounting Standards] is issued if four of the seven FASB members support the revised ED. So how would you encapsulate those eight steps in a systems flowchart? First, I usually decide how many columns the flowchart will have, keeping in mind that you need one col- umn for each area of responsibility. In the eight-step process, the groups involved are the Emerging Issues Task Force, the advisory task force, technical staff, the public, and the FASB. So, the flowchart will need five columns. Next, I normally consider what each group does and how to translate those actions into flowcharting symbols. The Emerging Issues Task Force identifies issues; a generic process symbol could be used to represent that. The Board does several things: appoints the advisory task force (generic process or predetermined process symbol), prepares documents (document symbol), analyzes feed- back (generic process), and votes (decision symbol). The advisory task force advises the Board, while the technical staff conduct research. The process also involves several docu- ments, each of which should be depicted with a document symbol. Once I know how many columns and what kinds of symbols to use, it’s time to start drawing the flowchart. I usually use graphics software like Visio or SmartDraw; you could also start with a paper-and-pencil sketch. Keep in mind that the flowchart should have a single “start” symbol and a single “end” symbol; it should also follow the rules and con- ventions discussed at the beginning of this chapter. Once the first draft is done, I discuss it with other people, make any needed changes, and then discuss it again; the flowchart is “done” when it fairly represents the process involved. Try drawing a flowchart of the standard-setting process based on the preceding description. Share your work 6.4Reflection and Self-Assessment with at least one other person—perhaps someone in your AIS course. Then, revise the flowchart as needed. hur25338_ch06_093-111.indd 104hur25338_ch06_093-111.indd 104 20/09/11 4:01 PM20/09/11 4:01 PM
  • 12. First Pages Chapter 6 Flowcharting 105 Here is a summary of the chapter: 1. List and discuss the purpose and use of systems flowcharts, document flowcharts, pro- gram flowcharts, and hardware flowcharts. A systems flowchart provides a top-level view of an information system; it shows the “big picture” of what is happening. A docu- ment flowchart, as the name implies, shows how documents (paper and electronic) flow through an information system, while a program flowchart details the steps in a specific computer program. A hardware flowchart lays out the computers, printers, monitors, and other hardware devices used in an information system. 2. Explain the basic parts of and design considerations common to all types of flowcharts. In general, a flowchart should be read from top to bottom and left to right. Since flow- charts are communication tools, they should be easy to read, incorporating plenty of white space. Every flowchart should have a title to make it easier to reference after its creation; flowcharts also should be organized into columns based on areas of responsi- bility in the information system. Documents should have clear beginning and ending points as well. Finally, flowcharts are usually the product of discussion among col- leagues, rather than the product of a single individual. 3. Identify and describe common symbols and information technology tools used in flow- charting. Figure 6.1 shows various flowcharting symbols; your individual research (Reflection and Self-Assessment 6.3) revealed more. Two popular IT tools for flowchart creation are SmartDraw and Visio. 4. Discuss ways flowcharts impact the design, implementation, and evaluation of account- ing information systems. A well-constructed flowchart can give a new accountant or consultant a quick overview of how a system works. Flowcharts also can be used as part of the auditing process and/or to suggest process improvements in the accounting infor- mation system, particularly when combined with a risk/control matrix. They also can inform recommendations regarding internal controls. 5. Create and interpret systems flowcharts. Three key ideas are important in creating flow- charts: (a) strive to achieve a clear representation of the system, not a deterministic response to a particular problem or case situation; (b) practice will increase your skill in flowcharting; and (c) seldom will your first creation be your final one—flowcharts can almost always be improved via dialogue and consultation with other professionals. Flowcharting is one commonly used documentation techniques for accounting information systems. For accounting students, who typically like dealing with numbers better than words and symbols, they can be challenging. But, with time, practice, and patience, you can learn the art of developing clear, meaningful flowcharts and using them as analytical tools in the accounting information system. Summary document flowcharts, 95 hardware flowcharts, 95 Microsoft Visio, 97 program flowcharts, 95 SmartDraw, 97 symbols, 97 systems flowcharts, 95 Key Terms Egerdahl, R. 1995. “A Risk Matrix Approach to Data Processing Facility Audits.” Internal Auditor, June, pp. 34–40. Halbert, J. 2003. “Mining Back-Office Operations May Bolster the Bottom Line.” Los Angeles Business Journal, April 14, www.findarticles.com (last visited November 4, 2004). Spiceland, J. D., J. Sepe, M. W. Nelson, and L. A. Tomassini. 2000. Intermediate Accounting 5th ed. New York: Irwin/McGraw-Hill. Chapter References hur25338_ch06_093-111.indd 105hur25338_ch06_093-111.indd 105 20/09/11 4:01 PM20/09/11 4:01 PM
  • 13. First Pages 106 Part Two Documentation Techniques End-of- Chapter Activities 1. Reading review questions. a. What is a flowchart? Describe four different kinds of flowcharts and explain which are most often used in an accounting information system. b. Summarize the rules and conventions commonly observed in the preparation of flowcharts. c. List and explain the meaning and use of 10 common flowcharting symbols. What sources would you consult for learning about additional symbols not on your list? d. How are flowcharts used in working with accounting information systems? e. Respond to the questions for this chapter’s “AIS in the Business World.” 2. Reading review problem. The Sarbanes-Oxley Act of 2002 (SOX) was a reaction to the corporate accounting scandals of the late 20th century. In discussing some of the positive results of SOX, Harrington stated: Companies can find additional uses for Sarbanes-Oxley documentation as a tool for audit committees, a way to enhance employee decisions based on cross- function process information and a means of increasing efficiencies by eliminating duplicate controls. Alltel Corporation (www.alltel.com) documented 100 company processes within the scope of [SOX]. Alltel’s internal audit team reports to the company’s audit committee. Its process documentation includes six flowcharts per process, supported by memos and narratives. The audit committee can use this information to support its decisions. She concluded her article with these summary comments: CPAs can use the documentation to provide audit committees with more detailed information, to empower all employees to consider cross-functional processes and to lead the entire company in using section-404-type documentation. Since there is no way to avoid the cost, might just as well find ways to spread the expenditures over this greater array of benefits. So, flowcharts aren’t just something you study in AIS class. In fact, in a survey conducted by Bradford, Richtermeyer, and Roberts, nearly half of the respondents reported using flowcharts to document accounting information systems. Sources: Cynthia Harrington, “The Value Proposition,” Journal of Accountancy (September 2005), pp. 77—81; Marianne Bradford, Sandra B. Richtermeyer, and Douglas F. Roberts, “System Diagramming Techniques: An Analysis of Methods Used in Accounting Education and Practice,” Journal of Information Systems (Spring 2007), pp. 173–212. a. Which type(s) of flowcharts discussed in the chapter would be relevant in this case? Explain your response. b. SOX imposes serious requirements regarding internal control on publicly-traded corpora- tions. Those requirements include the CEO and CFO personally reviewing the company’s internal control system, identifying weaknesses and known cases of fraud. Suppose you were creating a systems flowchart depicting a typical SOX process; identify three or four symbols you would expect to use in that flowchart, and explain how you would use them. 3. Multiple choice review questions. Please select the best answer for each question. 1. Which of the following best describes a systems flowchart? a. Shows the flow of documents through an information system b. Shows the logic used to create a program c. Shows the “big picture” view d. Shows how hardware elements are configured in a system 2. Which of the following statements about “white space” in a flowchart is most true? a. White space prohibits the use of color in flowcharts. b. At least 50 percent of the page should be devoted to white space. hur25338_ch06_093-111.indd 106hur25338_ch06_093-111.indd 106 20/09/11 4:01 PM20/09/11 4:01 PM
  • 14. First Pages Chapter 6 Flowcharting 107 c. White space is unimportant in document flowcharts. d. Adequate white space is a matter of judgment. 3. In a systems flowchart, columns denote: a. Areas of responsibility. b. People’s names and titles. c. That the flowchart is unfinished. d. A lack of adequate white space. 4. In a systems flowchart, a terminator symbol can be used to indicate: (i) the start or end of a business process or (ii) a destination outside the system boundary. a. i only b. ii only c. Both i and ii d. Neither i nor ii 5. In creating a systems flowchart, selecting appropriate symbols comes immediately after: a. Determining column headings. b. Establishing the system boundary. c. Discussing the flowchart with others. d. Listing actions performed within each column. 4. Making choices and exercising judgment. Compare and contrast SmartDraw and Micro- soft Visio. Prepare a paper and/or PowerPoint presentation that include a recommen- dation regarding your preferred flowcharting software; justify your recommendation. 5. Field exercises. Visit a local restaurant for lunch or dinner. Pay close attention to the steps involved in ordering, receiving, and paying for a meal. Create a flowchart that depicts the process. List and discuss one or two internal controls you observe in the process; also suggest one or two ways the system could be improved. 6. Flowchart creation. Create a flowchart based on each of the following independent situations (one flowchart per situation). a. Case 1. Cori’s Catering Services Cori is the owner and manager of a catering company. CCS provides complete meals (breakfast, lunch, and dinner), as well as an assortment of hot and cold appetizers and drinks, for groups of 12 to 500. CCS receives orders in three main ways: e-mail, telephone, and personal office consultation. In some cases, the customer has an idea of what he/she wants; in others, the customer relies on Cori’s expertise to select appropriate items. For each catering job, Cori prepares an estimate for the client; she files one copy of the estimate and sends the other to the client for approval. The client may make changes to the estimate over the phone, via e-mail, or through a personal consultation. Once the estimate has been finalized, Cori prepares a catering contract for the client’s signature. She requires a 50 percent deposit with the signed contract; the remaining catering fees can be paid within 30 days of the catering event. Cori accepts cash and checks; she does not accept credit cards. The client signs the contract and sends it back to Cori. Cori also signs it, files a copy for her own records, and sends a copy with both signatures back to the client. Cori and her staff deliver the catering order as scheduled, and she bills the client for any remaining fees. The client pays the invoice within 30 days and Cori deposits the funds in her bank account. b. Case 2. University Bookstore Ordering textbooks in a university bookstore is a massive undertaking that requires good organizational, communication, and coordination skills. The process begins with faculty deciding which textbooks they want to use. Professors communi- cate relevant information about the textbook (title, author, ISBN, edition, publisher, copy- right date) to a department chair or secretary, who consolidates all the orders. That communication may take place with a paper form or an e-mail. In either case, the departmental representative prepares a standard university book requisition form in triplicate: one copy for hur25338_ch06_093-111.indd 107hur25338_ch06_093-111.indd 107 20/09/11 4:01 PM20/09/11 4:01 PM
  • 15. First Pages 108 Part Two Documentation Techniques the requesting faculty member, one for the department, and one for the bookstore. The book- store receives and consolidates requisition forms from all across the university and prepares purchase orders for textbook publishers. Each purchase order has three copies: one for the publisher, one for the purchasing department, and one for the accounting department. When the publisher sends the books, the bookstore’s receiving department prepares two copies of a receiving report; one is filed to indicate that the goods were received, while the second is forwarded to the accounting department. The publisher sends a billing statement (invoice) directly to the accounting department. Once all three documents have been matched and veri- fied, the accounting department writes a check or sends an electronic funds transfer to the publisher. The bookstore staff then sort the books based on class and stock the shelves, where the books await purchase by students. c. Horacio is a college student at Feng Shui University. He rents an apartment from the univer- sity for $600 a month. On the 15th of every month, Horacio writes a check for the rent. He mails the check to the Housing Services office on campus; in turn, Housing Services sends an e-mail receipt back to Horacio. The mailroom staff in Housing Services makes a copy of the check for Horacio’s file and sends the original, with all the other rent checks for the month, to the bank. Once a month, the treasurer of Housing Services reconciles the bank statement. Prepare a flowchart of the preceding scenario. d. Visit the Web site of the International Accounting Standards Board. Summarize the process the Board uses to develop International Financial Reporting Standards (IFRS), then create a systems flowchart of the process. 7. (CMA adapted) Narrative preparation from a flowchart. a. Consider the Richards Furniture Company flowchart presented below in Figure 6.4. Write a narrative description of the business process it depicts. b. Consider the PriceRight Electronics Inc. flowchart presented below in Figure 6.5. Write a narrative description of the business process it depicts. FIGURE 6.4 Flowchart for Richards Furniture Company Salesperson Cashier Assistant Manager Manager Three copies go to the cashier; one is retained in the sales book. Prepare sales Sales invoice (4 invoice copies) Sales invoice (3 copies) Cash register Tape 1 Assign Approve sale and process Validated invoice, check or cash, return slip Reconcile Reconciled report and prepare Prepare bank deposit Deposit documents To bank bank Review Date deposit report 1 consecutive number One copy of the validated invoice goes to the customer; one stays in the store, and the third goes to the assistant manager. hur25338_ch06_093-111.indd 108hur25338_ch06_093-111.indd 108 20/09/11 4:01 PM20/09/11 4:01 PM
  • 16. First Pages Chapter 6 Flowcharting 109 8. Flowchart and system critiques. a. Consider the Richards Furniture Company flowchart again. Describe at least two strengths and at least two weaknesses of the flowchart itself. Then, identify and describe at least two strengths and at least two weaknesses of the process it depicts. For each process weakness, suggest a way to correct it. b. Consider the PriceRight Electronics Inc. flowchart again. Describe at least two strengths and at least two weaknesses of the flowchart itself. Then, identify and describe at least two strengths and at least two weaknesses of the process it depicts. For each process weakness, suggest a way to correct it. 9. Terminology. Please match each item on the left with the best item on the right. 1. Areas of responsibility 2. Document flowchart 3. Hardware flowchart 4. Inverted triangle 5. Origin and termination 6. Overlapping shapes 7. Program flowchart 8. Spotting internal control deficiencies 9. Systems flowchart 10. Title a. A flowchart depicting the process of buying a car. b. Based on lines of computer code. c. Can trace remittance advices and invoices through a system. d. Documents in a flowchart should have these. e. Every flowchart should have one of these. f. One application of flowcharting in AIS. g. Represents a file in a flowchart. h. Shows monitors, input devices, and computers. i. Used to show multiple copies of a document. j. What columns represent in a flowchart. FIGURE 6.5 Flowchart for PriceRight Electronics Inc. Customer Marketing Credit Warehouse Shipping and Receiving Customer order Sales order New customer credit check Sales order (to shipping and receiving) Maintain inventory master file Stock status report Sales order system Sales order (to customer) Compare for material availability Assemble order Update inventory master file Accept and inspect material Master file of customer credit limits Pack and ship order Sales order/ packing slip (to customer) hur25338_ch06_093-111.indd 109hur25338_ch06_093-111.indd 109 20/09/11 4:01 PM20/09/11 4:01 PM
  • 17. First Pages 110 Part Two Documentation Techniques 10. Multiple choice questions. Consider the following narrative as you respond to these questions: When staff at IGV Corporation need to travel on company business, they first submit a travel request to their immediate supervisor. The travel request includes the employee’s identifying information; dates, location, and purpose of the trip; and a budget. The supervisor compares the travel budget to the department’s total travel budget; if sufficient funds are available, the supervisor evaluates the need for the trip by comparing it to the department’s strategic plan. If the trip is approved, the supervisor submits the budget to the cash expenditures department, where a staff member issues a travel advance to the employee. After the trip, the employee submits receipts and either pays back any excess advance funds or receives additional reimbursement for expenses incurred. If insufficient funds are available or if the trip does not support the strategic plan, the request is filed by employee name. In each question, assume you are creating a systems flowchart of the narrative. 1. All of the following would be column headings except: a. Cash expenditures department. b. Department strategic plan. c. Staff member. d. Supervisor. 2. Which of the following actions would require the use of this symbol? a. Compare travel budget to total budget b. File request c. Issue travel advance d. Prepare budget 3. Which of the following actions would require the use of this symbol? a. Compare travel budget to total budget b. File request c. Issue travel advance d. Prepare budget 4. Which of the following is most likely to fall outside the system boundary? a. Supervisor b. Receipts c. Conference hotel d. Additional reimbursement hur25338_ch06_093-111.indd 110hur25338_ch06_093-111.indd 110 20/09/11 4:01 PM20/09/11 4:01 PM
  • 18. First Pages Chapter 6 Flowcharting 111 5. Which of the following actions is most likely to be depicted with this symbol? a. Evaluate the need for the trip b. File receipts c. Prepare strategic plan d. Issue travel advance 11. Statement evaluation. Indicate whether each statement below is (i) always true, (ii) sometimes true, or (iii) never true. For those that are (ii) sometimes true, explain when the statement is true. a. Columns in a systems flowchart denote areas of responsibility. b. Flowcharts are focused on business documents. c. Flowcharts should include off-page connectors for easier reading. d. Monthly bank reconciliations ensure that no one embezzles cash. e. Once designed, flowcharts do not need to be revised. f. On-page connectors help keep flowcharts uncluttered and easy to read. g. Process symbols should be sandwiched between an input and an output. h. The first step in drawing a flowchart is to decide which software package to use. i. Two designers would independently create identical flowcharts for the same business process. j. Visio is the best tool for drawing flowcharts. hur25338_ch06_093-111.indd 111hur25338_ch06_093-111.indd 111 20/09/11 4:01 PM20/09/11 4:01 PM