Download to read offline
![International Research Journal of Engineering and Technology (IRJET) e-ISSN: 2395-0056
Volume: 09 Issue: 07 | July 2022 www.irjet.net p-ISSN: 2395-0072
© 2022, IRJET | Impact Factor value: 7.529 | ISO 9001:2008 Certified Journal | Page 884
Optimization of Tool Path and Process Parameters in Slot Milling using
Grey Relational Analysis
Parth Harbola
---------------------------------------------------------------------***---------------------------------------------------------------------
Abstract - End milling is an operation whichemploysanend
mill cutter for face milling, edge milling and slot milling. It is
a very widely used machining operation that is extensively
used in shipyard, automotive & aerospace industries.
Different types of tool paths can be used during the end
milling of the AISI D3 material. Each toolpath has its own
effects on the performance characteristics of slot milling.
Some toolpaths may provide better surface roughnesswhile
other toolpaths may provide lower cutting force. The
manufacturer wants to produce the machining components
with better surface finish.Atthesametimethemanufacturer
wants lower cutting force and less amount of energy to be
spent while machining the components. Hence, it is
important to determine the best toolpath and cutting
conditions which will provide lower surface roughness of
them machined component, lower cutting force on the tool
and less amount of energy spent for the machining. This
research result would identify the best toolpath and
optimum cutting parameter which will provide better
surface finish as well as low cutting forceandspecificcutting
energy.
Key Words: AISI, End Milling, Cutting Force, Toolpath,
Surface Finish
1. INTRODUCTION
There has been an increasing demand for high quality
machined components that would be highly beneficial to
manufacturing industriesasitwouldhelpthemanufacturing
engineer and mechanist to selectbestmachiningparameters
and toolpath strategies. The Different types of tool pathscan
be used during the end milling of the AISI D3 material. Each
toolpath has its own effects on the performance
characteristics of slot milling. Cevdet Gologlu et.al [1]
investigated the effects of cutter path strategies on the
surface roughness of DIN 1.2738 mould steel during pocket
milling operations based on Taguchi method. P.E Romero
et.al [2] studied the influence oftoolpathstrategyandpocket
geometry on surface roughness, cuttingforceand machining
time. Some toolpaths may provide better surface roughness
while other toolpaths may provide lower cutting force. The
manufacturer wants to produce the machining components
with better surface finish and at the same time want to
reduce cutting force and amount of energy to be spent while
machining the components. Hence, it is important to
determine the best toolpath and cutting conditions which
will provide lower surface roughness of the machined
component, lower cutting force on the tool and less amount
of energy spent for the machining.
The experimental runs were generated using L9 Taguchi
orthogonal array. The input parameters selected are Tool
path, Cutting speed and feed rate. Depth of cut remains
constant during the experiment. Jayakrishnan et.al [3]
Taguchi-Grey relational analysis was utilizedtooptimize the
multi response end milling characteristics during the end
milling of Aluminum alloy. B. Rajeswari et.al [4] used
response surface methodology to generate the design of
experiment and then utilized the grey relational analysis to
find the optimum machining characteristics. Mastercam X6
software was used to generate the NC codes for the
experimental runs required for the machining of the
components. Using the NC codes obtained from Mastercam
software the experiments were performed in the 3-axis
vertical milling machine. The performance characteristicsof
the machined components weremeasured. Theoptimization
of the parameters was done using Grey relational analysis.
The optimum cutting conditions were obtained from the
result which was compared with the initial cutting
parameters to verify whether the performance
characteristics of the machined components wereimproved
or not.
Thus, the result of this research will help the manufacturer
to select the best toolpath strategy and cutting conditions
which will help him to manufacturehighqualitycomponents
and simultaneously reducing the cost of production.
1.1 Research Objective
Objective of this research are:
1. To study the influence of tool path (Raster,
Trochoidal and Hybrid) with respect to output
quality characteristics
2. To analysis the significance of process parameters
(speed, feed rate) along with toolpath with respect
to output quality characteristics.
3. To optimize the process parameters by utilizing
Grey Relational Analysis.
Product Design Engineer, CEAT Tyres Limited, Gujarat, India](https://image.slidesharecdn.com/irjet-v9i7168-221022075544-cdda4dc4/75/Optimization-of-Tool-Path-and-Process-Parameters-in-Slot-Milling-using-Grey-Relational-Analysis-1-2048.jpg)

![International Research Journal of Engineering and Technology (IRJET) e-ISSN: 2395-0056
Volume: 09 Issue: 07 | July 2022 www.irjet.net p-ISSN: 2395-0072
© 2022, IRJET | Impact Factor value: 7.529 | ISO 9001:2008 Certified Journal | Page 890
REFERENCES
1. Cevdet Gologlu, Nazim Sakarya (2007). The effects
of cutter path strategies on surface roughness of
pocket milling of 1.2738 steel based on Taguchi
method. Journal of material
2. P.E Romero et.al [2] studied the influence of
toolpath strategy and pocket geometry on surface
roughness, cutting force and machining time.
3. Jayakrishnan Unnikrishnan Pillai et al Optimization
of multi response characteristics on end milling of
aluminum alloy using Taguchi-Grey relational
approach. Measurement Vol 124, pp.291-298
4. B. Rajeswari et.al [5] used response surface
methodology to generate the design of experiment
and then utilized the grey relational analysis to find
the optimum machining characteristics.](https://image.slidesharecdn.com/irjet-v9i7168-221022075544-cdda4dc4/75/Optimization-of-Tool-Path-and-Process-Parameters-in-Slot-Milling-using-Grey-Relational-Analysis-7-2048.jpg)

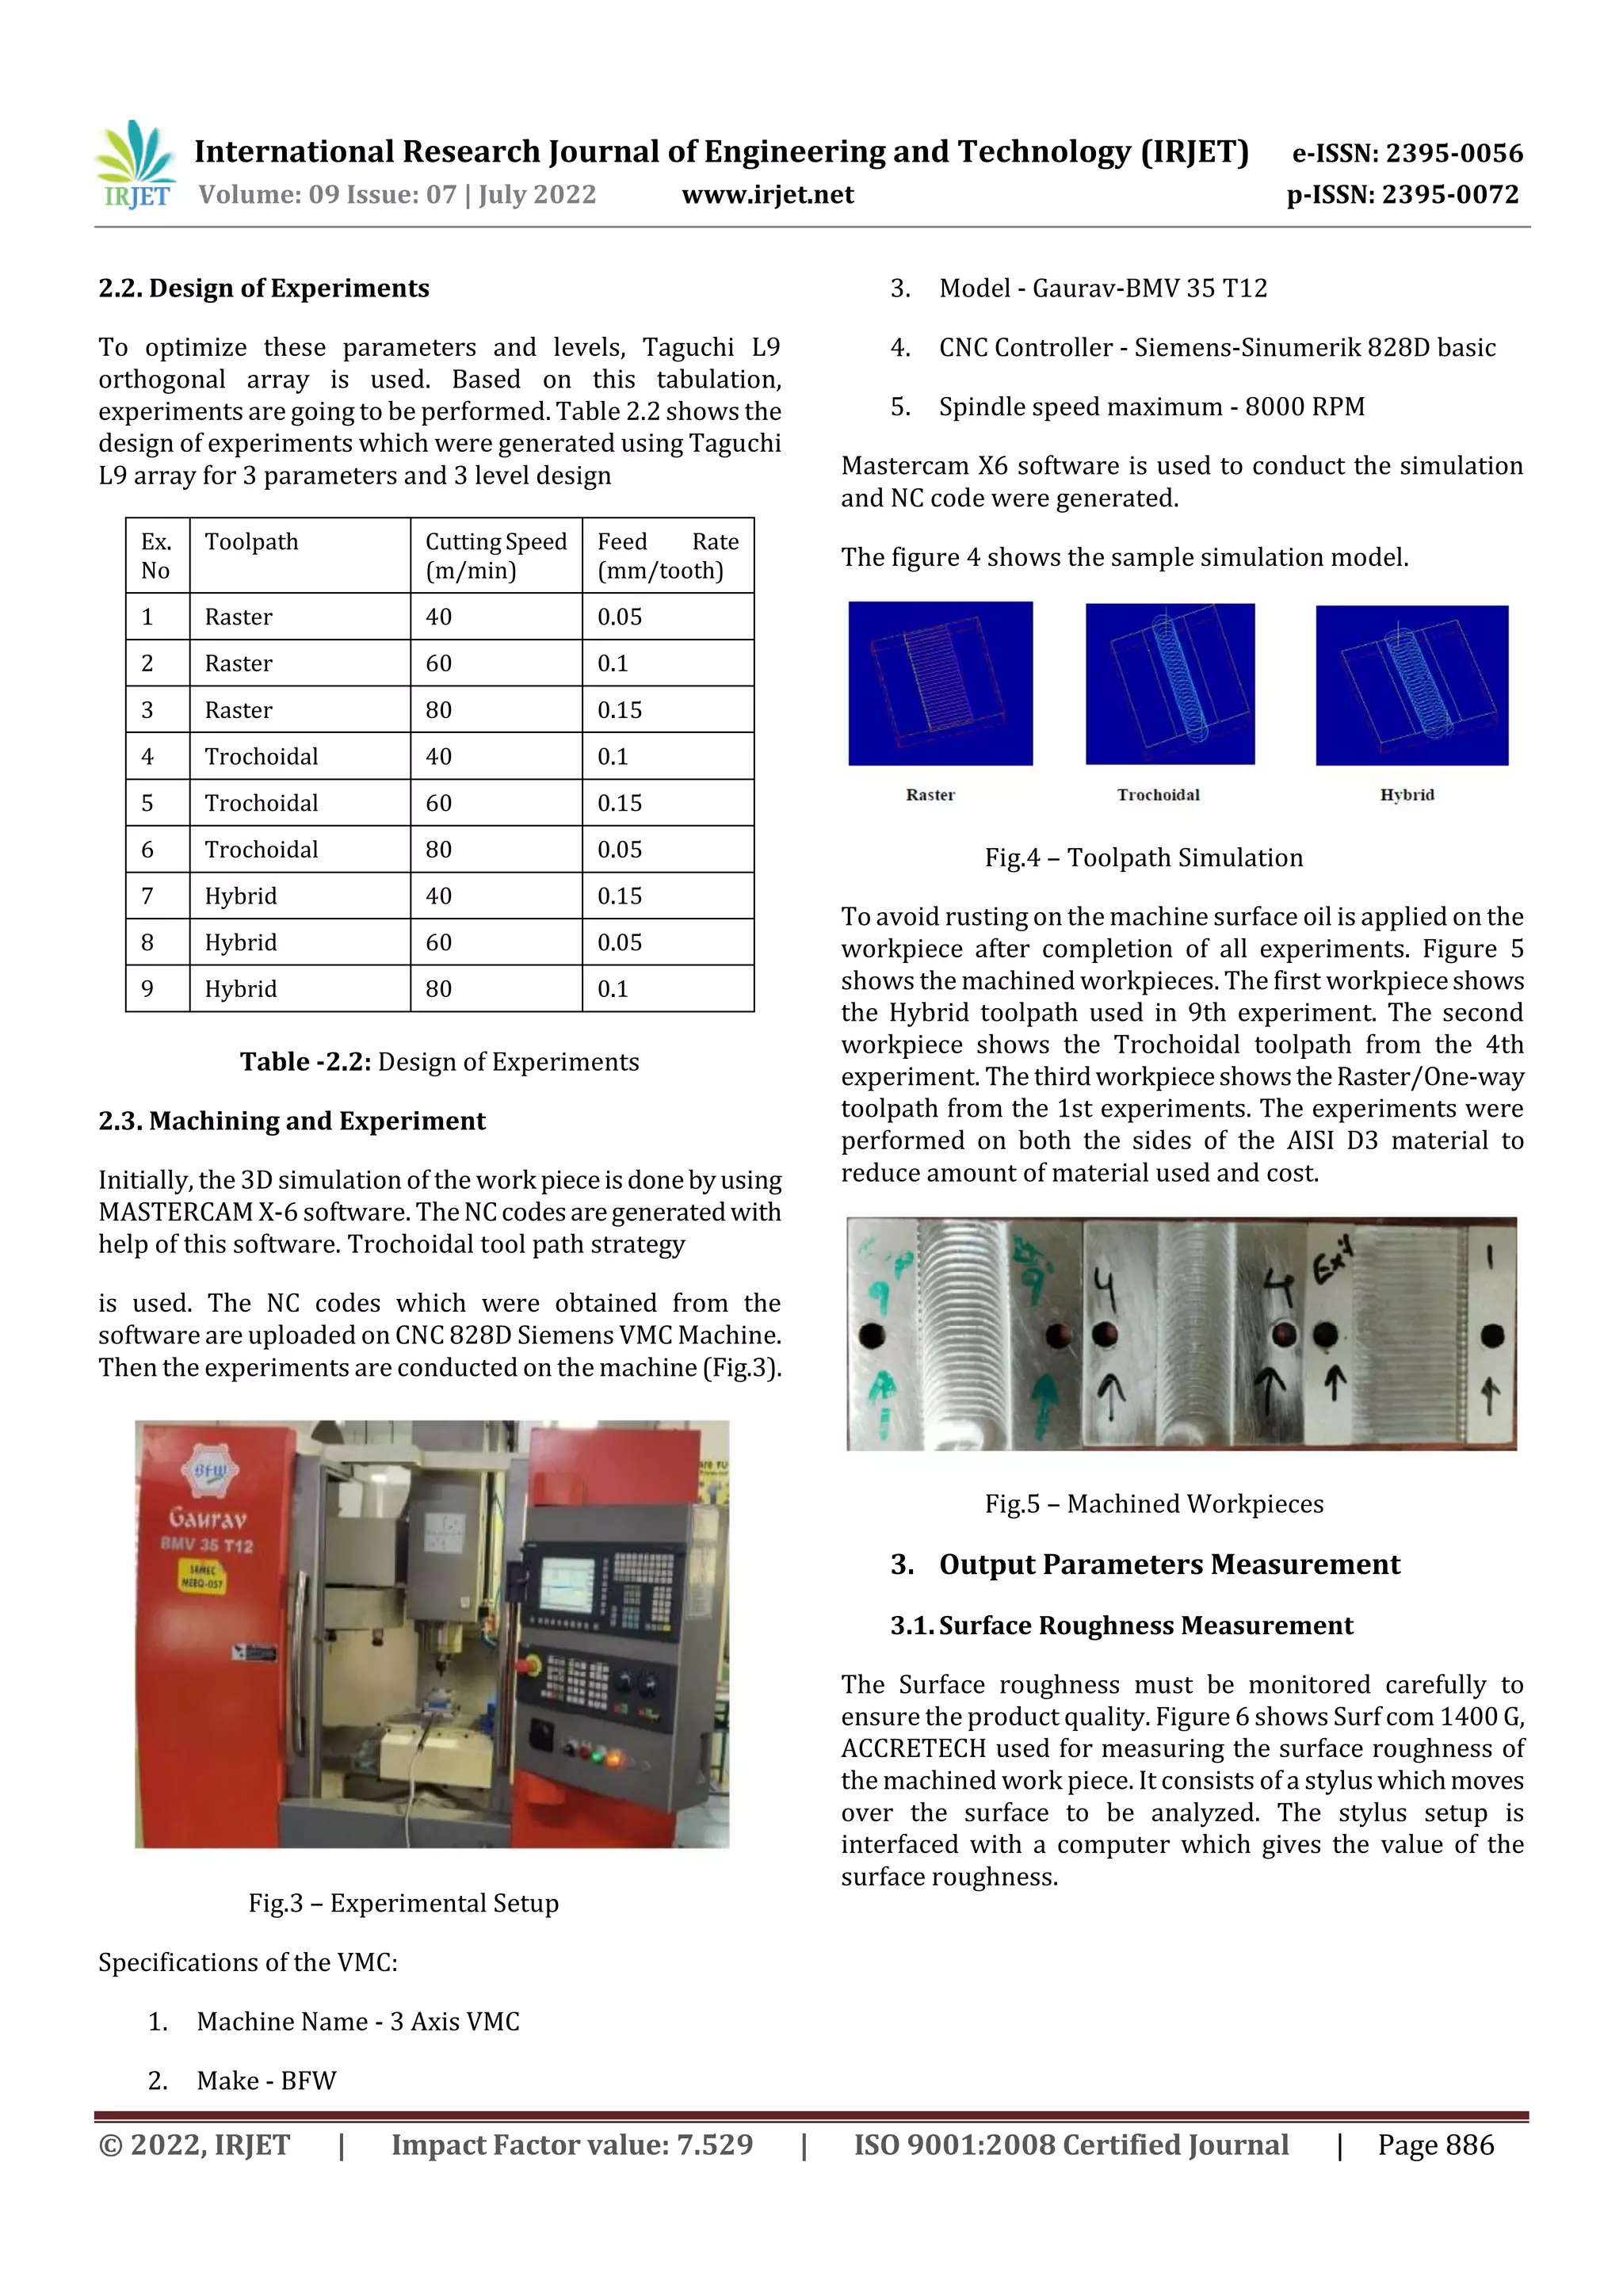
This document summarizes a research study that aimed to optimize the tool path and process parameters for slot milling of AISI D3 steel. The study investigated different tool paths (raster, trochoidal, hybrid) at various cutting speeds and feed rates using a Taguchi experimental design. Surface roughness and cutting forces were measured for each experimental run. Grey relational analysis was used to analyze the results and identify the optimal tool path and cutting conditions that minimized surface roughness and cutting forces. The results of the study will help manufacturers select machining parameters that improve part quality while reducing production costs.