Eating habits and nutritional status among adolescent school girls: an experience from rural area of West Bengal
•
1 like•269 views

IOSR Journal of Dental and Medical Sciences is one of the speciality Journal in Dental Science and Medical Science published by International Organization of Scientific Research (IOSR). The Journal publishes papers of the highest scientific merit and widest possible scope work in all areas related to medical and dental science. The Journal welcome review articles, leading medical and clinical research articles, technical notes, case reports and others.

Recommended
Recommended
More Related Content
What's hot
What's hot (19)
Similar to Eating habits and nutritional status among adolescent school girls: an experience from rural area of West Bengal
Similar to Eating habits and nutritional status among adolescent school girls: an experience from rural area of West Bengal (20)
More from iosrjce
More from iosrjce (20)
Recently uploaded
Recently uploaded (20)
Eating habits and nutritional status among adolescent school girls: an experience from rural area of West Bengal
- 1. IOSR Journal of Dental and Medical Sciences (IOSR-JDMS) e-ISSN: 2279-0853, p-ISSN: 2279-0861.Volume 14, Issue 12 Ver. II (Dec. 2015), PP 06-12 www.iosrjournals.org DOI: 10.9790/0853-141220612 www.iosrjournals.org 6 | Page Eating habits and nutritional status among adolescent school girls: an experience from rural area of West Bengal Dr. Manisha Sarkar1 , Dr. Nirmalya Manna2 , Dr. Sourav Sinha3 , Dr. Swapnodeep Sarkar1 , Dr. Udit Pradhan1 1 (Junior Resident III, Department of Community Medicine, Medical College, Kolkata, India) 2 (Assistant Professor, Department of Community Medicine, Medical College, Kolkata, India) 3 (Junior Resident II, Department of Radiotherapy, Medical College, Kolkata, India) Background: Dietary habits are one of the modifiable risk factors for nutrition related health problems during adolescence. Objective: The study was conducted to assess the eating habits and nutritional status of adolescent rural school girls and to determine the association between nutritional status with eating habits and socio-demographic characteristics. Materials and methods: A cross-sectional study was conducted among 150 adolescent girls of Champadanga Bijoy Krishna Balika Vidyalaya, Tarakeswar block, Hooghly District, West Bengal, from January 2014 to June 2014 with the help of a predesigned and pretested questionnaire. Information were collected regarding socio- demographic features and main eating habits from 10-19 years girls who were willing to participate and had no history of chronic illnesses like heart diseases, asthma, physically handicapped etc. Height and weight measurements were done by standard techniques and BMI was calculated using WHO Anthroplus software. BMI & Height for age were taken as a key indicator to assess their nutritional status. Data was analyzed by proportions, mean ± SD and χ2 test. Results: Mean age was 13.33 ± 1.09 years. Prevalence of thinness, overweight or obesity and stunting were 16%, 11.4% and 20.7% respectively. Significant association was found between different age groups, consumption of roots & tubers, cereals, puffed rice, green non leafy vegetables, fatty foods, eating at fast food centre, skipping of meals, going hungry, physical activity, number of classes on healthy eating, trying to change their weight with the nutritional status of adolescent girls. Conclusion: There is a need to increase more nutritional counseling on healthy eating habits in school and thus to take appropriate interventions to improve the nutritional status of adolescent girls. Keywords: Adolescent girls, eating habits, nutritional status, stunting, thinness I. Introduction WHO identifies adolescence as the period in human growth and development that occurs after childhood and before adulthood, from ages 10 to 19 years.1 Today there are 1.2 billion adolescents, worldwide. Nearly 90 per cent live in developing countries. Adolescents make up about 18 % of the world's population. More than half of all adolescents live in Asia. In absolute numbers, India is home to more adolescents – around 243 million – than any other country.2 Many life style factors and poor eating habits acquired during adolescence can lead to serious diseases later in life. Healthy eating behaviour during adolescence is a fundamental prerequisite for physical growth, psychosocial development and cognitive performance, as well as for the prevention of diet-related chronic diseases in adulthood.3 The children in developing countries presently suffer from the double jeopardy of malnutrition - urban children are afflicted with problems of over-nutrition while rural and slum children suffer from effects of under-nutrition.4 Although the prevalence of obesity is increasing worldwide, the increase has been faster in developing countries because of declining level of physical activity as well as nutrition transition characterized by a trend towards consumption of a diet high in fat, sugar and refined foods and low in fiber.5,6 The girls in the developing countries are usually married at an early age and subsequently exposed to greater risk of morbidity and mortality. In general adolescent girls are the worst sufferers of the ravages of various forms of malnutrition because of their increased nutritional needs and low social power.7 The undernourished adolescent girls thus initiate the vicious cycles of malnutrition by transmitting it to future generations. Dietary habits are one of the modifiable risk factor for both over and under nutrition. Despite the availability of reports from developing countries showing the influence of eating patterns on the escalating prevalence of obesity,8 little is known about this relationship of eating habits and nutritional status among the adolescents in the rural school based settings of West Bengal. Given that prevention is the best way to deal with nutrition related health problems, there is a need to understand eating patterns and habits among adolescent school girls before instituting effective intervention measures by means of school-based nutritional and health educational
- 2. Eating habits and nutritional status among adolescent school girls: an experience from rural area… DOI: 10.9790/0853-141220612 www.iosrjournals.org 7 | Page programmes. With this background, the present study was undertaken with the objective to assess the eating habits and nutritional status of adolescent rural school girls and to determine the association between nutritional status with eating habits and socio-demographic characteristics. Such data are essential for dietary counselling by providing a reference for dietary modification to prevent under nutrition, overweight, obesity and associated long term complications. II. Materials and methods A community based cross-sectional observational study was conducted among the adolescent girls of Champadanga Bijoy Krishna Balika Vidyalaya, Tarakeswar block, Hooghly District, West Bengal from January 2014 to June 2014. Permission to conduct the study was obtained from Institutional ethics committee, BMOH, Tarakeswar rural hospital, CMOH, School Inspector and Headmistress of Champadanga Bijoy Krishna Balika Vidyalaya. Though this school had classes from V to XII, however headmistress of the school gave the permission to conduct the study among any class except XI and XII. Classes from V to VII were considered inappropriate to give responses to questionnaire due to intellectual reasons and thus excluded. So, classes VIII, IX and X were ultimately considered for the study. Considering the prevalence of under nutrition among adolescent girls 48.3%, 9 15% allowable error, 95% confidence limits and finite population correction for 620 students, required sample size was 141. Considering 10% non-response rate final sample size thus required was 156. Eligibility criteria were those who were present, age 10-19 years, those willing to participate, not sick and those with no history of chronic illnesses like heart diseases, asthma, mental illness, physically handicapped or disabilities like scoliosis and kyphosis. The class teacher and students were briefed about the study and were interviewed only after obtaining verbal consent. On the day of data collection 161 students were present in these three classes, all fulfilled eligibility criteria. All of them were given questionnaire for self administration, however 3 students did not return the questionnaire and 8 students gave incomplete response. Thus, 150 students could be finally considered for analysis. Data was collected using a pre-designed, pretested semi-structured questionnaire on socio-demographic variables, eating habits and some related factors like frequency of going hungry due to unavailability of foods at home, addiction to smoking/ chewing tobacco, alcohol, class on benefits of healthy eating and eating more fruits and vegetables held during past one year, self-image of body weight, and if anything done to combat, physical activity etc. Translation of questionnaire in Bengali language was done by language experts by forward and backward translation and then finally validated by experts of Department of Community Medicine, Medical College, Kolkata. Height and weight were measured using non stretchable measuring tape, glass scale and weighing machine using the standard techniques by 1st , 3rd, 4th and 5th authors. Height in centimetres was marked on a wall with the help of a measuring tape. All girls were measured against the wall without foot wear and with heels together and their heads positioned so that the line of vision was perpendicular to the body. A glass scale was brought down to the topmost point on the head. The height was recorded to the nearest 1 cm. Height was evaluated using WHO 2007 Reference curve for Height-for-age for girls.10 Weight was measured using a weighing machine with an accuracy of +100 gm. The subjects were asked to remove their footwear before measuring their weight. The scales were recalibrated after each measurement. Accuracy of the weighing scale was verified after 50 such measurements against known weights. BMI of the study subject was calculated by using the WHO Anthroplus software 10 and further categorized as per WHO 2007 BMI-for-age reference curve for girls.10 At the end of the study, after collection of the questionnaire from the students, they were satisfactorily addressed about eating habits, nutritional issues and related queries. Headmistress was also given feedback of the study. Data was analyzed using SPSS-16. For descriptive statistics proportion, mean ± SD were used, while for testing the association between nutritional status and eating habits and other factors chi-square (χ2 ) test was used. Significance level was considered at p value <0.05. III. Results Mean age of the study population was 13.33 ± 1.09 years. All of them were unmarried. Majority (84%) were Hindus. Class 10th (19.3%) students were lesser in number compared to class 8th & 9th . Most (62%) of them belonged to joint family. Very few parents (8.1% father & 8.7% mother) were illiterate / just literate. Majority (98.7%) lived with their parents & most students (95.3%) ate with them. More than three fourths of the girls attained menarche. Mean age at menarche was 12.27 ± 0.85 years. None had addiction to smoking/ chewing tobacco and alcohol. Socio-demographic characteristics of the study population have been shown in Table 1. Frequency of consumption of different food items by the students during last week have been shown in Table 2. It was found that almost half of the participants consumed fruits, vegetables, egg & meat occasionally. Nearly two thirds consumed fruit juices occasionally while one third consumed pulses occasionally. More than three fourths consumed cereals & puffed rice regularly, while 42% had occasional consumption of milk & milk products. Majority of the study population (72.7%) had normal nutritional status according to BMI-for-age,
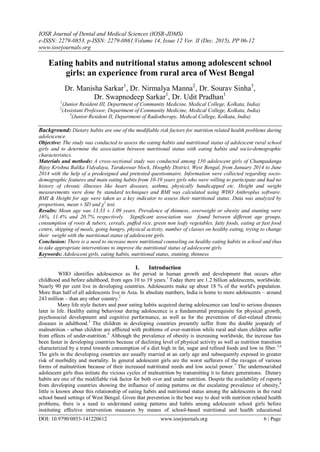
- 3. Eating habits and nutritional status among adolescent school girls: an experience from rural area… DOI: 10.9790/0853-141220612 www.iosrjournals.org 8 | Page 4.7% had severe thinness (< -3SD), 11.3% had thinness (< -2SD), 10.7% were overweight (>1SD) and 0.7% were obese (>2SD). 10 It was also found that 79.3% of the respondents had normal height-for-age, 18% were stunted (< -2SD) and 2.7% were severely stunted (< -3SD).10 The comparison of Height-for-age (z-score) and BMI-for-age (z-score) in study population with WHO reference 2007 curve has been shown in Fig. 1 and Fig. 2 respectively . Both the Z-scores of the study population are skewed compared to WHO 2007 reference curve. The association between nutritional status (based on presence of overall thinness) and socio- demographic features as well as eating habits of study population has been shown in Table 3. It was found that overall thinness was more prevalent in 10-13 years age group (21.1%) compared to 14-19 years age group (8.3%) and this was statistically significant (OR=2.9; CI=1.03-8.38). The prevalence of thinness was higher among those who went hungry due to unavailability of food at home (44.4%) than who did not (12.1%) and this was statistically significant (OR=5.8; CI=2.00-16.85). Similarly the prevalence of thinness was more among those who regularly consumed green non leafy vegetables, cereals and puffed rice (22.2%, 19.8%, and 18.9%) than who occasionally consumed them (10.3%, 2.9% and nil) and these associations were also statistically significant (p=0.046, 0.018 and Yates corrected p=0.049 respectively). It was also found that the prevalence of thinness was more among them who had attended lesser number of classes on healthy eating habits (27.5%), while those who attended more number of classes had lower prevalence of thinness (10.1%). This relationship was statistically significant (p=0.006). The association of nutritional status (based on presence of overweight or obesity) with socio- demographic factors and eating habits of adolescent school girls has been shown in Table 4. It was revealed that the prevalence of overweight or obesity was higher among those who skipped meals (19.3%) than who did not (6.5%). This was statistically significant (OR=3.5; CI=1.21-9.98). It was also found that those who regularly consumed fatty foods, regularly ate at a fast food center, regularly consumed roots and tubers and those who were trying to change their weights had higher prevalence of overweight or obesity (28.6%, 25.5%, 17.5% and 26.7% respectively) than who occasionally consumed them or those who were not trying to change their weight (4.6%, 4.9%, 6.9% and 1.1% respectively). This relationship was statistically significant (p<0.001, p<0.001, p=0.044 and p<0.001respectively). The study also found that the students who attended lesser number of classes on the benefits of healthy eating and who did not do physical activity had higher prevalence of overweight or obesity (19.6% and 27.9% respectively) than those students who attended more number of classes and who did physical activity (7.1% and 4.7% respectively) and these were statistically significant (p=0.022 and p<0.001 respectively). However, there was no association of other independent variables (socio-demographic characteristics, eating habits and other factors) with nutritional status categorized on the basis of overall thinness or overweight or obesity or stunting (data not shown). IV. Tables and figures Table1: Socio- demographic characteristics of the adolescent girls. (n=150) Socio- demographic variables Number (%) Mean ± SD Age in years 10-14 131 (87.3) 13.33 ± 1.0915-19 19 (12.7) Religion Hindu 126 (84.0) Muslim 24(16.0) Class 8th 57 (38) 9th 64(42.7) 10th 29 (19.3) Type of family Nuclear 57 (38) Joint 93 (62) Number of family members 1-4 65 (43.3) 5-6 32 (21.3) ≥7 53 (35.3) Father’s education (n=149) [1 died] Illiterate/ just literate 12 (8.1) Primary 46 (30.9) Secondary 39 (26.2) Higher secondary & above 52 (34.9) Mother’s education Illiterate/ just literate 13 (8.7) Primary 35 (23.3) Secondary 69 (46) Higher secondary & above 33 (22) Living with Parents 148 (98.7) Relatives 2 (1.3) Eat with Parents 143 (95.3) Alone 7 (4.7) Menarche Attained 115 (76.7) 12.27 ± 0.85 Not attained 35 (23.3)
- 4. Eating habits and nutritional status among adolescent school girls: an experience from rural area… DOI: 10.9790/0853-141220612 www.iosrjournals.org 9 | Page Table2: Distribution of study population according to frequency of consumption of different food items during last one week (n=150) Food items Occasionally Regularly Never N (%) 1-3 times N (%) 4-6 times N (%) Daily N (%) Fruits 6 (4.0) 75 (50) 35 (23.3) 34 (22.7) Green leafy vegetables 16 (10.7) 59 (39.3) 37 (24.7) 38 (25.3) Green non leafy vegetables 6 (4.0) 72 (48.0) 38 (25.3) 34 (22.7) Red or yellow coloured vegetables 34 (22.7) 85 (56.7) 20 (13.3) 11 (7.3) Roots and tubers 20 (13.3) 67 (44.7) 11 (7.3) 52 (34.7) Cereals 4 (2.7) 30 (20.0) 6 (4.0) 110 (73.3) Puffed rice 3 (2.0) 20 (13.3) 14 (9.3) 113 (75.3) Pulses 12 (8.0) 39 (26.0) 32 (21.3) 67 (44.7) Milk or milk products 19 (12.7) 44 (29.3) 28 (18.7) 59 (39.3) Fruit juices 43 (28.7) 70 (46.7) 22 (14.7) 15 (10.7) Egg 10 (6.7) 72 (48.0) 42 (28.0) 26 (17.3) Meat 4 (2.7) 64 (42.7) 54 (36.0) 28 (18.7) Carbonated Soft drinks 26 (17.3) 63 (42.0) 31 (20.7) 30 (20.0) Fatty or fried foods 14 (9.3) 77 (51.3) 40 (26.7) 19 (12.7) Salty foods 29 (19.3) 72 (48.0) 33 (22.0) 16 (10.7) Eating at fast food centre 29 (19.3) 80 (53.3) 29 (19.3) 12 (8.0) Table 3: Relationship between nutritional status (overall thinness) Vs socio-demographic factors, eating habits & associated factors Socio-demographic factors, eating habits and other factors Overall Thinness Test statistics Yes N (%) 24 (16.0) No N (%) 126 (84.0) Total N (%) 150 (100) χ2 df p OR 95% CI Age (years) 10-13 19 (21.1) 71 (78.9) 90 (100) 4.37 1 0.037 2.9 (1.03- 8.38)14-19 5 (8.3) 55 (91.7) 60 (100) Going hungry yes 8 (44.4) 10 (55.6) 18 (100) 12.31 1 <0.001 5.8 (2.00- 16.85)No 16 (12.1) 116 (87.9) 132 (100) Consumption of green non leafy vegetables regularly 16 (22.2) 56 (77.8) 72 (100) 3.99 1 0.046 2.5 (1.00- 6.26)occasionally 8 (10.3) 70 (89.7) 78 (100) Consumption of cereals regularly 23 (19.8) 93 (80.2) 116 (100) 5.58 1 0.018 8.2 (1.06- 62.84)occasionally 1 (2.9) 33 (97.1) 34 (100) Consumption of puffed rice regularly 24 (18.9) 103 (81.1) 127 (100) 3.86a 1 0.049 - - occasionally 0 (0) 23 (100) 23 (100) No. of classes on healthy eating ≥2 10 (10.1) 89 (89.9) 99 (100) 7.54 1 0.006 0.3 (0.12- 0.73)≤1 14 (27.5) 37 (72.5) 51 (100) a Fishers Exact significance (2- sided) p = 0.026 Table 4: Relationship between nutritional status (overweight & obesity) Vs eating habits & associated factors Eating habits & associated factors Overweight or Obesity Test statistics Yes N (%) 17 (11.3) No N (%) 133 (88.7) Total N (%) 150 (100) χ2 df p OR 95% CI Skip meals yes 11 (19.3) 46 (80.7) 57 (100) 5.50 1 0.016 3.5 (1.21- 9.98)no 6 (6.5) 87 (93.5) 93 (100) Consumption of fatty foods regularly 12 (28.6) 30 (71.4) 42 (100) 17.25 1 <0.001 8.2 (2.69- 25.25)occasionally 5 (4.6) 103 (95.4) 108 (100) Eating at a fast food centre regularly 12 (25.5) 35 (74.5) 47 (100) 13.73 1 <0.001 6.7 (2.21- 20.44) occasionally 5 (4.9) 98 (95.1) 103 (100) Physical Activity yes 5(4.7) 102 (95.3) 107 (100) 16.48 1 <0.001 0.1 (0.04- 0.39)no 12 (27.9) 31 (72.1) 43 (100) No. of classes on healthy eating ≥2 7 (7.1) 92 (92.9) 99 (100) 5.27 1 0.022 0.3 (0.11- 0.88) ≤1 10 (19.6) 41 (80.4) 51 (100) Consumption of roots & tubers regularly 11 (17.5) 52 (82.5) 63 (100) 4.06 1 0.044 2.9 (0.10- 8.19)occasionally 6 (6.9) 81 (93.1) 87 (100)
- 5. Eating habits and nutritional status among adolescent school girls: an experience from rural area… DOI: 10.9790/0853-141220612 www.iosrjournals.org 10 | Page Trying to change weight yes 16(26.7) 44(73.3) 60 (100) 23.40 1 <0.001 32. 4 (4.16- 252.0)no 1 (1.1) 89 (98.9) 90 (100) Figure:1 Comparison of Height-for-age (z-score) in study population with WHO reference 2007 (5 to 19 years)10 Figure 2: Comparison of BMI-for-age (z-score) in study population and WHO reference 2007 (5 to 19 years)10 V. Discussion A cross-sectional study was conducted among rural adolescent school girls with the purpose to assess their eating habits and nutritional status. Mean age of the respondents in this study was 13.33 ± 1.09 years. Similarly, Dey et al11 found the mean age (years) of rural adolescent school girls as 14.0 ± 1.6. In this study 87.3% of the respondents belonged to early adolescence (10-14 years), while 12.7% belonged to late adolescence (15-19 years) age group. This was inconsistent with Das et al.12 and Kollur et al.13 where 55% belonged to early adolescence (10-14 years) and 45% to late adolescence (15-19 years) age group. This was due to exclusion of class XI and class XII students in the present study, while later studies were done in community and not in school based setting. In the present study majority (84%) of the study population were Hindus and others were Muslim. Similarly Das et al.12 found that most of the respondents (77.6%) were Hindus and the others were Muslims. In the present study 8.7% of mothers and 8.1% of fathers of respondents were illiterate or just literate. However Das et al12 found that 33.6% of mothers and 22.3% of fathers of respondents were illiterate. This is due to differences in study period. This clearly reflected the increase in literacy rate with time. In the present study majority (98.7%) lived with their parents. Similarly, Onyiriuka et al.14 found that majority (84.7%) of the respondents lived with their parents. There was less frequent consumption of fruits, vegetables,
- 6. Eating habits and nutritional status among adolescent school girls: an experience from rural area… DOI: 10.9790/0853-141220612 www.iosrjournals.org 11 | Page pulses, milk or milk products, egg, meat etc among the adolescents of this study. Similarly, Seema Choudhary et al.15 found in their study that daily consumption of body building (viz. pulses and milk) and protective (viz. fruits, green vegetables and other vegetables) foods by an adolescent was practically non-existent in the study area. In fact they found that pulses, vegetables and milk products were avoided by 4.07%, 13.70% and 7.41% study subjects, respectively. In the present study the prevalence of normal BMI for age, overall thinness and overweight or obesity were 72.7%, 16% and 11.4% respectively. Similarly Das et al12 found the prevalence of thinness as 14.7%. This was not consistent with the study done by Kankana De et al.9 where the problem of under-nutrition was worse as the prevalence of normal BMI-for-age, overall thinness and overweight were 50.1%, 48.3% and 1.6% respectively. This difference could be explained on the basis of differences in study area. The present study was conducted among the rural school girls who were present on the day of interview were more likely to be healthy and of better nutritional status compared to the later study which was conducted in a rural hospital. In the present study the prevalence of normal height-for-age and stunting was 79.3% and 20.7% respectively. However Maiti et al.16 found the prevalence of stunting as 34.8%. This difference could be due to the differences in the age groups considered for study and/ or the criteria used for classification of stunting as later study was done among 10-14 years girls using Vishveshwara Rao’s classification for height-for- age. In the present study it was found that the prevalence of overweight or obesity was higher in girls who skipped meals than who did not (OR=3.47, 95% CI =1.21-9.98). This was consistent with the study done by Onyiriuka et al.14 and Niklas et al.17 It was found in the present study that physically inactive girls had higher prevalence of overweight or obesity (27.9%) compared to those who were physically active (χ2 =16.48, df=1, p=<0.001). Similar findings were found by Radmila Jovanovic’et al. 18 (χ2 =4.485, df=1, p=0.034). In this study significant association was found between different age groups, consumption of roots & tubers, cereals, puffed rice, green non leafy vegetables, fatty foods, eating at fast food centre, skipping of meals, going hungry, physical activity, number of classes on healthy eating, trying to change their weight with the nutritional status of adolescent girls. In the present study there was no association between socio-demographic factors like literacy status of parents, religion, and marital status etc. with nutritional status. Similarly Das et al.12 found no significant association (p>0.05) of thinness or stunting with per capita monthly family income and literacy status of parents. However, Singh et al19 found that caste, religion and marital status was significantly (p < 0.05) associated with nutritional status of adolescents. These differences could be because of regional differences as later study was done in rural area of Varanasi where there was one more important category of adolescent girls who were married but gauna did not occur. In this study caste and per capita monthly family income were excluded from questionnaire during pre-testing as the students were not able to answer it, so its impact on nutritional status could not be studied. VI. Conclusion and recommendation The prevalence of overall thinness, overweight or obese and stunting in this study was 16%, 11.4% and 20.7% respectively. There was less frequent consumption of fruits, vegetables, pulses, milk or milk products, egg, meat etc. Nearly one third had regular consumption of fatty, fried & salty foods and regularly ate at fast food centre. The risk factors for thinness were lower age group, going hungry due to unavailability of food at home, attending lesser number of classes on benefits of healthy eating and regular consumption of green non leafy vegetables, cereals and puffed rice. The risk factors for overweight or obesity were skipping of meals, physical inactivity, regularly eating at fast food centre, regular consumption of fatty or fried foods and roots and tubers, trying to change weight and attending lesser number of classes on benefits of healthy eating. The limitations of this study were recall bias, high allowable error (15%), and lack of external validity. Despite of these limitations this study adds information about the influence of eating habits on nutritional status and can be helpful in developing strategies for addressing the nutritional status of adolescent school girls with emphasis on dietary habits which are modifiable. It is thus recommended to increase nutritional counselling on healthy eating habits in school and to initiate intervention measures to improve the nutritional status of adolescent girls. Further, prospective studies might be done on wider geographical area with focus on factors influencing nutritional status of adolescent school girls apart from dietary habits. VII. Acknowledgements Authors acknowledge WHO for WHO Anthroplus software. The support provided by the Headmistress and the class teachers of Champadanga Bijoy Krishna Balika Vidyalaya, Tarakeswar block is also acknowledged. References [1] WHO. Adolescent health. Adolescent development [Internet]. [cited 2015 Nov 26]. Available from: http://www.who.int/maternal_child_adolescent/topics/adolescence/dev/en/.
- 7. Eating habits and nutritional status among adolescent school girls: an experience from rural area… DOI: 10.9790/0853-141220612 www.iosrjournals.org 12 | Page [2] UNICEF. Progress for children A report card on adolescents [Internet]. New York: 2012 Apr [cited 2015 Nov 26]. Available from: http://www.unicef.org/media/files/PFC2012_A_report_card_on_adolescents.pdf. [3] French S a., Lin BH, Guthrie JF. National trends in soft drink consumption among children and adolescents age 6 to 17 years: Prevalence, amounts, and sources, 1977/1978 to 1994/1998. J Am Diet Assoc. 2003; 103(10):1326-31. [4] Chatterjee P. India sees parallel rise in malnutrition and obesity. Lancet. 2002; 360:1948. [5] Monteiro C a, D’A Benicio MH, Conde WL, Popkin BM. Shifting obesity trends in Brazil. Eur J Clin Nutr. 2000;54: 342-6. [6] Popkin BM, Lu B, Zhai F. Understanding the nutrition transition: measuring rapid dietary changes in transitional countries. Public Health Nutr. 2002; 5:947-53. [7] Choudhary Seema, Mishra CP SK. Dietary Pattern and Nutrition Related Knowledge of Rural Adolescent Girls. Indian J Prev Soc Med. 2010; 41(3):208-15. [8] Prentice AM. The emerging epidemic of obesity in developing countries. Int J Epidemiol. 2006; 35:93-9. [9] De Kankana, Das Subal, Bose Kaushik, Chakraborty Raja. Nutritional status of rural Bengalee girls aged 10-18 years of Salboni, Paschim Medinipur, West Bengal, India. Asian Journal of Biological and Life Sciences. 2013; 2 (1): 68-72. [10] Anthroplus WHO, Computers P. WHO AnthroPlus for Personal Computers Manual Software for assessing growth of the world’s children. Geneva: WHO; 2009. [11] Dey I, Biswas R, Ray K, Bhattacherjee S, Chakraborty M, Pal PP. Nutritional status of school going adolescents in a rural block of Darjeeling , West Bengal , India. The Health. 2011;2(3):75–7. [12] Das DK, Biswas R. Nutritional Status of Adolescent Girls in a rural area of North 24 Parganas district, West Bengal. Indian J Public Health. 2005;49(1):18–21. [13] Kollur LR, Pratinidhi AK, Kakade SV. Nutritional status of adolescent girls from a community in Maharashtra – A cross sectional study. Int J Med Sci Public Health 2014;3:951-4. [14] Onyiriuka AN, Umoru DD, Ibeawuchi AN. Weight status and eating habits of adolescent Nigerian urban secondary school girls. SAJCH South African J Child Heal. 2013;7:108-12. [15] Choudhary Seema, Mishra CP SK. Dietary Pattern and Nutrition Related Knowledge of Rural Adolescent Girls. Indian J Prev Soc Med. 2010;41(3):208–15. [16] Maiti S, De D, Chatterjee K, Jana K, Ghosh D. Prevalence of stunting and thinness among early adolescent school girls of paschim medinipur district , west bengal. Int J Biol Med Res. 2011;2(3):781-3. [17] Nicklas TA, Baranowski T, Cullen KW, Berenson G. Eating patterns, dietary quality and obesity. J Am Coll Nutr 2001; 20(6): 599- 608. [18] Jovanovi R, Nikolovski D, Radulovi O, Novak S. The influence of physical activity to nutrition state of pre-school children. Acta Medica Medianae 2010;49(1):17-21. [19] Singh S, Kansal S, Kumar A. Assessment of nutritional status of adolescent girls in rural area of district Varanasi. Indian J Res. 2012;6:30–4.