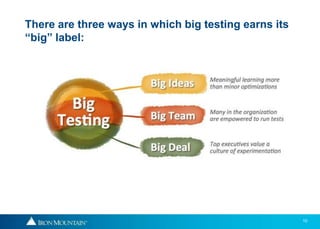
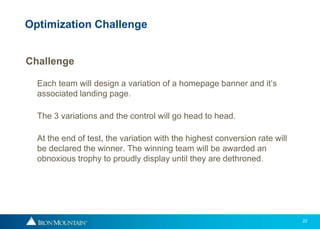
Place image here
Fueling Big Testing with Big Data
Presented by Tom Berger, Director of Digital Marketing
SiriusDecisions 2013
2
The real revolution: from big data to big testing, big
experience
3
Big data
Collect and organize data and wield tools to extract information and insight
from it. This is the part that big data has to offer. But some of the most
valuable output from such data analytics will be mere hypotheses —
interesting correlations of factors and behaviors in ever-more-finely-
sliced customer segments that may have meaningful impact. But
these are only seeds of ideas, possibilities
4
Attract Engage
Convert
Conversion Optimization
Objective: Perpetually optimize webpages to engage users and produce the highest
volume of quality leads at the lowest cost.
Optimization data helps us gain an understanding of what attracts, engages and
converts visitors to sales and sales.
Optimization happens here.
Optimization
starts here.
Optimization happens here.
5
Big testing
Take those hypotheses and be able to quickly and effectively test them to
prove cause-and-effect: that those factors can indeed be leveraged to
influence customer behavior. Empowering many people throughout your
organization to run these tests — and to fearlessly test big ideas — is a
large-scale transformation to organizational behavior and culture that we
can call big testing.
6
7
8
ion software& services
PPC Landing Pages
DemandBase: Targeting, Personalization, Data Append
Optimizely:
IM.com optimization without IT bottlenecks
The Optimization Technology “Trifecta”
9
Big experience
Apply your targeted data and proven tests towards delivering better
customer experiences — through the web, mobile devices, call centers, in-
store and in-person interactions, etc. It’s not just making the same
experience better for everyone. It’s delivering more specialized experiences
to many different customer segments. This mission is big experience.
10
There are three ways in which big testing earns its
“big” label:
11
So much to optimize!
Where do we begin?
12
Dial Movers
 Contact Forms
 Chat
 PPC & Campaign Landing Pages
 High Traffic Pages (Tier 1 Pages, Home
Page)
 SEO Entry pages
Influencers
 Knowledge Center
 Mobile website
 CTAs – Design
 Primary & Secondary Navigation
 Footer Design
STEP 1: Define Optimization Targets
1 2
13
Macro Conversions:
 Contact Sales
 Click to Chat
 Call
 Register for a KC download
 Convert on a campaign landing page
Micro:
 Click a link
 Click a CTA
 Social Shares
 View additional content
 Perform a search
STEP 2: Define Conversions
1 2
CONVERT ENGAGE
14
Discover
 Evaluate current messages, offers,
campaigns and designs
Plan
 Determine execution strategy and goals
 Document roadmap (Key milestones
dependencies, dates)
Execute
 Design using 25 point R.E.A.D.Y optimization
framework
 Code & Deploy
Analyze
 Evaluate traffic and source performance
 Determine areas of opportunity
Repeat
STEP 3: Create a Playbook for Each
Discover
Plan
ExecuteAnalyze
Repeat
15
Optimization Strategy Matrix
16
BIG IDEAS
17
18
19
20
BIG TEAM
21
First Annual Optimization Challenge
22
Challenge
Each team will design a variation of a homepage banner and it’s
associated landing page.
The 3 variations and the control will go head to head.
At the end of test, the variation with the highest conversion rate will
be declared the winner. The winning team will be awarded an
obnoxious trophy to proudly display until they are dethroned.
Optimization Challenge
23
Teams
1. Shared Services/Axis41
2. The Web Team (minus Tom and Eric)
3. ION Interactive
(Eric will deploy and test all variations)
Optimization Challenge
24
Optimization Challenge
25
Optimization Challenge
Challenge Announced: Today
Designs/Code Due: May 15th
Test Start Date: May 20th
Test End Date: When statistical confidence is reached.
26
BIG DEAL
27
Q1 Optimization Summary
• # of Optimization Tests Performed 23
• Increase in engagement 82%
• Total number of participants 179k
• Increase in form conversion rate 40%
• Sales Form
• +25% increase in traffic
• 23% conversion rate
• 219% YoY increase
28
29
Convert: Yellowpages Landing Page Redesign
Conversion Rate: 1.9% Conversion Rate: 6.74%
+255%
Bounce Rate: 70%Bounce Rate: 97%
-28%
30
12 Fields
Conversion Rate: 25%
In Q1 of 2013, the contact sales
web form generated 5546 MQLs.
A 219% increase over Q1 2012!
Now
162.42%
31
Engage: Videos – Embedded vs Popup
VS
16.8% of visitors
watched the video
48.9% of visitors
watched the video
+191.1%
32
Engage: Articles, Related Links
+16.9%
33
Thank You.
Questions?

Iron Mountain: Fueling Big Testing with Big Data - SiriusDecisions 2013

  • 1.
    Place image here FuelingBig Testing with Big Data Presented by Tom Berger, Director of Digital Marketing SiriusDecisions 2013
  • 2.
    2 The real revolution:from big data to big testing, big experience
  • 3.
    3 Big data Collect andorganize data and wield tools to extract information and insight from it. This is the part that big data has to offer. But some of the most valuable output from such data analytics will be mere hypotheses — interesting correlations of factors and behaviors in ever-more-finely- sliced customer segments that may have meaningful impact. But these are only seeds of ideas, possibilities
  • 4.
    4 Attract Engage Convert Conversion Optimization Objective:Perpetually optimize webpages to engage users and produce the highest volume of quality leads at the lowest cost. Optimization data helps us gain an understanding of what attracts, engages and converts visitors to sales and sales. Optimization happens here. Optimization starts here. Optimization happens here.
  • 5.
    5 Big testing Take thosehypotheses and be able to quickly and effectively test them to prove cause-and-effect: that those factors can indeed be leveraged to influence customer behavior. Empowering many people throughout your organization to run these tests — and to fearlessly test big ideas — is a large-scale transformation to organizational behavior and culture that we can call big testing.
  • 6.
  • 7.
  • 8.
    8 ion software& services PPCLanding Pages DemandBase: Targeting, Personalization, Data Append Optimizely: IM.com optimization without IT bottlenecks The Optimization Technology “Trifecta”
  • 9.
    9 Big experience Apply yourtargeted data and proven tests towards delivering better customer experiences — through the web, mobile devices, call centers, in- store and in-person interactions, etc. It’s not just making the same experience better for everyone. It’s delivering more specialized experiences to many different customer segments. This mission is big experience.
  • 10.
    10 There are threeways in which big testing earns its “big” label:
  • 11.
    11 So much tooptimize! Where do we begin?
  • 12.
    12 Dial Movers  ContactForms  Chat  PPC & Campaign Landing Pages  High Traffic Pages (Tier 1 Pages, Home Page)  SEO Entry pages Influencers  Knowledge Center  Mobile website  CTAs – Design  Primary & Secondary Navigation  Footer Design STEP 1: Define Optimization Targets 1 2
  • 13.
    13 Macro Conversions:  ContactSales  Click to Chat  Call  Register for a KC download  Convert on a campaign landing page Micro:  Click a link  Click a CTA  Social Shares  View additional content  Perform a search STEP 2: Define Conversions 1 2 CONVERT ENGAGE
  • 14.
    14 Discover  Evaluate currentmessages, offers, campaigns and designs Plan  Determine execution strategy and goals  Document roadmap (Key milestones dependencies, dates) Execute  Design using 25 point R.E.A.D.Y optimization framework  Code & Deploy Analyze  Evaluate traffic and source performance  Determine areas of opportunity Repeat STEP 3: Create a Playbook for Each Discover Plan ExecuteAnalyze Repeat
  • 15.
  • 16.
  • 17.
  • 18.
  • 19.
  • 20.
  • 21.
  • 22.
    22 Challenge Each team willdesign a variation of a homepage banner and it’s associated landing page. The 3 variations and the control will go head to head. At the end of test, the variation with the highest conversion rate will be declared the winner. The winning team will be awarded an obnoxious trophy to proudly display until they are dethroned. Optimization Challenge
  • 23.
    23 Teams 1. Shared Services/Axis41 2.The Web Team (minus Tom and Eric) 3. ION Interactive (Eric will deploy and test all variations) Optimization Challenge
  • 24.
  • 25.
    25 Optimization Challenge Challenge Announced:Today Designs/Code Due: May 15th Test Start Date: May 20th Test End Date: When statistical confidence is reached.
  • 26.
  • 27.
    27 Q1 Optimization Summary •# of Optimization Tests Performed 23 • Increase in engagement 82% • Total number of participants 179k • Increase in form conversion rate 40% • Sales Form • +25% increase in traffic • 23% conversion rate • 219% YoY increase
  • 28.
  • 29.
    29 Convert: Yellowpages LandingPage Redesign Conversion Rate: 1.9% Conversion Rate: 6.74% +255% Bounce Rate: 70%Bounce Rate: 97% -28%
  • 30.
    30 12 Fields Conversion Rate:25% In Q1 of 2013, the contact sales web form generated 5546 MQLs. A 219% increase over Q1 2012! Now 162.42%
  • 31.
    31 Engage: Videos –Embedded vs Popup VS 16.8% of visitors watched the video 48.9% of visitors watched the video +191.1%
  • 32.
  • 33.