SlideShare a Scribd company logo
1 of 6
Download to read offline
International Journal of Mathematics and Statistics Invention (IJMSI)
E-ISSN: 2321 – 4767 P-ISSN: 2321 - 4759
www.ijmsi.org Volume 4 Issue 9 || November. 2016 || PP-09-14
www.ijmsi.org 9 | Page
The Current Status of Income Distribution in China the case of
Zhejiang Province
Xinxin Wang, Shengshan Zhao
(School of Economics, Zhejiang University of Finance & Economics,China)
ABSTRACT: The income distribution in China has become much more unequal between rural and urban areas,
coastal regions and inland regions, and different industry sectors. Taken Zhejiang as an example, this paper
studies Zhejiang's current status income distribution and finds that Zhejiang's income gap is relatively low
compared with the national level, and the inomce differences is experiencing an shrinked tendency in recent
years. The results of this study can serve as a useful reference for policy makers in terms of income distribution
reform and achieving economic growth.
KEYWORDS: Income distribution, China, Zhejiang, Theil Index
I. INTRODUCTION
The issue of income inequality in China has attracted world wide attentions. The income distribution in China has
become much more unequal between rural and urban areas, coastal regions and inland regions, and different
industry sectors. For example, in 1990, the income per capita for urban households was 1,516 yuan, which was
1.53 times that of rural households. However, this urban and rural inequality increased to 2.75 in 2014. The Gini
coefficient was only 0.16 before China’s reform and opening up policies were implemented in 1978. According to
the National Bureau of Statistics’ recent report, the Gini coefficient was 0.49 in 2008 and 0.47 in 2014, both of
which crossed the international warning line, which implies that China’s inequality is becoming dangerously
severe.
Zhejiang province, as one of the most developed provinces in China, is always stepped in the forefront of China's
reform and modernization. The reform in the field of income distribution experiences great in Zhejiang. What's
the current status of income distribution in Zhejiang? How about the income gap among different industries,
between urban and rural housheold and in different regions? The following paper tries to answer these questions.
The second part studies Zhejiang's income distribution among different industry sectors, between rural and
urban areas, and in different cities. This is followed by a Theil index of income distribution which investigate the
overall income distribution situation as well as Zhejiang's 11 cities' in the third part. Finally, a discussion of
Zhejiang's income distribution and policy implications are given in the final part.
II. THE INCOME DISTRIBUTION IN ZHEJIANG
2.1 Income gap among different industries
Judging from the annual average wages of employees in different industries of Zhejiang Province, employees in
the financial sector enjoy the highest average pay during 2005-2014 while those in lodging & catering industries
obtain the lowest average pay. The absolute income difference between industries with the highest and lowest
incomes is gradually widening. As illustrated by Table 1 which shows the average income of urban employees in
Zhejiang Province, the average income difference between financial sector and lodging & catering industries is
35,000 yuan in 2005. That number rose to 73,500 yuan in 2010 and 90,100 yuan in 2014. Nevertheless, the ratio
between income differences is shrinking: in 2010 the annual average income of the industry with the highest
salary is 3.98 times as much as that of the industry with the lowest salary, while in 2014 that ratio lowered to 3.24.
In addition, compared to the national level, the income gap between different industries in Zhejiang is relatively
low. Nationally speaking, the financial sector is also the industry with the highest income, while people hired in
farming, forestry, animal husbandry, and fishery industry obtain the lowest incomes. In 2014, the ratio between
the above two is 3.82 in China, higher than that number (3.24) of Zhejiang Province.
Table 1. The annual average wages of employees in different industries of Zhejiang
Industry 2005 2010 2014
Farming, forestry, animal husbandry, and fishery 24,410 34,088 50,469
mining 18,756 28,330 49,626
Manufacturing 16,446 29,671 51,295
Electricity gas and water production and supply i 46,311 77,180 103,547
construction industry 18,837 28,595 46,149
Transportation, warehousing and postal service 29,218 48,359 70,156
Information transmission computer services and 54,870 77,125 114,908
The Current Status of Income Distribution in China the case of Zhejiang Province
www.ijmsi.org 10 | Page
software
Wholesale and Retail Trade 26,150 39,901 60,533
Lodging & catering 15,973 24,679 40,210
Financial sector 50,972 98,135 130,337
Real estate 29,200 42,290 61,529
Leasing and Commerical Service 22,939 32,450 57,268
Scientific research technical services and
geological exploration
37,031 56,621 90,368
Water conservancy environment and public
facilities management
24,368 32,462 50,161
Resideng Services and Other 23,834 35,127 46,508
Education 36,644 63,693 80,038
Health, social security and social wlefare 39,757 62,508 95,067
Culture, Sports and Entertainment 37,564 56,313 78,311
Public Management and Social Organization 44,413 64,667 85,414
Total 25,696 40,640 61,572
Data source: CSMAR database.
2.2 Income gap between urban-rural households
Judging from the disposable incomes per capita, the incomes of urban and rural areas in Zhejiang Province are
gradually increasing: in 2014 the per capita disposable incomes in urban and rural areas reached 19,373 yuan and
40,393 yuan respectively, 1.37 times and 1.96 times as much as the national average. If calculated based on the
constant price of 2002, the per capita disposable income of Zhejiang’s rural area increased by 1.82 times from
2002 to 2014, with an average annual growth rate of 9.01%; the per capita disposable income in urban area
increased by 1.59 times, with an average annual growth rate of 8.26%. Observation into the urban-rural income
gap shows that, since the start of the twenty-first century, the ratio between per capita urban income and per capita
rural income follows the pattern of an inverted “U”. The ratio of per capita urban-rural incomes was 2.37 in 2002.
After that, the urban-rural income gap gradually expanded and rose to 2.71 in 2006. Together with the
advancement of income distribution reform initiated in 200
8, the ratio gradually shrank to 2.28 in 2014 (calculation based on the constant price of 2002 ,see Figure 1).
Figure 1. per capita disposable incomes between urban and rural areas in Zhejiang Province
Data source: National Statistics Bureau. Zhejiang Statistic Yearbook by National Statistics Bureau (2015).
adjusted based on CPI with the constant yuear of 2002. Compared with the other 30 provinces (municipalities or
autonomous regions), Zhejiang has a relatively small difference in terms of urban-rural income distribution. Table
2 reveals the gap in urban-rural disposable incomes which are calculated based on the current prices. Judging from
this, Tianjin enjoys the smallest urban-rural income gap, with the urban-rural income ratio in 2014 at 1.852;
Zhejiang is ranked at the second place, with the ratio in 2014 at 2.0851. The urban-rural income gap in other
provinces are also revealed in Table 2.
1 Note: This ratio is calculated based on the current price; in the above passage that ratio in 2014 is 2.28. This new number is modified
according to the respective CPI number of 2014 in urban and rural areas in Zhejiang Province relative to the data of 2002.
The Current Status of Income Distribution in China the case of Zhejiang Province
www.ijmsi.org 11 | Page
Table 2. The urban-rural ratio of disposable income in China's 31 province
No. Region 2013 year 2014 year
1 Tian Jin 1.888 1.852
2 Zhejiang 2.120 2.085
3 Ji Lin 2.181 2.154
4 Hei Longjiang 2.225 2.163
5 Hu Bei 2.339 2.291
6 Jiang Su 2.336 2.296
7 Shang Hai 2.336 2.305
8 He Bei 2.419 2.370
9 He Nan 2.424 2.375
10 Jiang Xi 2.434 2.403
11 Fu Jian 2.470 2.429
12 Shan Dong 2.515 2.459
13 Hai Nan 2.546 2.470
14 An Hui 2.575 2.505
15 Bei Jing 2.606 2.572
16 Si Chuan 2.652 2.593
17 Liao Ning 2.627 2.599
18 Guang Dong 2.669 2.625
19 Hu Nan 2.697 2.641
20 Chong Qing 2.715 2.650
21 Xin Jiang 2.688 2.661
22 Shan(山) Xi 2.800 2.732
23 Ning Xia 2.826 2.769
24 Guang Xi 2.911 2.841
25 Inner Mongolia 2.894 2.842
26 Tibet 3.112 2.992
27 Qing Hai 3.150 3.063
28 Shan(陕) Xi 3.151 3.072
29 Yun Nan 3.340 3.259
30 Gui Zhou 3.487 3.380
31 Gan Su 3.556 3.474
Data source: Author calculated based on the data in China Statistic Yearbook by National Statistics Bureau(2015).
China Statistics Press
Further observation into the urban-rural income ratio in the 11 prefecture-level cities of Zhejiang Province
indicates that the ratios of urban-rural disposable incomes in Ningbo, Jiaxing, Huzhou, and Zhoushan are all
below 2.0, far lower than the national average. In 2014, that ratio in these four cities are 1.991, 1.870, 1.904, and
1.909 respectively. Relatively speaking, Lishui and Jinhua have the largest urban-rural income gaps, with their
urban-rural income ratio at 2.442 and 2.350 (Table 3).
Table 3. the ratio between urban-rural income in Zhejiang's 11 cities(2002-2014)
region/year 2002 2003 2004 2005 2006 2007 2008 2009 2010 2011 2012 2013 2014
Zhejiang
Province
2.372 2.407 2.590 2.640 2.681 2.706 2.694 2.672 2.615 2.574 2.584 2.312 2.283
Hangzhou 2.063 2.047 2.275 2.340 2.406 2.469 2.474 2.469 2.461 2.311 2.284 2.266 2.075
Ningbo 2.250 1.857 2.049 2.403 2.395 2.413 2.426 2.352 2.285 2.257 2.242 2.213 1.991
Wenzhou 2.866 2.867 3.102 3.122 3.100 3.038 3.034 3.014 2.952 2.605 2.575 2.549 2.287
Jiangxin 2.080 1.558 1.628 2.181 2.145 2.058 2.015 1.947 2.067 2.050 2.085 2.074 1.870
Huzhou 2.254 1.719 1.792 2.304 2.262 2.285 2.228 2.150 2.092 2.074 2.089 2.074 1.904
Shaoxing 2.065 1.731 2.019 2.426 2.396 2.427 2.357 2.296 2.322 2.279 2.269 2.249 2.008
Jinhua 2.710 2.740 3.009 3.010 3.124 3.097 2.843 2.766 2.651 2.719 2.717 2.686 2.350
Quzhou 2.595 2.512 2.822 2.893 2.922 2.935 2.898 2.894 2.902 2.808 2.665 2.642 2.181
Zhoushan 2.358 1.934 2.394 2.330 2.346 2.318 2.276 2.148 2.099 1.995 2.003 1.996 1.909
Taizhou 2.378 2.519 2.911 2.954 2.916 2.903 2.891 2.811 2.600 2.527 2.539 2.505 2.249
Lishui 3.391 3.517 3.887 3.880 4.579 4.623 3.849 3.895 3.486 3.254 3.234 3.160 2.442
Data source: Author calculated based on the data in Zhejiang Statistic Yearbookby National Statistics
Bureau(2015). China Statistics Press
2.3 Income gap in different regions
In terms of residents’ per capita disposable incomes, every prefecture-level city of Zhejiang Province has
witnessed an evident rise since the 21st century. Except Quzhou and Lishui, the gap between different regions of
Zhejiang Province proves to be insignificant (Figure 2.4). For example, in 2015 Hangzhou and Ningbo boast the
highest per capita disposable incomes, which are 48,316 yuan and 47,852 yuan respectively; while Lishui and
Quzhou have the lowest per capita disposable incomes, which are 32,875 yuan and 33,212 yuan respectively.
The Current Status of Income Distribution in China the case of Zhejiang Province
www.ijmsi.org 12 | Page
Table 4. The disposable income per capita in Zhejiang's 11 cities.Unit:Yuan
Region/year 2002 2005 2011 2012 2013 2014 2015
Hangzhou 11,778 16,601 32,434 35,704 39,310 44,632 48,316
Ningbo 12,970 17,394 34,321 38,043 41,657 44,155 47,852
Wenzhou 14,591 19,805 31,749 34,820 37,852 40,510 44,026
Jiangxin 11,504 16,189 31,520 35,696 39,087 42,143 45,499
Huzhou 11,388 15,561 29,367 32,987 36,220 38,959 42,238
Shaoxing 11,749 17,319 33,273 36,911 40,454 43,167 46,747
Jinhua 11,264 15,387 29,729 33,164 36,423 39,807 43,193
Quzhou 9,330 13,006 24,900 26,232 28,883 30,583 33,212
Zhoushan 10,985 15,524 30,496 34,224 37,646 41,466 44,845
Taizhou 11,817 18,313 30,490 33,979 37,038 39,763 43,266
Lishui 9,901 12,846 23,391 26,309 29,045 30,413 32,875
Data source: National Statistics Bureau. Zhejiang Statistic Yearbook(2015). China Statistics Press.
III. THE ASSESSMENT OF ZHEJIANG'S INCOME INEQUALITY
Many indexes can be used to assess income inequality. Among them, Theil Index is relatively sensitive to the
income fluctuation of high-income groups and low-income groups. Besides, the urban-rural income gap in China
mainly reflects income changes at both ends (Cao Yu, et al., 2010). Hence, this research adopts Theil Index to
analyze the income distribution gap between different regions. Theil Index can be illustrated by the following
formula (1):
2
, , , , , ,
1 , ,,
ln
i j t i j t i j t
it
j i t i ti t
p p z
T L
p zp
   
    
    
 (1)
In the above formula, t denotes “year”, and i refers to “region” whose valve ranges from 1 to 11 signifying the 11
prefecture-level cities; j refers to urban/rural regions, with j=1 signifying urban region and j=2 signifying rural
region. pij denotes the total income of urban area (j=1) and rural area (j=2) in region i, which is calculated by the
product of population×per capita income; and pi refers to the total income of region i. zij signifies the urban (j=1)
or rural (j=2) population in region i, and zi signifies the total population of region i. The lower Theil Index
becomes, the smaller the income gap is.Considering the CPI difference in different years and in urban/rural
regions, the writer has adjusted the data concerning residents’ per capita disposable incomes. With the year 2002
as the basis, the CPI of urban and rural areas has been correspondingly modified. After this modification, the
changing trend of Theil Index which can reflect the urban-rural gap in Zhejiang Province is illustrated in Figure 2.
From this figure, it can be observed that this trend, in consistency with the ratio of urban/rural per capita
disposable incomes, takes on an inverted “U” pattern.
Figure 2. The Income gap tendency with Theil Index in Zhejiang(2002-2014)
Data source: By authors
In terms of the income distribution in different regions, cities like Jiaxing, Huzhou and Zhoushan have the lowest
income gap, with their Theil Index at 0.041, 0.044 and 0.045 respectively; while Jinhua and Lishui have the largest
income gap, with their Theil Index at 0.073 and 0.070.
The Current Status of Income Distribution in China the case of Zhejiang Province
www.ijmsi.org 13 | Page
Table 5.The Theil Index in Zhejiang's 11 cities(2002-2014)
Region/year 2002 2003 2004 2005 2006 2007 2008 2009 2010 2011 2012 2013 2014
Zhejiang
Province
0.085 0.091 0.099 0.104 0.109 0.111 0.109 0.108 0.104 0.100 0.101 0.077 0.075
Hangzhou 0.065 0.064 0.074 0.079 0.084 0.087 0.084 0.083 0.082 0.070 0.067 0.065 0.051
Ningbo 0.080 0.046 0.056 0.087 0.086 0.087 0.087 0.082 0.077 0.074 0.072 0.070 0.051
Wenzhou 0.076 0.122 0.132 0.136 0.135 0.129 0.128 0.128 0.124 0.093 0.090 0.087 0.066
Jiangxin 0.061 0.023 0.024 0.068 0.065 0.057 0.053 0.048 0.058 0.056 0.058 0.057 0.041
Huzhou 0.079 0.035 0.034 0.077 0.074 0.075 0.069 0.064 0.059 0.058 0.059 0.058 0.044
Shaoxing 0.055 0.033 0.051 0.087 0.085 0.087 0.081 0.077 0.080 0.076 0.075 0.073 0.053
Jinhua 0.108 0.114 0.128 0.129 0.140 0.137 0.114 0.109 0.101 0.106 0.105 0.102 0.073
Quzhou 0.091 0.085 0.101 0.109 0.119 0.119 0.115 0.117 0.118 0.110 0.097 0.096 0.058
Zhoushan 0.091 0.054 0.086 0.081 0.082 0.079 0.075 0.065 0.061 0.052 0.053 0.052 0.045
Taizhou 0.073 0.086 0.109 0.114 0.111 0.110 0.108 0.103 0.086 0.080 0.081 0.078 0.059
Lishui 0.153 0.167 0.185 0.188 0.248 0.250 0.186 0.192 0.158 0.139 0.135 0.128 0.070
Data source: By authors
IV. DISCUSSION AND POLICY IMPLICATIONS
This paper studies Zhejiang's current status income distribution among different industries, between urban and
rural housheold and in different cities. Mainly, we can get the following conclusions of Zhejiang's income
distribution. First, compared with the national level, Zhejiang's income gap is relatively low and the inomce
differences is experiencing an shrinked tendency in recent years. Second, the absolute income gap in different
industries sectors are large, but the ratio between income differences in various sectors is shrinking. In addition,
compared with other 30 provinces in China, the income equality in Zhejiang exhibits very well with a much lower
urban-rural income gap. Third, the income gap in different cities of Zhejiang is not large. Among the 11 cities, the
income inequality of Jinhua and Lishui is the largest.
The history experiences shows that the economic growth and economic inequality would exhibit an reverse "U"
shape (Kuznets, 1955). Zhejiang, with the GDP per capita at US.$ 6047.82(2005 as constant year, World
Bank,2014) in 2014, is experiencing an increasing economic growth and decreasing income inequality. However,
the income inequality would not be decreased automatically by the market. Further reform on helping reducing the
income inequality should be taken as the the high and rising inequality would dampen domestic consumption and
generate pressures on the exports(Wang,et al, 2014). Current, the whole China's economic growth is experiecing
an decreasing economic growth rate and it is imporatant to stimulate the domestic consumption in the content of
global weak consuption. The reform of China's strict household registration system should be taken to help
increase the urbanizaition rate and further increase the initial income distribution for the people who stay and live
in the urban areas but without "hukou".
ACKNOWLEDGE
We would like to acknowledge the support from Zhejiang Philosophy and Social Science Planning Project
(14NDJC096YB), Zhejiang Major Project in Humanities and Social Science Research Projects (2013QN046),
Natural Science Foundation of China (71403236) and Natural Science Foundation of Zhejiang (LY17G030023).
REFERENCES
[1] Adelman, I., & Robinson, S. (1988)."Macroeconomic Adjustment and Income Distribution: Alternative Models Applied to Two
Economies". Journal of Development Economics, , 29(1): 23-44.
[2] ALI, I. (2007). "Inequality and the Imperative for Inclusive Growth in Asia." Asian Development Review 24 (2): 1-16.
[3] Bishop, J. A., Formby, J. P., & Smith, W. J. (1997). "Demographic Change and Income Inequality in the United States, 1976-1989".
Southern Economic Journal, 64(1):33-44.
[4] Boccanfuso, D. and B. Decaluwé, et al. (2008). "Poverty, income distribution and CGE micro-simulation modeling: Does the
functional form of distribution matter?" Journal of Economic Inequality(6): 149-184.
[5] Boccanfuso, D., Decaluwé, B., & Savard, L. (2008)."Poverty, Income Distribution and CGE Micro-Simulation Modeling: Does the
Functional Form of Distribution Matter?". Journal of Economic Inequality, (6): 149-184.
[6] Bourguignon, F., de Melo, J., & Morrisson, C. (1991)."Poverty and Income Distribution during Adjustment: Issues and Evidence from
the OECD Project". World Development, 19(11):1485-1508.
[7] Bussolo, M. and R. E. De Hoyos, et al. (2008). "Economic Growth and Income Distribution: Linking Macroeconomic Models with
Household Survey Data at the Global Level". 30th General Conference of The International Association for Research in Income
and Wealth. Portoroz, Slovenia.
[8] Cai, H., Y. Chen, & Zhou L., (2010)."Income and Consumption Inequality in Urban China: 1992-2003. Economic Development and
Cultural Change".58(3):385-413.
[9] Cogneau, D., & A.-S. Robilliard.(2000). "Income Distribution, Poverty and Growth in Madagascar: Micro Simulations in a General
Equilibrium Framework". IFPRI TMD Discussion Paper 61, International Food Policy Research Institute, Washington, DC. 2000.
[10] Cororaton C. "Analysis of Trade, Income Inequality and Poverty: Using Micro-Simulation Approach, the Case of The Phillipines",
Discussion Paper, 2003, 2003-09, Philippine Institute for Development Studies.
[11] De La Croix , David and Matthias Doepke, (2004). "Inequality and Growth:Why Differential Fertility Matters". American Economic
Review ,93 (4): 1091-1113.
The Current Status of Income Distribution in China the case of Zhejiang Province
www.ijmsi.org 14 | Page
[12] Deaton, A., & Paxon, C. (1994). "Intertemporal Choice and Inequality". Journal of Political Economy. 102(3):437-467
[13] Ghosh, Sugata and Sarmistha Pal, (2004). "The Effect of Inequality on Growth : Theory and Evidence from the Indian States".
Review of Development Economics, 8(1):164-177.
[14] Kuznets, S., (1955)."Economic Growth and Economic Inequality", American Economic Review, 45(1):1-28
[15] Lu, M., Chen,Z.,and Wan, G.(2005) "For the Sake of Growth: The Nexus of Inequality, Investment, Education and Growth in China".
Economic research(Chinese),2005(12): 4-14.
[16] Luo, X. and N. Zhu (2008). "Rising Income Inequality in China:A Race to the Top." Policy Research Working Paper 4700.
[17] National Statistics Bureau.(2015). "China's Statistical Yearbook". China Statistics Press,China.
[18] National Statistics Bureau.(2015). "Zhejiang's Statistical Yearbook". China Statistics Press,China.
[19] Pat ridge, Mark D.,(1997)."Is Inequality Harmful for G rowth ? Comment,". American Economic Review , 87:1019 -1032.
[20] Qu, Z. and Z. Zhao (2008). "Urban-Rural Consumption Inequality in China from 1988 to 2002: Evidence from Quantile Regression
Decomposition." IZA DP No. 3659.
[21] Savard, L., Poverty and Income Distribution in a CGE-Household Micro-Simulation Model: Top-Down/Bottom up Approach. Cahier
de recherche/Working Paper 03-43, 2003.
[22] Shi, X., Terry S., & Y. Zhao. "Analyzing Urban-Rural Income Inequality in China". Paper presented at the International Symposium
on Equity and Social Justice in Transitional China, Beijing, 2002, July 11-12.
[23] Sicular, T. and X. Yue, et al. (2006). "The Urban-Rural Income Gap and Inequality in China." UNU-WIDER Research Paper No.
2006/135.
[24] Sicular, T. and Y. Ximing, et al. (2007). "THE URBAN–RURAL INCOME GAP AND INEQUALITY IN CHINA." Review of
Income and Wealth 53 (1).
[25] Wang, C. and G. Wan, et al. (2014). "INCOME INEQUALITY IN THE PEOPLE'S REPUBLIC OF CHINA: TRENDS,
DETERMINANTS, AND PROPOSED REMEDIES." Journal of Economic Surveys 28 (4): 686-708.
[26] Wang, J., Mayes, D. & WAN, G.(2005)."Income Distribution and Labor Movement in China after WTO membership-- A CGE
analysis". ABERU Discussion Paper 19,2005.
[27] World Bank. (2014)."World Development Indicators. <http://"http://databank.worldbank.org/data/home.aspx>
[28] Xing, C. (2014). "Migration, self-selection and income distributions." Economics of Transition 22 (3): 539-576.

More Related Content

What's hot

Poverty Assessment in Urban Area of Jodhpur District in Western Arid Region o...
Poverty Assessment in Urban Area of Jodhpur District in Western Arid Region o...Poverty Assessment in Urban Area of Jodhpur District in Western Arid Region o...
Poverty Assessment in Urban Area of Jodhpur District in Western Arid Region o...IJAEMSJORNAL
 
A Study of Agricultural Labour Markets in India
A Study of Agricultural Labour Markets in IndiaA Study of Agricultural Labour Markets in India
A Study of Agricultural Labour Markets in IndiaFarnazSha2
 
Housing Affordability in Metro Atlanta: It's Complicated
Housing Affordability in Metro Atlanta: It's ComplicatedHousing Affordability in Metro Atlanta: It's Complicated
Housing Affordability in Metro Atlanta: It's ComplicatedARCResearch
 
Internal Migration and Economic Development of Smart Cities
Internal Migration and Economic Development of Smart CitiesInternal Migration and Economic Development of Smart Cities
Internal Migration and Economic Development of Smart CitiesIRJET Journal
 
OECD Regional Outlook 2016 and related research
OECD Regional Outlook 2016 and related researchOECD Regional Outlook 2016 and related research
OECD Regional Outlook 2016 and related researchOECD Governance
 
Covid 19 Impact on Indian Economy
Covid 19 Impact on Indian EconomyCovid 19 Impact on Indian Economy
Covid 19 Impact on Indian EconomyDheeraj Agarwal
 
Longitudinal Employer-Household Dynamics Origin-Destination Employment Statis...
Longitudinal Employer-Household Dynamics Origin-Destination Employment Statis...Longitudinal Employer-Household Dynamics Origin-Destination Employment Statis...
Longitudinal Employer-Household Dynamics Origin-Destination Employment Statis...MVRPC
 
RURAL-URBAN MIGRATION AND URBAN INFORMAL SECTOR IN INDIA: AN INTER-STATE ANAL...
RURAL-URBAN MIGRATION AND URBAN INFORMAL SECTOR IN INDIA: AN INTER-STATE ANAL...RURAL-URBAN MIGRATION AND URBAN INFORMAL SECTOR IN INDIA: AN INTER-STATE ANAL...
RURAL-URBAN MIGRATION AND URBAN INFORMAL SECTOR IN INDIA: AN INTER-STATE ANAL...Dr Lendy Spires
 
OECD Regional Outlook 2016 - Presentation, Brussels, Belgium 11 October 2016
OECD Regional Outlook 2016 - Presentation, Brussels, Belgium 11 October 2016OECD Regional Outlook 2016 - Presentation, Brussels, Belgium 11 October 2016
OECD Regional Outlook 2016 - Presentation, Brussels, Belgium 11 October 2016OECD Governance
 

What's hot (13)

Poverty Assessment in Urban Area of Jodhpur District in Western Arid Region o...
Poverty Assessment in Urban Area of Jodhpur District in Western Arid Region o...Poverty Assessment in Urban Area of Jodhpur District in Western Arid Region o...
Poverty Assessment in Urban Area of Jodhpur District in Western Arid Region o...
 
A Study of Agricultural Labour Markets in India
A Study of Agricultural Labour Markets in IndiaA Study of Agricultural Labour Markets in India
A Study of Agricultural Labour Markets in India
 
Remittances and Welfare in Pakistan
Remittances and Welfare in PakistanRemittances and Welfare in Pakistan
Remittances and Welfare in Pakistan
 
10320140501003
1032014050100310320140501003
10320140501003
 
Housing Affordability in Metro Atlanta: It's Complicated
Housing Affordability in Metro Atlanta: It's ComplicatedHousing Affordability in Metro Atlanta: It's Complicated
Housing Affordability in Metro Atlanta: It's Complicated
 
Internal Migration and Economic Development of Smart Cities
Internal Migration and Economic Development of Smart CitiesInternal Migration and Economic Development of Smart Cities
Internal Migration and Economic Development of Smart Cities
 
China irg
China irgChina irg
China irg
 
OECD Regional Outlook 2016 and related research
OECD Regional Outlook 2016 and related researchOECD Regional Outlook 2016 and related research
OECD Regional Outlook 2016 and related research
 
Covid 19 Impact on Indian Economy
Covid 19 Impact on Indian EconomyCovid 19 Impact on Indian Economy
Covid 19 Impact on Indian Economy
 
Longitudinal Employer-Household Dynamics Origin-Destination Employment Statis...
Longitudinal Employer-Household Dynamics Origin-Destination Employment Statis...Longitudinal Employer-Household Dynamics Origin-Destination Employment Statis...
Longitudinal Employer-Household Dynamics Origin-Destination Employment Statis...
 
RURAL-URBAN MIGRATION AND URBAN INFORMAL SECTOR IN INDIA: AN INTER-STATE ANAL...
RURAL-URBAN MIGRATION AND URBAN INFORMAL SECTOR IN INDIA: AN INTER-STATE ANAL...RURAL-URBAN MIGRATION AND URBAN INFORMAL SECTOR IN INDIA: AN INTER-STATE ANAL...
RURAL-URBAN MIGRATION AND URBAN INFORMAL SECTOR IN INDIA: AN INTER-STATE ANAL...
 
City Fiscal Conditions in 2013
City Fiscal Conditions in 2013City Fiscal Conditions in 2013
City Fiscal Conditions in 2013
 
OECD Regional Outlook 2016 - Presentation, Brussels, Belgium 11 October 2016
OECD Regional Outlook 2016 - Presentation, Brussels, Belgium 11 October 2016OECD Regional Outlook 2016 - Presentation, Brussels, Belgium 11 October 2016
OECD Regional Outlook 2016 - Presentation, Brussels, Belgium 11 October 2016
 

Viewers also liked

Pw9 - Accueil des clients pour réparation de leur matériel
Pw9 - Accueil des clients pour réparation de leur matérielPw9 - Accueil des clients pour réparation de leur matériel
Pw9 - Accueil des clients pour réparation de leur matérielINTERSPORTLOC
 
2016 実践発表会 (学童クラブなじょも)
2016  実践発表会   (学童クラブなじょも)2016  実践発表会   (学童クラブなじょも)
2016 実践発表会 (学童クラブなじょも)yoshiro ueki
 
Imagenes dicom berenicelozano
Imagenes dicom berenicelozanoImagenes dicom berenicelozano
Imagenes dicom berenicelozanoSann Sóstenes
 
Presentación2.pptx planos
Presentación2.pptx planosPresentación2.pptx planos
Presentación2.pptx planosAlfredo Torres
 
Fluvio bufferblok folder
Fluvio bufferblok folderFluvio bufferblok folder
Fluvio bufferblok folderAnn De Schutter
 
Red zigbee para la monitorización de variables atmosféricas y meteorológicas
Red zigbee para la monitorización de variables atmosféricas y meteorológicasRed zigbee para la monitorización de variables atmosféricas y meteorológicas
Red zigbee para la monitorización de variables atmosféricas y meteorológicasJulián Fernández Ortiz
 
Linea de-el-tiempo gustavo alcala
Linea de-el-tiempo gustavo alcalaLinea de-el-tiempo gustavo alcala
Linea de-el-tiempo gustavo alcalaTavo Hernandez
 
las tecnologías de la información y comunicación (TIC)
las tecnologías de la información y comunicación (TIC)las tecnologías de la información y comunicación (TIC)
las tecnologías de la información y comunicación (TIC)GUSTAVO_08_2011
 

Viewers also liked (20)

Pw9 - Accueil des clients pour réparation de leur matériel
Pw9 - Accueil des clients pour réparation de leur matérielPw9 - Accueil des clients pour réparation de leur matériel
Pw9 - Accueil des clients pour réparation de leur matériel
 
Informatica tp n 6
Informatica tp n 6Informatica tp n 6
Informatica tp n 6
 
2016 実践発表会 (学童クラブなじょも)
2016  実践発表会   (学童クラブなじょも)2016  実践発表会   (学童クラブなじょも)
2016 実践発表会 (学童クラブなじょも)
 
Presentación1
Presentación1Presentación1
Presentación1
 
Imagenes dicom berenicelozano
Imagenes dicom berenicelozanoImagenes dicom berenicelozano
Imagenes dicom berenicelozano
 
Las reseñas
Las reseñas Las reseñas
Las reseñas
 
Leo da vinci
Leo da vinciLeo da vinci
Leo da vinci
 
Aporte individual yeison franco
Aporte individual yeison francoAporte individual yeison franco
Aporte individual yeison franco
 
T15 misw derivada_lf
T15 misw derivada_lfT15 misw derivada_lf
T15 misw derivada_lf
 
Dissertation
DissertationDissertation
Dissertation
 
Presentación2.pptx planos
Presentación2.pptx planosPresentación2.pptx planos
Presentación2.pptx planos
 
Fluvio bufferblok folder
Fluvio bufferblok folderFluvio bufferblok folder
Fluvio bufferblok folder
 
Red zigbee para la monitorización de variables atmosféricas y meteorológicas
Red zigbee para la monitorización de variables atmosféricas y meteorológicasRed zigbee para la monitorización de variables atmosféricas y meteorológicas
Red zigbee para la monitorización de variables atmosféricas y meteorológicas
 
Linea de-el-tiempo gustavo alcala
Linea de-el-tiempo gustavo alcalaLinea de-el-tiempo gustavo alcala
Linea de-el-tiempo gustavo alcala
 
Nr energy
Nr energyNr energy
Nr energy
 
las tecnologías de la información y comunicación (TIC)
las tecnologías de la información y comunicación (TIC)las tecnologías de la información y comunicación (TIC)
las tecnologías de la información y comunicación (TIC)
 
Los angulos
Los angulosLos angulos
Los angulos
 
Presentation 49
Presentation 49Presentation 49
Presentation 49
 
Presentación gustavo
Presentación gustavoPresentación gustavo
Presentación gustavo
 
Proporcionalidad abc
Proporcionalidad abcProporcionalidad abc
Proporcionalidad abc
 

Similar to The Current Status of Income Distribution in China the case of Zhejiang Province

Estimated Regional Disparity for Northern Bangladesh
Estimated Regional Disparity for Northern BangladeshEstimated Regional Disparity for Northern Bangladesh
Estimated Regional Disparity for Northern Bangladeshiosrjce
 
The comparative growth of service sectors in bangladesh
The comparative growth of service sectors in bangladeshThe comparative growth of service sectors in bangladesh
The comparative growth of service sectors in bangladeshAlexander Decker
 
SBI REPORT ON THE K SHAPED RECOVERY ITR_New Trends_Jan24.pdf
SBI REPORT ON THE K SHAPED RECOVERY ITR_New Trends_Jan24.pdfSBI REPORT ON THE K SHAPED RECOVERY ITR_New Trends_Jan24.pdf
SBI REPORT ON THE K SHAPED RECOVERY ITR_New Trends_Jan24.pdfSridharKrishnamurthi1
 
Regional Disparity in India with reference to Liberalization
Regional Disparity in India with reference to LiberalizationRegional Disparity in India with reference to Liberalization
Regional Disparity in India with reference to Liberalizationinventionjournals
 
Regional development policy in OECD countries
Regional development policy in OECD countriesRegional development policy in OECD countries
Regional development policy in OECD countriesOECDregions
 
Applications of the grey prediction model in Urban Residents' Consumption Str...
Applications of the grey prediction model in Urban Residents' Consumption Str...Applications of the grey prediction model in Urban Residents' Consumption Str...
Applications of the grey prediction model in Urban Residents' Consumption Str...IJMREMJournal
 
Measuring Rural-Urban Disparity Toward Promoting Integrated Development Prosp...
Measuring Rural-Urban Disparity Toward Promoting Integrated Development Prosp...Measuring Rural-Urban Disparity Toward Promoting Integrated Development Prosp...
Measuring Rural-Urban Disparity Toward Promoting Integrated Development Prosp...Dr.Choen Krainara
 
Session 6 b uneze's paper, session 6 b
Session 6 b uneze's paper, session 6 bSession 6 b uneze's paper, session 6 b
Session 6 b uneze's paper, session 6 bIARIW 2014
 
Bulletin of Indonesian Economic Studies, Vol. 50, No. 2, 2014.docx
Bulletin of Indonesian Economic Studies, Vol. 50, No. 2, 2014.docxBulletin of Indonesian Economic Studies, Vol. 50, No. 2, 2014.docx
Bulletin of Indonesian Economic Studies, Vol. 50, No. 2, 2014.docxcurwenmichaela
 
International Journal of Business and Management Invention (IJBMI)
International Journal of Business and Management Invention (IJBMI)International Journal of Business and Management Invention (IJBMI)
International Journal of Business and Management Invention (IJBMI)inventionjournals
 
POVERTY REDUCTION STRATEGY PAPER ON SINDH
POVERTY REDUCTION STRATEGY PAPER ON SINDHPOVERTY REDUCTION STRATEGY PAPER ON SINDH
POVERTY REDUCTION STRATEGY PAPER ON SINDHidspak
 
BRICS COUNTRIESppt.pptx
BRICS COUNTRIESppt.pptxBRICS COUNTRIESppt.pptx
BRICS COUNTRIESppt.pptxUmar655059
 
2022 FEBIC_Rima Melati Anggraeni_Fiscal Decentralization and Per Capita Incom...
2022 FEBIC_Rima Melati Anggraeni_Fiscal Decentralization and Per Capita Incom...2022 FEBIC_Rima Melati Anggraeni_Fiscal Decentralization and Per Capita Incom...
2022 FEBIC_Rima Melati Anggraeni_Fiscal Decentralization and Per Capita Incom...RIMAMELATIANGGRAENI
 
Determinants of Poverty in Mkinga, Hanifa Published
Determinants of Poverty in Mkinga, Hanifa PublishedDeterminants of Poverty in Mkinga, Hanifa Published
Determinants of Poverty in Mkinga, Hanifa PublishedDr. Hanifa Mohamed Yusuf
 
India 2017-oecd-economic-survey ppt
India 2017-oecd-economic-survey pptIndia 2017-oecd-economic-survey ppt
India 2017-oecd-economic-survey pptKaran Puri
 

Similar to The Current Status of Income Distribution in China the case of Zhejiang Province (20)

Estimated Regional Disparity for Northern Bangladesh
Estimated Regional Disparity for Northern BangladeshEstimated Regional Disparity for Northern Bangladesh
Estimated Regional Disparity for Northern Bangladesh
 
The comparative growth of service sectors in bangladesh
The comparative growth of service sectors in bangladeshThe comparative growth of service sectors in bangladesh
The comparative growth of service sectors in bangladesh
 
SBI REPORT ON THE K SHAPED RECOVERY ITR_New Trends_Jan24.pdf
SBI REPORT ON THE K SHAPED RECOVERY ITR_New Trends_Jan24.pdfSBI REPORT ON THE K SHAPED RECOVERY ITR_New Trends_Jan24.pdf
SBI REPORT ON THE K SHAPED RECOVERY ITR_New Trends_Jan24.pdf
 
Regional Disparity in India with reference to Liberalization
Regional Disparity in India with reference to LiberalizationRegional Disparity in India with reference to Liberalization
Regional Disparity in India with reference to Liberalization
 
Regional development policy in OECD countries
Regional development policy in OECD countriesRegional development policy in OECD countries
Regional development policy in OECD countries
 
Applications of the grey prediction model in Urban Residents' Consumption Str...
Applications of the grey prediction model in Urban Residents' Consumption Str...Applications of the grey prediction model in Urban Residents' Consumption Str...
Applications of the grey prediction model in Urban Residents' Consumption Str...
 
Measuring Rural-Urban Disparity Toward Promoting Integrated Development Prosp...
Measuring Rural-Urban Disparity Toward Promoting Integrated Development Prosp...Measuring Rural-Urban Disparity Toward Promoting Integrated Development Prosp...
Measuring Rural-Urban Disparity Toward Promoting Integrated Development Prosp...
 
Session 6 b uneze's paper, session 6 b
Session 6 b uneze's paper, session 6 bSession 6 b uneze's paper, session 6 b
Session 6 b uneze's paper, session 6 b
 
Bulletin of Indonesian Economic Studies, Vol. 50, No. 2, 2014.docx
Bulletin of Indonesian Economic Studies, Vol. 50, No. 2, 2014.docxBulletin of Indonesian Economic Studies, Vol. 50, No. 2, 2014.docx
Bulletin of Indonesian Economic Studies, Vol. 50, No. 2, 2014.docx
 
International Journal of Business and Management Invention (IJBMI)
International Journal of Business and Management Invention (IJBMI)International Journal of Business and Management Invention (IJBMI)
International Journal of Business and Management Invention (IJBMI)
 
Rural Area.pdf
Rural Area.pdfRural Area.pdf
Rural Area.pdf
 
POVERTY REDUCTION STRATEGY PAPER ON SINDH
POVERTY REDUCTION STRATEGY PAPER ON SINDHPOVERTY REDUCTION STRATEGY PAPER ON SINDH
POVERTY REDUCTION STRATEGY PAPER ON SINDH
 
BRICS COUNTRIESppt.pptx
BRICS COUNTRIESppt.pptxBRICS COUNTRIESppt.pptx
BRICS COUNTRIESppt.pptx
 
2022 FEBIC_Rima Melati Anggraeni_Fiscal Decentralization and Per Capita Incom...
2022 FEBIC_Rima Melati Anggraeni_Fiscal Decentralization and Per Capita Incom...2022 FEBIC_Rima Melati Anggraeni_Fiscal Decentralization and Per Capita Incom...
2022 FEBIC_Rima Melati Anggraeni_Fiscal Decentralization and Per Capita Incom...
 
Article4 volume4issue22020
Article4 volume4issue22020Article4 volume4issue22020
Article4 volume4issue22020
 
Comparison of Business Environment in the Chosen Regions
Comparison of Business Environment in the Chosen RegionsComparison of Business Environment in the Chosen Regions
Comparison of Business Environment in the Chosen Regions
 
Determinants of Poverty in Mkinga, Hanifa Published
Determinants of Poverty in Mkinga, Hanifa PublishedDeterminants of Poverty in Mkinga, Hanifa Published
Determinants of Poverty in Mkinga, Hanifa Published
 
India 2017-oecd-economic-survey ppt
India 2017-oecd-economic-survey pptIndia 2017-oecd-economic-survey ppt
India 2017-oecd-economic-survey ppt
 
Japan-2015-revitalising-Japan
Japan-2015-revitalising-JapanJapan-2015-revitalising-Japan
Japan-2015-revitalising-Japan
 
Analysis of the Influence of Economic Growth, Poverty, and Education on the S...
Analysis of the Influence of Economic Growth, Poverty, and Education on the S...Analysis of the Influence of Economic Growth, Poverty, and Education on the S...
Analysis of the Influence of Economic Growth, Poverty, and Education on the S...
 

Recently uploaded

Architect Hassan Khalil Portfolio for 2024
Architect Hassan Khalil Portfolio for 2024Architect Hassan Khalil Portfolio for 2024
Architect Hassan Khalil Portfolio for 2024hassan khalil
 
Application of Residue Theorem to evaluate real integrations.pptx
Application of Residue Theorem to evaluate real integrations.pptxApplication of Residue Theorem to evaluate real integrations.pptx
Application of Residue Theorem to evaluate real integrations.pptx959SahilShah
 
Effects of rheological properties on mixing
Effects of rheological properties on mixingEffects of rheological properties on mixing
Effects of rheological properties on mixingviprabot1
 
Oxy acetylene welding presentation note.
Oxy acetylene welding presentation note.Oxy acetylene welding presentation note.
Oxy acetylene welding presentation note.eptoze12
 
Churning of Butter, Factors affecting .
Churning of Butter, Factors affecting  .Churning of Butter, Factors affecting  .
Churning of Butter, Factors affecting .Satyam Kumar
 
GDSC ASEB Gen AI study jams presentation
GDSC ASEB Gen AI study jams presentationGDSC ASEB Gen AI study jams presentation
GDSC ASEB Gen AI study jams presentationGDSCAESB
 
Concrete Mix Design - IS 10262-2019 - .pptx
Concrete Mix Design - IS 10262-2019 - .pptxConcrete Mix Design - IS 10262-2019 - .pptx
Concrete Mix Design - IS 10262-2019 - .pptxKartikeyaDwivedi3
 
complete construction, environmental and economics information of biomass com...
complete construction, environmental and economics information of biomass com...complete construction, environmental and economics information of biomass com...
complete construction, environmental and economics information of biomass com...asadnawaz62
 
Risk Assessment For Installation of Drainage Pipes.pdf
Risk Assessment For Installation of Drainage Pipes.pdfRisk Assessment For Installation of Drainage Pipes.pdf
Risk Assessment For Installation of Drainage Pipes.pdfROCENODodongVILLACER
 
What are the advantages and disadvantages of membrane structures.pptx
What are the advantages and disadvantages of membrane structures.pptxWhat are the advantages and disadvantages of membrane structures.pptx
What are the advantages and disadvantages of membrane structures.pptxwendy cai
 
Gfe Mayur Vihar Call Girls Service WhatsApp -> 9999965857 Available 24x7 ^ De...
Gfe Mayur Vihar Call Girls Service WhatsApp -> 9999965857 Available 24x7 ^ De...Gfe Mayur Vihar Call Girls Service WhatsApp -> 9999965857 Available 24x7 ^ De...
Gfe Mayur Vihar Call Girls Service WhatsApp -> 9999965857 Available 24x7 ^ De...srsj9000
 
UNIT III ANALOG ELECTRONICS (BASIC ELECTRONICS)
UNIT III ANALOG ELECTRONICS (BASIC ELECTRONICS)UNIT III ANALOG ELECTRONICS (BASIC ELECTRONICS)
UNIT III ANALOG ELECTRONICS (BASIC ELECTRONICS)Dr SOUNDIRARAJ N
 
An experimental study in using natural admixture as an alternative for chemic...
An experimental study in using natural admixture as an alternative for chemic...An experimental study in using natural admixture as an alternative for chemic...
An experimental study in using natural admixture as an alternative for chemic...Chandu841456
 
Study on Air-Water & Water-Water Heat Exchange in a Finned Tube Exchanger
Study on Air-Water & Water-Water Heat Exchange in a Finned Tube ExchangerStudy on Air-Water & Water-Water Heat Exchange in a Finned Tube Exchanger
Study on Air-Water & Water-Water Heat Exchange in a Finned Tube ExchangerAnamika Sarkar
 
Sachpazis Costas: Geotechnical Engineering: A student's Perspective Introduction
Sachpazis Costas: Geotechnical Engineering: A student's Perspective IntroductionSachpazis Costas: Geotechnical Engineering: A student's Perspective Introduction
Sachpazis Costas: Geotechnical Engineering: A student's Perspective IntroductionDr.Costas Sachpazis
 
HARMONY IN THE NATURE AND EXISTENCE - Unit-IV
HARMONY IN THE NATURE AND EXISTENCE - Unit-IVHARMONY IN THE NATURE AND EXISTENCE - Unit-IV
HARMONY IN THE NATURE AND EXISTENCE - Unit-IVRajaP95
 
Software and Systems Engineering Standards: Verification and Validation of Sy...
Software and Systems Engineering Standards: Verification and Validation of Sy...Software and Systems Engineering Standards: Verification and Validation of Sy...
Software and Systems Engineering Standards: Verification and Validation of Sy...VICTOR MAESTRE RAMIREZ
 

Recently uploaded (20)

Architect Hassan Khalil Portfolio for 2024
Architect Hassan Khalil Portfolio for 2024Architect Hassan Khalil Portfolio for 2024
Architect Hassan Khalil Portfolio for 2024
 
Application of Residue Theorem to evaluate real integrations.pptx
Application of Residue Theorem to evaluate real integrations.pptxApplication of Residue Theorem to evaluate real integrations.pptx
Application of Residue Theorem to evaluate real integrations.pptx
 
Effects of rheological properties on mixing
Effects of rheological properties on mixingEffects of rheological properties on mixing
Effects of rheological properties on mixing
 
Design and analysis of solar grass cutter.pdf
Design and analysis of solar grass cutter.pdfDesign and analysis of solar grass cutter.pdf
Design and analysis of solar grass cutter.pdf
 
Exploring_Network_Security_with_JA3_by_Rakesh Seal.pptx
Exploring_Network_Security_with_JA3_by_Rakesh Seal.pptxExploring_Network_Security_with_JA3_by_Rakesh Seal.pptx
Exploring_Network_Security_with_JA3_by_Rakesh Seal.pptx
 
Oxy acetylene welding presentation note.
Oxy acetylene welding presentation note.Oxy acetylene welding presentation note.
Oxy acetylene welding presentation note.
 
Churning of Butter, Factors affecting .
Churning of Butter, Factors affecting  .Churning of Butter, Factors affecting  .
Churning of Butter, Factors affecting .
 
GDSC ASEB Gen AI study jams presentation
GDSC ASEB Gen AI study jams presentationGDSC ASEB Gen AI study jams presentation
GDSC ASEB Gen AI study jams presentation
 
POWER SYSTEMS-1 Complete notes examples
POWER SYSTEMS-1 Complete notes  examplesPOWER SYSTEMS-1 Complete notes  examples
POWER SYSTEMS-1 Complete notes examples
 
Concrete Mix Design - IS 10262-2019 - .pptx
Concrete Mix Design - IS 10262-2019 - .pptxConcrete Mix Design - IS 10262-2019 - .pptx
Concrete Mix Design - IS 10262-2019 - .pptx
 
complete construction, environmental and economics information of biomass com...
complete construction, environmental and economics information of biomass com...complete construction, environmental and economics information of biomass com...
complete construction, environmental and economics information of biomass com...
 
Risk Assessment For Installation of Drainage Pipes.pdf
Risk Assessment For Installation of Drainage Pipes.pdfRisk Assessment For Installation of Drainage Pipes.pdf
Risk Assessment For Installation of Drainage Pipes.pdf
 
What are the advantages and disadvantages of membrane structures.pptx
What are the advantages and disadvantages of membrane structures.pptxWhat are the advantages and disadvantages of membrane structures.pptx
What are the advantages and disadvantages of membrane structures.pptx
 
Gfe Mayur Vihar Call Girls Service WhatsApp -> 9999965857 Available 24x7 ^ De...
Gfe Mayur Vihar Call Girls Service WhatsApp -> 9999965857 Available 24x7 ^ De...Gfe Mayur Vihar Call Girls Service WhatsApp -> 9999965857 Available 24x7 ^ De...
Gfe Mayur Vihar Call Girls Service WhatsApp -> 9999965857 Available 24x7 ^ De...
 
UNIT III ANALOG ELECTRONICS (BASIC ELECTRONICS)
UNIT III ANALOG ELECTRONICS (BASIC ELECTRONICS)UNIT III ANALOG ELECTRONICS (BASIC ELECTRONICS)
UNIT III ANALOG ELECTRONICS (BASIC ELECTRONICS)
 
An experimental study in using natural admixture as an alternative for chemic...
An experimental study in using natural admixture as an alternative for chemic...An experimental study in using natural admixture as an alternative for chemic...
An experimental study in using natural admixture as an alternative for chemic...
 
Study on Air-Water & Water-Water Heat Exchange in a Finned Tube Exchanger
Study on Air-Water & Water-Water Heat Exchange in a Finned Tube ExchangerStudy on Air-Water & Water-Water Heat Exchange in a Finned Tube Exchanger
Study on Air-Water & Water-Water Heat Exchange in a Finned Tube Exchanger
 
Sachpazis Costas: Geotechnical Engineering: A student's Perspective Introduction
Sachpazis Costas: Geotechnical Engineering: A student's Perspective IntroductionSachpazis Costas: Geotechnical Engineering: A student's Perspective Introduction
Sachpazis Costas: Geotechnical Engineering: A student's Perspective Introduction
 
HARMONY IN THE NATURE AND EXISTENCE - Unit-IV
HARMONY IN THE NATURE AND EXISTENCE - Unit-IVHARMONY IN THE NATURE AND EXISTENCE - Unit-IV
HARMONY IN THE NATURE AND EXISTENCE - Unit-IV
 
Software and Systems Engineering Standards: Verification and Validation of Sy...
Software and Systems Engineering Standards: Verification and Validation of Sy...Software and Systems Engineering Standards: Verification and Validation of Sy...
Software and Systems Engineering Standards: Verification and Validation of Sy...
 

The Current Status of Income Distribution in China the case of Zhejiang Province

  • 1. International Journal of Mathematics and Statistics Invention (IJMSI) E-ISSN: 2321 – 4767 P-ISSN: 2321 - 4759 www.ijmsi.org Volume 4 Issue 9 || November. 2016 || PP-09-14 www.ijmsi.org 9 | Page The Current Status of Income Distribution in China the case of Zhejiang Province Xinxin Wang, Shengshan Zhao (School of Economics, Zhejiang University of Finance & Economics,China) ABSTRACT: The income distribution in China has become much more unequal between rural and urban areas, coastal regions and inland regions, and different industry sectors. Taken Zhejiang as an example, this paper studies Zhejiang's current status income distribution and finds that Zhejiang's income gap is relatively low compared with the national level, and the inomce differences is experiencing an shrinked tendency in recent years. The results of this study can serve as a useful reference for policy makers in terms of income distribution reform and achieving economic growth. KEYWORDS: Income distribution, China, Zhejiang, Theil Index I. INTRODUCTION The issue of income inequality in China has attracted world wide attentions. The income distribution in China has become much more unequal between rural and urban areas, coastal regions and inland regions, and different industry sectors. For example, in 1990, the income per capita for urban households was 1,516 yuan, which was 1.53 times that of rural households. However, this urban and rural inequality increased to 2.75 in 2014. The Gini coefficient was only 0.16 before China’s reform and opening up policies were implemented in 1978. According to the National Bureau of Statistics’ recent report, the Gini coefficient was 0.49 in 2008 and 0.47 in 2014, both of which crossed the international warning line, which implies that China’s inequality is becoming dangerously severe. Zhejiang province, as one of the most developed provinces in China, is always stepped in the forefront of China's reform and modernization. The reform in the field of income distribution experiences great in Zhejiang. What's the current status of income distribution in Zhejiang? How about the income gap among different industries, between urban and rural housheold and in different regions? The following paper tries to answer these questions. The second part studies Zhejiang's income distribution among different industry sectors, between rural and urban areas, and in different cities. This is followed by a Theil index of income distribution which investigate the overall income distribution situation as well as Zhejiang's 11 cities' in the third part. Finally, a discussion of Zhejiang's income distribution and policy implications are given in the final part. II. THE INCOME DISTRIBUTION IN ZHEJIANG 2.1 Income gap among different industries Judging from the annual average wages of employees in different industries of Zhejiang Province, employees in the financial sector enjoy the highest average pay during 2005-2014 while those in lodging & catering industries obtain the lowest average pay. The absolute income difference between industries with the highest and lowest incomes is gradually widening. As illustrated by Table 1 which shows the average income of urban employees in Zhejiang Province, the average income difference between financial sector and lodging & catering industries is 35,000 yuan in 2005. That number rose to 73,500 yuan in 2010 and 90,100 yuan in 2014. Nevertheless, the ratio between income differences is shrinking: in 2010 the annual average income of the industry with the highest salary is 3.98 times as much as that of the industry with the lowest salary, while in 2014 that ratio lowered to 3.24. In addition, compared to the national level, the income gap between different industries in Zhejiang is relatively low. Nationally speaking, the financial sector is also the industry with the highest income, while people hired in farming, forestry, animal husbandry, and fishery industry obtain the lowest incomes. In 2014, the ratio between the above two is 3.82 in China, higher than that number (3.24) of Zhejiang Province. Table 1. The annual average wages of employees in different industries of Zhejiang Industry 2005 2010 2014 Farming, forestry, animal husbandry, and fishery 24,410 34,088 50,469 mining 18,756 28,330 49,626 Manufacturing 16,446 29,671 51,295 Electricity gas and water production and supply i 46,311 77,180 103,547 construction industry 18,837 28,595 46,149 Transportation, warehousing and postal service 29,218 48,359 70,156 Information transmission computer services and 54,870 77,125 114,908
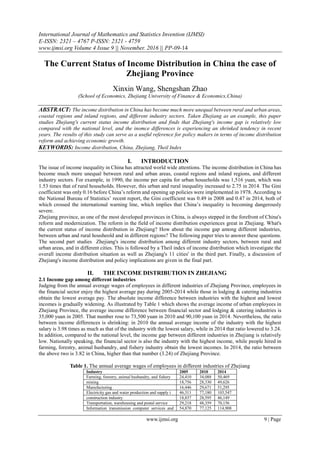
  • 2. The Current Status of Income Distribution in China the case of Zhejiang Province www.ijmsi.org 10 | Page software Wholesale and Retail Trade 26,150 39,901 60,533 Lodging & catering 15,973 24,679 40,210 Financial sector 50,972 98,135 130,337 Real estate 29,200 42,290 61,529 Leasing and Commerical Service 22,939 32,450 57,268 Scientific research technical services and geological exploration 37,031 56,621 90,368 Water conservancy environment and public facilities management 24,368 32,462 50,161 Resideng Services and Other 23,834 35,127 46,508 Education 36,644 63,693 80,038 Health, social security and social wlefare 39,757 62,508 95,067 Culture, Sports and Entertainment 37,564 56,313 78,311 Public Management and Social Organization 44,413 64,667 85,414 Total 25,696 40,640 61,572 Data source: CSMAR database. 2.2 Income gap between urban-rural households Judging from the disposable incomes per capita, the incomes of urban and rural areas in Zhejiang Province are gradually increasing: in 2014 the per capita disposable incomes in urban and rural areas reached 19,373 yuan and 40,393 yuan respectively, 1.37 times and 1.96 times as much as the national average. If calculated based on the constant price of 2002, the per capita disposable income of Zhejiang’s rural area increased by 1.82 times from 2002 to 2014, with an average annual growth rate of 9.01%; the per capita disposable income in urban area increased by 1.59 times, with an average annual growth rate of 8.26%. Observation into the urban-rural income gap shows that, since the start of the twenty-first century, the ratio between per capita urban income and per capita rural income follows the pattern of an inverted “U”. The ratio of per capita urban-rural incomes was 2.37 in 2002. After that, the urban-rural income gap gradually expanded and rose to 2.71 in 2006. Together with the advancement of income distribution reform initiated in 200 8, the ratio gradually shrank to 2.28 in 2014 (calculation based on the constant price of 2002 ,see Figure 1). Figure 1. per capita disposable incomes between urban and rural areas in Zhejiang Province Data source: National Statistics Bureau. Zhejiang Statistic Yearbook by National Statistics Bureau (2015). adjusted based on CPI with the constant yuear of 2002. Compared with the other 30 provinces (municipalities or autonomous regions), Zhejiang has a relatively small difference in terms of urban-rural income distribution. Table 2 reveals the gap in urban-rural disposable incomes which are calculated based on the current prices. Judging from this, Tianjin enjoys the smallest urban-rural income gap, with the urban-rural income ratio in 2014 at 1.852; Zhejiang is ranked at the second place, with the ratio in 2014 at 2.0851. The urban-rural income gap in other provinces are also revealed in Table 2. 1 Note: This ratio is calculated based on the current price; in the above passage that ratio in 2014 is 2.28. This new number is modified according to the respective CPI number of 2014 in urban and rural areas in Zhejiang Province relative to the data of 2002.
  • 3. The Current Status of Income Distribution in China the case of Zhejiang Province www.ijmsi.org 11 | Page Table 2. The urban-rural ratio of disposable income in China's 31 province No. Region 2013 year 2014 year 1 Tian Jin 1.888 1.852 2 Zhejiang 2.120 2.085 3 Ji Lin 2.181 2.154 4 Hei Longjiang 2.225 2.163 5 Hu Bei 2.339 2.291 6 Jiang Su 2.336 2.296 7 Shang Hai 2.336 2.305 8 He Bei 2.419 2.370 9 He Nan 2.424 2.375 10 Jiang Xi 2.434 2.403 11 Fu Jian 2.470 2.429 12 Shan Dong 2.515 2.459 13 Hai Nan 2.546 2.470 14 An Hui 2.575 2.505 15 Bei Jing 2.606 2.572 16 Si Chuan 2.652 2.593 17 Liao Ning 2.627 2.599 18 Guang Dong 2.669 2.625 19 Hu Nan 2.697 2.641 20 Chong Qing 2.715 2.650 21 Xin Jiang 2.688 2.661 22 Shan(山) Xi 2.800 2.732 23 Ning Xia 2.826 2.769 24 Guang Xi 2.911 2.841 25 Inner Mongolia 2.894 2.842 26 Tibet 3.112 2.992 27 Qing Hai 3.150 3.063 28 Shan(陕) Xi 3.151 3.072 29 Yun Nan 3.340 3.259 30 Gui Zhou 3.487 3.380 31 Gan Su 3.556 3.474 Data source: Author calculated based on the data in China Statistic Yearbook by National Statistics Bureau(2015). China Statistics Press Further observation into the urban-rural income ratio in the 11 prefecture-level cities of Zhejiang Province indicates that the ratios of urban-rural disposable incomes in Ningbo, Jiaxing, Huzhou, and Zhoushan are all below 2.0, far lower than the national average. In 2014, that ratio in these four cities are 1.991, 1.870, 1.904, and 1.909 respectively. Relatively speaking, Lishui and Jinhua have the largest urban-rural income gaps, with their urban-rural income ratio at 2.442 and 2.350 (Table 3). Table 3. the ratio between urban-rural income in Zhejiang's 11 cities(2002-2014) region/year 2002 2003 2004 2005 2006 2007 2008 2009 2010 2011 2012 2013 2014 Zhejiang Province 2.372 2.407 2.590 2.640 2.681 2.706 2.694 2.672 2.615 2.574 2.584 2.312 2.283 Hangzhou 2.063 2.047 2.275 2.340 2.406 2.469 2.474 2.469 2.461 2.311 2.284 2.266 2.075 Ningbo 2.250 1.857 2.049 2.403 2.395 2.413 2.426 2.352 2.285 2.257 2.242 2.213 1.991 Wenzhou 2.866 2.867 3.102 3.122 3.100 3.038 3.034 3.014 2.952 2.605 2.575 2.549 2.287 Jiangxin 2.080 1.558 1.628 2.181 2.145 2.058 2.015 1.947 2.067 2.050 2.085 2.074 1.870 Huzhou 2.254 1.719 1.792 2.304 2.262 2.285 2.228 2.150 2.092 2.074 2.089 2.074 1.904 Shaoxing 2.065 1.731 2.019 2.426 2.396 2.427 2.357 2.296 2.322 2.279 2.269 2.249 2.008 Jinhua 2.710 2.740 3.009 3.010 3.124 3.097 2.843 2.766 2.651 2.719 2.717 2.686 2.350 Quzhou 2.595 2.512 2.822 2.893 2.922 2.935 2.898 2.894 2.902 2.808 2.665 2.642 2.181 Zhoushan 2.358 1.934 2.394 2.330 2.346 2.318 2.276 2.148 2.099 1.995 2.003 1.996 1.909 Taizhou 2.378 2.519 2.911 2.954 2.916 2.903 2.891 2.811 2.600 2.527 2.539 2.505 2.249 Lishui 3.391 3.517 3.887 3.880 4.579 4.623 3.849 3.895 3.486 3.254 3.234 3.160 2.442 Data source: Author calculated based on the data in Zhejiang Statistic Yearbookby National Statistics Bureau(2015). China Statistics Press 2.3 Income gap in different regions In terms of residents’ per capita disposable incomes, every prefecture-level city of Zhejiang Province has witnessed an evident rise since the 21st century. Except Quzhou and Lishui, the gap between different regions of Zhejiang Province proves to be insignificant (Figure 2.4). For example, in 2015 Hangzhou and Ningbo boast the highest per capita disposable incomes, which are 48,316 yuan and 47,852 yuan respectively; while Lishui and Quzhou have the lowest per capita disposable incomes, which are 32,875 yuan and 33,212 yuan respectively.
  • 4. The Current Status of Income Distribution in China the case of Zhejiang Province www.ijmsi.org 12 | Page Table 4. The disposable income per capita in Zhejiang's 11 cities.Unit:Yuan Region/year 2002 2005 2011 2012 2013 2014 2015 Hangzhou 11,778 16,601 32,434 35,704 39,310 44,632 48,316 Ningbo 12,970 17,394 34,321 38,043 41,657 44,155 47,852 Wenzhou 14,591 19,805 31,749 34,820 37,852 40,510 44,026 Jiangxin 11,504 16,189 31,520 35,696 39,087 42,143 45,499 Huzhou 11,388 15,561 29,367 32,987 36,220 38,959 42,238 Shaoxing 11,749 17,319 33,273 36,911 40,454 43,167 46,747 Jinhua 11,264 15,387 29,729 33,164 36,423 39,807 43,193 Quzhou 9,330 13,006 24,900 26,232 28,883 30,583 33,212 Zhoushan 10,985 15,524 30,496 34,224 37,646 41,466 44,845 Taizhou 11,817 18,313 30,490 33,979 37,038 39,763 43,266 Lishui 9,901 12,846 23,391 26,309 29,045 30,413 32,875 Data source: National Statistics Bureau. Zhejiang Statistic Yearbook(2015). China Statistics Press. III. THE ASSESSMENT OF ZHEJIANG'S INCOME INEQUALITY Many indexes can be used to assess income inequality. Among them, Theil Index is relatively sensitive to the income fluctuation of high-income groups and low-income groups. Besides, the urban-rural income gap in China mainly reflects income changes at both ends (Cao Yu, et al., 2010). Hence, this research adopts Theil Index to analyze the income distribution gap between different regions. Theil Index can be illustrated by the following formula (1): 2 , , , , , , 1 , ,, ln i j t i j t i j t it j i t i ti t p p z T L p zp                (1) In the above formula, t denotes “year”, and i refers to “region” whose valve ranges from 1 to 11 signifying the 11 prefecture-level cities; j refers to urban/rural regions, with j=1 signifying urban region and j=2 signifying rural region. pij denotes the total income of urban area (j=1) and rural area (j=2) in region i, which is calculated by the product of population×per capita income; and pi refers to the total income of region i. zij signifies the urban (j=1) or rural (j=2) population in region i, and zi signifies the total population of region i. The lower Theil Index becomes, the smaller the income gap is.Considering the CPI difference in different years and in urban/rural regions, the writer has adjusted the data concerning residents’ per capita disposable incomes. With the year 2002 as the basis, the CPI of urban and rural areas has been correspondingly modified. After this modification, the changing trend of Theil Index which can reflect the urban-rural gap in Zhejiang Province is illustrated in Figure 2. From this figure, it can be observed that this trend, in consistency with the ratio of urban/rural per capita disposable incomes, takes on an inverted “U” pattern. Figure 2. The Income gap tendency with Theil Index in Zhejiang(2002-2014) Data source: By authors In terms of the income distribution in different regions, cities like Jiaxing, Huzhou and Zhoushan have the lowest income gap, with their Theil Index at 0.041, 0.044 and 0.045 respectively; while Jinhua and Lishui have the largest income gap, with their Theil Index at 0.073 and 0.070.
  • 5. The Current Status of Income Distribution in China the case of Zhejiang Province www.ijmsi.org 13 | Page Table 5.The Theil Index in Zhejiang's 11 cities(2002-2014) Region/year 2002 2003 2004 2005 2006 2007 2008 2009 2010 2011 2012 2013 2014 Zhejiang Province 0.085 0.091 0.099 0.104 0.109 0.111 0.109 0.108 0.104 0.100 0.101 0.077 0.075 Hangzhou 0.065 0.064 0.074 0.079 0.084 0.087 0.084 0.083 0.082 0.070 0.067 0.065 0.051 Ningbo 0.080 0.046 0.056 0.087 0.086 0.087 0.087 0.082 0.077 0.074 0.072 0.070 0.051 Wenzhou 0.076 0.122 0.132 0.136 0.135 0.129 0.128 0.128 0.124 0.093 0.090 0.087 0.066 Jiangxin 0.061 0.023 0.024 0.068 0.065 0.057 0.053 0.048 0.058 0.056 0.058 0.057 0.041 Huzhou 0.079 0.035 0.034 0.077 0.074 0.075 0.069 0.064 0.059 0.058 0.059 0.058 0.044 Shaoxing 0.055 0.033 0.051 0.087 0.085 0.087 0.081 0.077 0.080 0.076 0.075 0.073 0.053 Jinhua 0.108 0.114 0.128 0.129 0.140 0.137 0.114 0.109 0.101 0.106 0.105 0.102 0.073 Quzhou 0.091 0.085 0.101 0.109 0.119 0.119 0.115 0.117 0.118 0.110 0.097 0.096 0.058 Zhoushan 0.091 0.054 0.086 0.081 0.082 0.079 0.075 0.065 0.061 0.052 0.053 0.052 0.045 Taizhou 0.073 0.086 0.109 0.114 0.111 0.110 0.108 0.103 0.086 0.080 0.081 0.078 0.059 Lishui 0.153 0.167 0.185 0.188 0.248 0.250 0.186 0.192 0.158 0.139 0.135 0.128 0.070 Data source: By authors IV. DISCUSSION AND POLICY IMPLICATIONS This paper studies Zhejiang's current status income distribution among different industries, between urban and rural housheold and in different cities. Mainly, we can get the following conclusions of Zhejiang's income distribution. First, compared with the national level, Zhejiang's income gap is relatively low and the inomce differences is experiencing an shrinked tendency in recent years. Second, the absolute income gap in different industries sectors are large, but the ratio between income differences in various sectors is shrinking. In addition, compared with other 30 provinces in China, the income equality in Zhejiang exhibits very well with a much lower urban-rural income gap. Third, the income gap in different cities of Zhejiang is not large. Among the 11 cities, the income inequality of Jinhua and Lishui is the largest. The history experiences shows that the economic growth and economic inequality would exhibit an reverse "U" shape (Kuznets, 1955). Zhejiang, with the GDP per capita at US.$ 6047.82(2005 as constant year, World Bank,2014) in 2014, is experiencing an increasing economic growth and decreasing income inequality. However, the income inequality would not be decreased automatically by the market. Further reform on helping reducing the income inequality should be taken as the the high and rising inequality would dampen domestic consumption and generate pressures on the exports(Wang,et al, 2014). Current, the whole China's economic growth is experiecing an decreasing economic growth rate and it is imporatant to stimulate the domestic consumption in the content of global weak consuption. The reform of China's strict household registration system should be taken to help increase the urbanizaition rate and further increase the initial income distribution for the people who stay and live in the urban areas but without "hukou". ACKNOWLEDGE We would like to acknowledge the support from Zhejiang Philosophy and Social Science Planning Project (14NDJC096YB), Zhejiang Major Project in Humanities and Social Science Research Projects (2013QN046), Natural Science Foundation of China (71403236) and Natural Science Foundation of Zhejiang (LY17G030023). REFERENCES [1] Adelman, I., & Robinson, S. (1988)."Macroeconomic Adjustment and Income Distribution: Alternative Models Applied to Two Economies". Journal of Development Economics, , 29(1): 23-44. [2] ALI, I. (2007). "Inequality and the Imperative for Inclusive Growth in Asia." Asian Development Review 24 (2): 1-16. [3] Bishop, J. A., Formby, J. P., & Smith, W. J. (1997). "Demographic Change and Income Inequality in the United States, 1976-1989". Southern Economic Journal, 64(1):33-44. [4] Boccanfuso, D. and B. Decaluwé, et al. (2008). "Poverty, income distribution and CGE micro-simulation modeling: Does the functional form of distribution matter?" Journal of Economic Inequality(6): 149-184. [5] Boccanfuso, D., Decaluwé, B., & Savard, L. (2008)."Poverty, Income Distribution and CGE Micro-Simulation Modeling: Does the Functional Form of Distribution Matter?". Journal of Economic Inequality, (6): 149-184. [6] Bourguignon, F., de Melo, J., & Morrisson, C. (1991)."Poverty and Income Distribution during Adjustment: Issues and Evidence from the OECD Project". World Development, 19(11):1485-1508. [7] Bussolo, M. and R. E. De Hoyos, et al. (2008). "Economic Growth and Income Distribution: Linking Macroeconomic Models with Household Survey Data at the Global Level". 30th General Conference of The International Association for Research in Income and Wealth. Portoroz, Slovenia. [8] Cai, H., Y. Chen, & Zhou L., (2010)."Income and Consumption Inequality in Urban China: 1992-2003. Economic Development and Cultural Change".58(3):385-413. [9] Cogneau, D., & A.-S. Robilliard.(2000). "Income Distribution, Poverty and Growth in Madagascar: Micro Simulations in a General Equilibrium Framework". IFPRI TMD Discussion Paper 61, International Food Policy Research Institute, Washington, DC. 2000. [10] Cororaton C. "Analysis of Trade, Income Inequality and Poverty: Using Micro-Simulation Approach, the Case of The Phillipines", Discussion Paper, 2003, 2003-09, Philippine Institute for Development Studies. [11] De La Croix , David and Matthias Doepke, (2004). "Inequality and Growth:Why Differential Fertility Matters". American Economic Review ,93 (4): 1091-1113.
  • 6. The Current Status of Income Distribution in China the case of Zhejiang Province www.ijmsi.org 14 | Page [12] Deaton, A., & Paxon, C. (1994). "Intertemporal Choice and Inequality". Journal of Political Economy. 102(3):437-467 [13] Ghosh, Sugata and Sarmistha Pal, (2004). "The Effect of Inequality on Growth : Theory and Evidence from the Indian States". Review of Development Economics, 8(1):164-177. [14] Kuznets, S., (1955)."Economic Growth and Economic Inequality", American Economic Review, 45(1):1-28 [15] Lu, M., Chen,Z.,and Wan, G.(2005) "For the Sake of Growth: The Nexus of Inequality, Investment, Education and Growth in China". Economic research(Chinese),2005(12): 4-14. [16] Luo, X. and N. Zhu (2008). "Rising Income Inequality in China:A Race to the Top." Policy Research Working Paper 4700. [17] National Statistics Bureau.(2015). "China's Statistical Yearbook". China Statistics Press,China. [18] National Statistics Bureau.(2015). "Zhejiang's Statistical Yearbook". China Statistics Press,China. [19] Pat ridge, Mark D.,(1997)."Is Inequality Harmful for G rowth ? Comment,". American Economic Review , 87:1019 -1032. [20] Qu, Z. and Z. Zhao (2008). "Urban-Rural Consumption Inequality in China from 1988 to 2002: Evidence from Quantile Regression Decomposition." IZA DP No. 3659. [21] Savard, L., Poverty and Income Distribution in a CGE-Household Micro-Simulation Model: Top-Down/Bottom up Approach. Cahier de recherche/Working Paper 03-43, 2003. [22] Shi, X., Terry S., & Y. Zhao. "Analyzing Urban-Rural Income Inequality in China". Paper presented at the International Symposium on Equity and Social Justice in Transitional China, Beijing, 2002, July 11-12. [23] Sicular, T. and X. Yue, et al. (2006). "The Urban-Rural Income Gap and Inequality in China." UNU-WIDER Research Paper No. 2006/135. [24] Sicular, T. and Y. Ximing, et al. (2007). "THE URBAN–RURAL INCOME GAP AND INEQUALITY IN CHINA." Review of Income and Wealth 53 (1). [25] Wang, C. and G. Wan, et al. (2014). "INCOME INEQUALITY IN THE PEOPLE'S REPUBLIC OF CHINA: TRENDS, DETERMINANTS, AND PROPOSED REMEDIES." Journal of Economic Surveys 28 (4): 686-708. [26] Wang, J., Mayes, D. & WAN, G.(2005)."Income Distribution and Labor Movement in China after WTO membership-- A CGE analysis". ABERU Discussion Paper 19,2005. [27] World Bank. (2014)."World Development Indicators. <http://"http://databank.worldbank.org/data/home.aspx> [28] Xing, C. (2014). "Migration, self-selection and income distributions." Economics of Transition 22 (3): 539-576.