
Recommended
Recommended
More Related Content
What's hot
What's hot (19)
Viewers also liked
Viewers also liked (18)
Similar to International Journal of Engineering and Science Invention (IJESI)
Similar to International Journal of Engineering and Science Invention (IJESI) (20)
Recently uploaded
Recently uploaded (20)
International Journal of Engineering and Science Invention (IJESI)
- 1. International Journal of Engineering Science Invention ISSN (Online): 2319 – 6734, ISSN (Print): 2319 – 6726 www.ijesi.org Volume 2 Issue 11ǁ November 2013 ǁ PP.29-37 Biotransformation Of Benzaldehyde To L- Phenylacetylcarbinol By Free Cells Of Yeast (Saccharomyces Cerevisae), Effects Of ΒCyclodextrin And Its Optimization T. F. Adepoju1, S. K. Layokun2, Olawale. O3, Okolie. C4 1, 3 2 Chemical Engineering Department, Landmark University, Omu-aran, P.M.B. 1001, Kwara State, Nigeria Chemical Engineering Department, Obafemi Awolowo University, Ile-Ife, Osun State, P.M.B, 2200055, Nigeria 4 Biological Sciences Department, Landmark University, Omu-aran, P.M.B. 1001, Kwara State, Nigeria ABSTRACT: In this study, an Artificial Neural Network (ANNs) was engaged to optimize LPhenylacetylcarbinol production form biotransformation of benzaldehyde by free cell of yeast and the effect ofβCyclodetrin.In developing ANN model, performance of ANN is heavily influenced by its network structure,fivelevel-five-factors design was applied, which generate 50 experimental runs. The inputs for the ANNs arecell weight (wet. wt): X1, incubation time (min): X2, Acetaldehyde conc. (mg/100 ml): X3, benzaldehyde conc. (mg/100 ml): X4, and β-level (%): X5. The learning algorithms used was QP with MNFF, the transfer function was Tanh. Meanwhile, RMSE was determined to be 7.245. The coefficient of determination R2 and the adj. R2 were found to be 0.9985 and 0.997, respectively.It was observed that 1000 (mg/100 ml) benzaldehyde with 900 (µg/100 ml) acetaldehyde in the presence of 1.8% β-cyclodextrin gave the highest yield (664 mg/100 ml) of LPhenylacetylcarbinol. Hence, the organism can tolerate higher levels of acetaldehyde and benzaldehyde. KEYWORDS:Artificial neural network (ANNs), Biotransformation, Yeast, L-Phenylacetylcarbinol, Optimization I. INTRODUCTION One of the key intermediate for the synthesis of most pharmaceutical products (norephedrine,norpseudoephedrine, L-ephedrine, pseudoephedrine etc.) is L-Phenylacetylcarbinol. Although, chemical synthesis from cyanohydrins can be used in the production, but the biotransformation pathusing benzaldehyde for it industrially production is preferable, Brusseet al.(1988). Neuberg and Lieberman (1921) first experimented the biotransformation of benzaldehyde to optically L-PAC, since then the demand for industrial application of this process came about when the chemical synthesis of ephedrine using 1-acetyl phenylcarbinol was patented. Meanwhile, almost all the literature concerning the synthesis of L-PAC and benzyl alcohol by fermenting yeast deals with yield optimization by free cells (Agrawalet al., 1986; Cardilloet al., 1991; Zeeman et al., 1992). Studies revealed that the formation of L-PAC from benzaldehyde under normal fermentative conditions using yeast shows that the quantitative conversion of benzaldehyde into L-PAC has never been achieved because of formation of by-products like benzyl alcohol, PAC-diol (Smith and Hendlin, 1953; Gupta et al., 1979; Netraval and Vojtisek, 1982; Agrawal and Basu, 1989). The yeast cannot be used for multiple batches because of the toxic and inhibitory effects of substrate and products (Long et al., 1989; Coughlin et al., 1991). The use of βcyclodextrin always decreased the toxicity of benzaldehyde for bioconversion using immobilized cells has been reported (Coughlin et al., 1991; Mahmoud et al., 1990). In view of these, Vilas et al., 2002, worked on the effect of addition of b -cyclodextrin on biotransformation of benzaldehyde to L-PAC by the cells of Torulaspora delbrueckii in order to increase the optimum yield of L-PAC. Agrwalet al., 1986, worked on the production of L-Acetyl Phenyl Carbinol by yeast employing benzaldehyde as precursor and the results was reported to be acceptable except that the experiment was not optimized. Production of phenyl acetyl carbinol by yeast was carried out by Gupta et al., 1978, but no report was available showing high yields of L-PAC production by this mechanism. Biotransformation of benzaldehyde to L-phenylacetylcarbinol (L-PAC) by Torulaspora delbrueckii and conversion to ephedrine by microwave radiation was reported by Vilas et al. (2002). The results obtained were good, except the process condition was not optimized. Shukla and Kulkarni (2001) worked on the process parameters and reusability of the free cell mass of Torulaspora delbrueckii for the production of L-PAC without optimization using statistical approach. In the same vein, Shukla and Kulkarni (2000), worked on LPAC: biosynthesis and industrial application. Adepoju et al. (2013) carried out research on an innovative approach to biotransformation of benzaldehyde to L-PAC via free cells of saccharomyces cerevisae in the presence of β-cyclodextrin, using response surface methodology and the process was optimized using CCRD. The results obtained were good. In this work, an Artificial Neural Network (ANNs) was engaged to optimize L- www.ijesi.org 29 | Page
- 2. Biotransformation Of Benzaldehyde To L- Phenylacetylcarbinol… Phenylacetylcarbinol production form biotransformation of benzaldehyde by free cell of yeast (Saccharomyces cerevisae) and the effect of β-Cyclodetrin was evaluated. II. MATERIAL AND METHODS 2.1 MATERIALS All chemicals used such as; diethyl ether, anhydrous sodium sulphate, benzaldehyde, acetaldehyde, βcyclodextrin were of analytical grade and need no further purification. 2.2 2.2.1 METHODS MICROORGANISMS Yeast used in this study was isolated locally. The culture was consistently maintained on a medium containing 0.4% dextrose, 1%yeast extract, 1% malt extract, and 2% agar at pH 7.2 (Agarwalet al., 1986; Adepoju et al., 2013). 2.2.2 THE GROWTH MEDIUM The growth medium for Saccharomyces cerevisae (Long et al., 1989; Adepoju et al., 2013) contained glucose 2%, peptone 2%, yeast extract 1% and had pH 5.5. 2.2.3 CULTURE GROWTH 1 ml suspension of cells of the isolate Saccharomyces cerevisaecontaining 106 cells was inoculated into 9 ml of growth medium and incubated on a rotary shaker at 30 ± 2 oC at 240 rpm for 24 h. The obtained culture was inoculated into 100 ml of the same medium and allowed to grow for 24 h. Under the same conditions, cells were harvested by centrifuging at 10, 000 rpm for 15 min at 15 oC. The biomass obtained was washed with water, centrifuged and was used for biotransformation studies. 2.2.4 BIOTRANSFORMATION OF BENZALDEHYDE TO L-PAC 100 ml of biotransformation medium containing 5% glucose, 0.6% peptone and had pH 4.5 was inoculated with a known weight of cell mass (biomass) obtained. The reactor was incubated on a shaker at 30 oC and 240 rpm at different time range for adaptation of cells to the medium. Benzaldehyde and acetaldehyde was added and flasks were incubated again for the biotransformation on a shaker at 30 oC and 240 rpm. 2.2.5 EFFECT OF β-CYCLODEXTRIN ADDITION ON BIOTRANSFORMATION OF BENZALDEHYDE Effect of various levels of β-cyclodextrin was studied at benzaldehyde and acetaldehyde levels ranging from 500 mg to 1600 mg/100 ml and 400 µl to 1300 µl/100 ml, respectively. The reaction was allowed to take place for 3 h at 30 ± 2oC and 240 rpm. To study the effect of β-CD level, concentration of β-CD was optimized in the range of 0.4 to 3.2%. Semi-continuous feeding of different levels of benzaldehyde and acetaldehyde was also carried out according to design software (Table 1). 2.3ANALYSIS OF BIOTRANSFORMATION PRODUCTS After biotransformation, the medium was centrifuged at 10,000 rpm for 15 min. The supernatant were extracted three times with equal volumes of diethyl ether. The combined extract was dried over anhydrous sodium sulphate and concentrated over a temperature controlled water bath. The residue obtained was dissolved in methanol and preparedfor gas chromatography (GC) analysis. 2.4GAS CHROMATOGRAPHY ANALYSIS The conditions used for GC analysis were as follows- GC model used was Chemito-8510 with Oracle 1 computing integrator. A 4 meter long column of 5% OV-17 was used. The injector temperature and detector temperature (FID) was maintained at 250 oC. Column programming was as follows: 75 oC for 3 min, then 10 oC/ 1 min up to 250 oC and holding time was for 5 min. Retention times of L-PAC was 17 min. The concentration of the compound was determined using peak area method (Shukla and Kulkarni, 1999, Adepoju et al., 2013). The experiment was replicated in triplicate until it was found to be reproducible within ± 3 percent limits. 2.5EXPERIMENTAL DESIGN In developing ANN model, performance of ANN is heavily influenced by its network structure; therefore, the learning algorithms used was QuickProp (QP), multilayer connection type used was multilayer normal feed forward (MNFF), three total layer numbers was used and the node number of input layer was five. www.ijesi.org 30 | Page
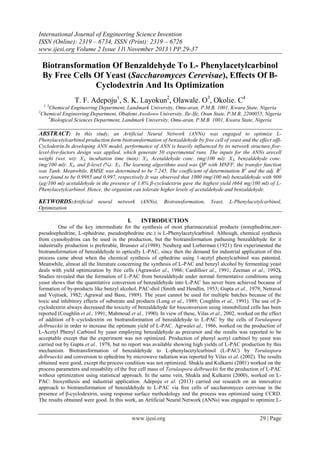
- 3. Biotransformation Of Benzaldehyde To L- Phenylacetylcarbinol… For the output layer, Node Number was 1, the transfer function was Tanh and the slope of transfer function and the hidden Layer was 1, the node number was 12, transfer function was also Tanh and slope of transfer function was also 1 (Fig. 1). Meanwhile, the optimum ANN structure was determined first using mean square error (MSE) approach. The higher coefficient R2 was determined; the variable analysis also was conducted to study the effects of variables towards the L-Phenylacetylcarbinol production using 3D curvature’s surface plots. A hybrid ANN model was used in conducting process optimization. Table 1 show the independent factors cell weight g (wet. wt): X1, incubation time (min): X2, Acetaldehyde conc. (mg/100 ml): X 3, benzaldehyde conc. (mg/100 ml): X4 and β-CD level (%): X5, and their five levels for ANNs design.Table 2 depicts the L-Phenylacetylcarbinol yields, the observed values and the difference. The effects of unexplained variability in the L-Phenylacetylcarbinol yield response due to extraneous factors were minimized by randomizing the order of experiments. Table 1: Factors and their Levels for ANNs Design Variable Symbol Cell weight (wet. wt) Incubation time (min) Acetaldehyde conc. (µg/100 ml) Benzaldehyde conc. (mg/100 ml) ß-CD level (%) X1 X2 X3 X4 X5 2 40 400 500 0.4 3 50 700 700 0.8 Actual factor levels 4 60 1000 900 1.2 5 70 1300 1100 1.6 6 80 1600 1300 3.2 Table 2: ANNs Design for Biotransformation of Benzaldehyde to L-PAC and the by products with Five Independent Variables using actual values Std. run X1 X2 X3 X4 X5 L-PAC (mg/100 ml) 1 2 3 4 5 6 7 8 9 10 11 12 13 14 15 16 17 18 19 20 21 22 23 24 25 26 27 28 29 30 31 32 33 34 35 2.00 6.00 2.00 6.00 2.00 6.00 2.00 6.00 2.00 6.00 2.00 6.00 2.00 6.00 2.00 6.00 2.00 6.00 2.00 6.00 2.00 6.00 2.00 6.00 2.00 6.00 2.00 6.00 2.00 6.00 2.00 6.00 2.00 6.00 4.00 40.00 40.00 80.00 80.00 40.00 40.00 80.00 80.00 40.00 40.00 80.00 80.00 40.00 40.00 80.00 80.00 40.00 40.00 80.00 80.00 40.00 40.00 80.00 80.00 40.00 40.00 80.00 80.00 40.00 40.00 80.00 80.00 60.00 60.00 40.00 400.00 400.00 400.00 400.00 1600.00 1600.00 1600.00 1600.00 400.00 400.00 400.00 400.00 1600.00 1600.00 1600.00 1600.00 400.00 400.00 400.00 400.00 1600.00 1600.00 1600.00 1600.00 400.00 400.00 400.00 400.00 1600.00 1600.00 1600.00 1600.00 1000.00 1000.00 1000.00 500.00 500.00 500.00 500.00 500.00 500.00 500.00 500.00 1300.00 1300.00 1300.00 1300.00 1300.00 1300.00 1300.00 1300.00 500.00 500.00 500.00 500.00 500.00 500.00 500.00 500.00 1300.00 1300.00 1300.00 1300.00 1300.00 1300.00 1300.00 1300.00 900.00 900.00 900.00 0.40 0.40 0.40 0.40 0.40 0.40 0.40 0.40 0.40 0.40 0.40 0.40 0.40 0.40 0.40 0.40 3.20 3.20 3.20 3.20 3.20 3.20 3.20 3.20 3.20 3.20 3.20 3.20 3.20 3.20 3.20 3.20 1.80 1.80 1.80 212 220 211 210 209 213 211 206 205 206 205 197 201 196 204 191 332 364 368 391 392 419 430 449 477 500 514 529 534 554 574 585 345 369 305 www.ijesi.org Observed value (mg/100 ml) 212 220 211 210 209 213 211 206 205 206 205 197 201 196 204 191 332 364 368 391 392 419 430 449 477 500 514 529 534 554 574 585 345 369 323 Difference 0.00029631 6.9505E-5 0.00033853 0.0008403 0.0012446 0.0011119 0.00067939 0.00055253 0.00040242 0.00017716 0.00030121 0.00058316 0.0013218 0.00118 0.00085186 0.00071778 9.2085E-5 0.00020485 0.00032902 0.00066427 0.0010404 0.00086966 0.00055557 0.00039127 0.00021363 0.00013199 0.000386 0.00072191 0.001586 0.0015233 0.0011736 0.00099812 0.00016085 8.843E-5 18 31 | Page
- 4. Biotransformation Of Benzaldehyde To L- Phenylacetylcarbinol… 36 37 38 39 40 41 42 43 44 45 46 47 48 49 50 4.00 4.00 4.00 4.00 4.00 4.00 4.00 4.00 4.00 4.00 4.00 4.00 4.00 4.00 4.00 80.00 60.00 60.00 60.00 60.00 60.00 60.00 60.00 60.00 60.00 60.00 60.00 60.00 60.00 60.00 1000.00 400.00 1600.00 1000.00 1000.00 1000.00 1000.00 1000.00 1000.00 1000.00 1000.00 1000.00 1000.00 1000.00 1000.00 900.00 900.00 900.00 500.00 1300.00 900.00 900.00 900.00 900.00 900.00 900.00 900.00 900.00 900.00 900.00 1.80 1.80 1.80 1.80 1.80 0.40 1.80 1.80 1.80 1.80 1.80 1.80 1.80 1.80 1.80 341 277 339 216 370 52 664 386 387 386 387 386 387 386 387 323 308 308 216 370 52 664 386.5 386.5 386.5 386.5 386.5 386.5 386.5 386.5 18 31 31 0.000197 3.2114E-5 0.00010651 0.00035117 0.50002 0.49998 0.50002 0.49998 0.50002 0.49998 0.50002 0.49998 2.5.1 STATISTICAL DATA ANALYSIS ANNs structure was used for modelling the L-PAC production. The optimum ANN structure was determined using mean square error (MSE) approach. The higher coefficient R2 was determined; the variable analysis also was conducted to study the effects of variables towards the L-Phenylacetylcarbinol yield using relative importance and 3D curvature’s surface plots. A hybrid ANN model was used in conducting process optimization. The difference between the experimental and observed values was also used to proof the validity of ANNs for the optimization of L-Phenylacetylcarbinol production. III. RESULTS AND DISCUSSION Table 2 depicts the actual factors considered in this study with experimental L-PAC yields, the observed yields as well as the difference obtained by ANNs software. The effects of unexplained variability in the L-PAC yield response due to extraneous factors were minimized by randomizing the order of experiments. Table 3 shows the paameters of the best network that described the results of of the normal data type for ANNs. Considering the large QP-values (the number of repetition) and low corresponding RMSE-values (root mean squared error) which was used to compare the predicted values of L-PAC yield obtained from the model with experimental data, shows that all the model terms are significant and have very strong effects on the L-PAC yield. The goodness of fit of the model was checked by the coefficient of determination (R2). R2 should be at least 0.80 for the good fit of a model (Guan and Yao, 2008). In this case, the R 2 value of 0.9985 indicated that the sample variation of 99.85% for the L-PAC production is attributed to the independent factors (cell weight, incubation time, acetaldehyde conc., benzaldehyde conc. and β-CD level). The value of the adjusted determination coefficient (Adj. R2) 0.997 was also evaluated to be 0.997. Generally, the three-dimensional (3D) curvature plots are graphical representations of the regression equation for the optimization of the reaction variables, and they are represented in Figure 2. The curvatures’ nature of 3D surfaces in Figure 4.2c, f, h, j, suggested mutual reciprocal interaction of cell weight with benzaldehyde conc., incubation time with benzaldehyde conc., acetaldehyde conc. with benzaldehyde conc., and benzaldehyde conc. with β-CD level, respectively. On the other hand, the nature of curvatures’ of 3D surfaces in Figure 4.2a, b, d, e, g, i, indicated moderate interactions of cell weight with incubation time, cell weight with acetaldehyde conc., cell weight with β-CD level, incubation time with acetaldehyde conc., incubation time with β-CD level, and acetaldehyde conc. with β-CD level, respectively. Table 3: Parameters of the Best Network for L-PAC Describing the Results of the Normal Data Type For ANNs Data Iteration (QP) RMSE Values 309200 7.245 Average R Average DC 0.9985 0.997 www.ijesi.org 32 | Page
- 5. Biotransformation Of Benzaldehyde To L- Phenylacetylcarbinol… Figure 1: Network Structure with Twelve Transfer Functions (a) A(vertical) = L-PAC yield (mg/100 ml), A(horizontal) = Cell weight g(wet.wt), B(horizontal) = Incubation time (min) (b) A(vertical) = L-PAC yield (mg/100 ml), A(horizontal) = Cell weight g(wet.wt), C(horizontal) = Acetaldehyde conc. (µg/100 ml) www.ijesi.org 33 | Page
- 6. Biotransformation Of Benzaldehyde To L- Phenylacetylcarbinol… (c) A(vertical) = L-PAC yield (mg/100 ml), A(horizontal) = Cell weight g(wet.wt), D(horizontal) = Benzaldehyde conc. (mg/100 ml) (d) A(vertical) = BA yield (mg/100 ml), A(horizontal) = Cell weight g(wet.wt), C(horizontal) = ß-CD level (%) (e) A(vertical) = L-PAC yield (mg/100 ml), B(horizontal) = Incubation time (min), C(horizontal) = Acetaldehyde conc. (µg/100 ml) www.ijesi.org 34 | Page
- 7. Biotransformation Of Benzaldehyde To L- Phenylacetylcarbinol… (f) A(vertical) = L-PAC yield (mg/100 ml), B(horizontal) = Incubation time (min), D(horizontal) = Benzaldehyde conc. (mg/100 ml) (g) A(vertical) = L-PAC yield (mg/100 ml), B(horizontal) = Incubation time (min), E(horizontal) = ß-CD level (%) (h) www.ijesi.org 35 | Page
- 8. Biotransformation Of Benzaldehyde To L- Phenylacetylcarbinol… A(vertical) = L-PAC yield (mg/100 ml), C(horizontal) = Acetaldehyde conc. (µg/100 ml), D(horizontal) = Benzaldehyde conc. (mg/100 ml) (i) A(vertical) = L-PAC yield (mg/100 ml), C(horizontal) = Acetaldehyde conc. (µg/100 ml), E(horizontal) = ß-CD level (%) (j) A(vertical) = L-PAC yield (mg/100 ml), D(horizontal) = Benzaldehyde conc. (mg/100 ml), E(horizontal) = ßCD level (%) Figure 2: (a-j): 3-D curvatures’ plots IV. CONCLUSIONS The results obtained in this study using Artificial neural network to determine the effects of five reaction variables, namely, cell weight, incubation time, acetaldehyde conc., benzaldehyde conc. and β-CD level on biotransformation of benzaldehyde to L-Phenylacetylcarbinolby free cells yeastand effects of βCyclodextrin, indicate that ANNs is a good optimization tools for L- Phenylacetylcarbinol production. The Root Mean Square Error (RMSE) obtained was 3.0739. The coefficient of determination R 2 and the adj. R2 were www.ijesi.org 36 | Page
- 9. Biotransformation Of Benzaldehyde To L- Phenylacetylcarbinol… found to be 0.99206 and 0.98419, respectively. It was observed that 1000 (mg/100 ml) benzaldehyde with 900 (µg/100 ml) acetaldehyde in the presence of 1.8% β-cyclodextrin gave the highest yield of LPhenylacetylcarbinol. Hence, theorganism can tolerate higher levels of acetaldehyde and benzaldehyde. The lower values of difference obtained between experimental and observed values showed the power of ANNs for L-Phenylacetylcarbinol. V. ACKNOWLEDGEMENT The Authors acknowledge the effort of the technical staff of biology and chemistry laboratories of Landmark University. REFERENCES [1] [2] [3] [4] [5] [6] [7] [8] [9] [10] [11] [12] [13] [14] Adepoju T. F., Layokun, S. K., Ojediran, O.J., Okolie, C. (2013). An innovative approach to biotransformation of benzaldehyde to L-PAC via free cells of Saccharomyces cerevisae in the presence of β-Cyclodextrin.IJSER.,(in press). Brusse, J., Roos, E.S., Van Der Gen. A. (1988). Biorganic synthesis of optically active cyanohydrins and acylons.Tetrahedron Letters. 29: 4485-4488. Cardillo, R., Servi S., Tinti, C. (1991). Biotransformation of unsaturated aldehydes by micro organisms with pyruvate decarboxylase activity.Applied Microbiol.Biotechnol., 36(3), 300-303. Coughlin, R.W., Mahmoud, W.M. and El-sayed, A.H. (1991).A.H. (1991).Enhanced bioconversion of toxic substances.US Patent. 5173-5413. Guan, X., Yao, H., 2008.Optimization of viscozyme L-assisted extraction of oat bran protein using response surface methodology.Food Chemistry. 106: 345–351. Gupta, K.G. Singh, J., Sahani, G. and Dhavan, S. (1979), Production of phenyl acetyl carbinol by yeasts. Biotechnol.Bioeng., 21(6), 1085-1089. Long, A., James, P. and Ward, O.P. (1989).Aromatic aldehydes as substrate for yeast and yeast alcohol dehydrogenase.Biotechnol.Bioeng., 33(5), 657-660. Mahmoud, W. M., El-Sayed, A.H.M. and Coughlin, R.W. (1990). Effect of β – Cyclodetrine on production of L-phenyl acetyl carbinol by immobilized cells of Saccharomyces cerevisae.Biotechnol.Bioeng., 36(3), 256-262. Neuberg, J and Libermann, L. (1921). Zurkenntnis der carboligase II Muteilung.BiochemischeZeitschnuff. 127, 327-339. Smith, P. F. and Hendlin, D. (1953).Mechanism of phenyl acetyl carbinolsynthesid by yeast. J. Bacteriol., 65, 440-445. Shukla V.B. and Kulkarni, P.R. (2000). L- Phenylacetylcarbinol (L-PAC): biosynthesis and industrial applications. World Journal of Microbiology & Biotechnology. 16: 499-506. Shukla V.B. and Kulkarni, P.R. (2001).Process parameters and reusability of the free cell mass of Torulaspora delbrueckii for the production of L-PAC.World Journal of Microbiology & Biotechnology. 17: 301-306. Shukla, V. B. and Kulkarni, P.R. (2002), Biotransformation of benzaldehyde in to L-phenylacetylcarbinol (L-PAC) by free cells of Torulaspora delbrueckii in presence of Beta-cylodetrin. Braz. Arch. Biol. Technol., 45(3): 265-268. Vilas, B. S., Virendra, R. M., Bhushan, M. K., Pushpa, R. K. (2002). Biotransformation of benzaldehyde to Lphenylacetylcarbinol (L-PAC) by Torulaspora delbrueckii and conversion to ephedrine by microwave radiation.Journal of Chemical Technology and Biotechnology., 77: 137-140. www.ijesi.org 37 | Page