This document discusses applying statistical quality control techniques to improve the quality of paramedical services. It analyzes the time taken to provide different paramedical services to patients at a hospital in Bhubaneswar, India. Control charts are created for the mean and range of time taken for seven common services (blood sugar, creatinine, etc.). The charts identify samples where the process went out of control, indicating room for improvement. Suggestions are made to reduce variations and delays in service delivery times.
Call Girls Pimpri Chinchwad Call Me 7737669865 Budget Friendly No Advance Boo...
Application of Statistical Quality Control Techniques for Improving the Service Quality of Paramedical Services
1. International Journal of Mathematics and Statistics Invention (IJMSI)
E-ISSN: 2321 – 4767 P-ISSN: 2321 - 4759
www.ijmsi.org Volume 4 Issue 6 || August. 2016 || PP-23-29
www.ijmsi.org 23 | Page
Application of Statistical Quality Control Techniques for
Improving the Service Quality of Paramedical Services
Debajani Nayak1
, Priyaranjan Dash2
1
Lecturer, Department of Obstetrics and Gynaecological Nursing, SUM Nursing College, S ‘O’ A University
Bhubaneswar, Odisha, India
2
Assistant Professor, Department of Statistics, Tripura University, Tripura, India
ABSTRACT
The statistical quality control (SQC) techniques can be efficiently exploited to improve the quality of services as
well as the products. These tools helps to identify the assignable causes of variation in quality from that of the
chance causes, so that proper remedial measures can be taken at right time in order to improve the quality of
services. Paramedical services are to be promptly handled to provide quality service to the patients preferably
inpatients for their utmost satisfaction. The present study aims at analyzing the time taken to deliver different
paramedical services to the patients admitted in selected Hospital, Bhubaneswar. Here we identify the pitfalls of
the system in delivering such services and suggested some remedial measures in order to improve the quality of
various paramedical services.
Keywords and Phrases: Control Charts, CUSUM Charts, Paramedical Services, SQC.
I. INTRODUCTION
The pursuit of quality requires that organizations globally optimize their system of independent stakeholders. In
the context of paramedical services in a hospital, it includes paramedical staffs, patients and their attendants,
investors, suppliers, regulators, the environment and the community. The organization must work together with
other components to satisfy the needs of the stakeholders. Three types of quality are critical in service sectors
with a predictable degree of uniformity and dependability, at low cost, which are suited to the market. They are
(1) quality of design or redesign, (2) quality of conformance, and (3) quality of performance (Juran, 1979).
Quality of design focuses on determining quality characteristics of services that are suited to the needs and
wants of the market at a given cost; i.e., it develops the service quality from consumer orientation.
Figure 1: Quality of Design and redesign
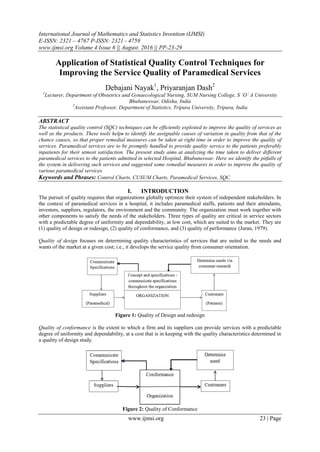
Quality of conformance is the extent to which a firm and its suppliers can provide services with a predictable
degree of uniformity and dependability, at a cost that is in keeping with the quality characteristics determined in
a quality of design study.
Figure 2: Quality of Conformance
2. Application Of Statistical Quality Control Techniques For Improving The Service Quality Of…
www.ijmsi.org 24 | Page
Quality of performance studies focus on determining how the quality characteristics identified in quality of
design studies, and improved and innovated in quality of performance studies, are performing in the market
place.
Figure 3: Quality of Performance
The above three aspects of quality induces a chain reaction to increase the productivity as result several benefits
can be achieved from improving the process like rework decreases, productivity rises, quality improves, cost for
better service decreased, price can be cut, and workers‟ morale goes up. The last aspect leads to further benefits:
less employee absence, less burnout, more interest in the job, and increased motivation to work. This is the
chain reaction of quality (Gitlow et al., 2005).
The above concepts of quality and its benefits motivates to investigate about different paramedical services
imparted for the hospital inpatients at IMS & SH, as these services are very much essential as well as bare
necessary for the patients for their further diagnosis. Therefore much emphasis should be given on timely
delivering these services to the patients in a hospital. We have investigated on these services on the light of the
following objectives to improve the productivity of these services there by increasing the patients satisfaction as
well as the overall development of the hospital also.
II. OBJECTIVES
Keeping in view the circumstances and necessities of the timely delivering of different paramedical services, we
point out certain objectives dealt here as:
i. To identify different paramedical services frequently handled for the hospital inpatient.
ii. To estimate the average time needed to deliver these services to the patients.
iii. To analyze the process of delivering these services and point out the stages at which delay occurs.
iv. To identify the causes of such delay.
v. To suggest remedial measures to be practiced for avoiding such delays and improve the system.
III. SOURCES OF DATA AND TECHNIQUES OF DATA COLLECTION
The present study is an analytical as well as a descriptive study conducted for different paramedical services
frequently handled for the patients already admitted in the IMS & SUM Hospital. So, we utilize both primary as
well as secondary data for this paper. The secondary data collected for different paramedical services performed
for admitted patients only for the month of February, 2015. The time periods for delivering these services are
noted down. Again, to identify different possibilities and constraints from the patient part, some patients and
their attendants/ relatives present were also interviewed face to face. To identify the prospects from the hospital
side, a face to face interview was also conducted with some paramedical staffs. Again for the validity and the
reliability of the answers provided by these fellows from both sides, observation technique was also used.
IV. METHODOLOGY ADOPTED
In health care services, paramedical services plays an important role particularly at the initial stage and also at
further stages of investigation to draw inferences about the health condition and stability of the patients. During
our study period, we have noted 141 numbers of different paramedical services (blood and urine investigations)
imparted to the inpatients at IMS & SH. First we have identified the most frequently imparted services during
the month of February, 2015. These services are Blood sugar (FBS), CBC, Creatinine, HIV-HbsAG-HCV,
L.F.T. with Serum Protein, Sodium Potassium Chloride, Urea and Urine (R/M). The Table 1 gives the number
of times these services imparted during the month of February, 2015.
3. Application Of Statistical Quality Control Techniques For Improving The Service Quality Of…
www.ijmsi.org 25 | Page
Table 1: Most Imparted Paramedical Services at IMS & SH in February, 2015.
Name of the Service Frequency Percent
Blood Sugar (FBS) 1915 6.4
CBC 3452 11.5
Creatinine 2816 9.4
HIV-HbsAG.HCV 1203 4.0
L.F.T With Serum Protein 1022 3.4
Sodium Potassium Chloride 2216 7.4
Urea 2125 7.1
Urine (R/M) 1932 6.4
Others 13345 44.4
Total 30026 100.0
From the above eight different kind of services, we have considered the seven of these except CBC as the time
for providing the CBC to the patients could not available during the study. When these services are defined and
documented, they can be stabilized and then improved. In great measure this can be accomplished through the
use of statistical control charts, proposed by Shewhart (1931). These are used in an environment that provides a
positive atmosphere for the process improvement, which is the desire at the top management.
The variation in the quality of different investigations are classified into the following categories:
1. Variation due to assignable causes: These type of variations mostly occurs due to the negligence of
different paramedical staffs, fault in the machines used, inferior quality and standards of different chemicals
and other instruments used, etc. These variations can be controlled by putting some reformations like
changing the staffs, changing the raw material quality, improving the efficiency of the machines, etc.
2. Variation due to chance causes: Causes of variation is completely unknown and it may be due to some
complex causes on which we do not have any control over these.
The objective of the Statistical Quality Control (SQC) is to eliminate the assignable causes of variation by
adopting suitable devices in order to bring the substantial improvement in the quality of the process. In our
study, we have used the Control charts for mean and range for identifying the process faults. To draw these
control charts, we followed the following steps:
STEP 1: Measurements - Without valid measurements, process improvements are difficult if not impossible,
and perhaps the best means of measuring the process performance is a statistical control chart. Here we have
noted the time taken for seven investigations as above and note down the time taken to deliver these services.
STEP 2: Selection of Samples or Sub-groups - For this, a sample (subgroup) of unequal size is taken at
regular intervals. We have considered unequal sample size because the services are not uniform through time.
STEP 3: Preparing the Control Charts – After selecting the subgroups, the control charts for mean and range
was prepared for all these seven investigations by using SPSS 2.0 software. It consists of three parallel lines
namely, a central line (CL), an Upper control line (UCL) and a Lower control line (LCL) based on
Control limits. When the sample values lies within these two control limits, then the process is said to be under
control.
Figure 4: A Typical Control Chart
4. Application Of Statistical Quality Control Techniques For Improving The Service Quality Of…
www.ijmsi.org 26 | Page
We specify the following criteria to detect the out of control in the process:
i. Observed sample points goes beyond the control limits, i.e. above the UCL or below the LCL,
ii. A run of 8 or more points in either side of the CL even though the process is within control in order to
detect the presence of any kind of subjective bias in the process.
In the second case given above, we have analyzed the run of sample points using a CUSUM chart to identify the
exact sample point where the process started with an error.
V. ANALYSIS AND DISCUSSIONS
We now analyze each one of the seven most handled paramedical services one by one and discuss about the
quality of such services with reference to the time of delivering such services only.
5.1 Blood Sugar (FBS) – The Figure 5 gives the control charts for mean and range of time taken for testing
Blood Sugar (FBS). Table 2 gives the sub-sample numbers when the process goes out of control. Since, it
was observed that 8 consecutive points below the central line, a CUSUM chart indicates that the process
actually started going beyond control at sample number 107. From the above it can be seen that there are
some samples for which the time taken for delivering this service is very high as 8 points falls above the
UCL.
Figure 5: Control Charts for Mean and Range of time taken for FBS
Table 2: Rule Violations (15 points violate control rules.)
Sub-Sample No. Violations for Points
7, 33, 42, 45, 56, 98, 109, 125, 132, 138 Greater than +3 sigma
106, 107, 121, 122, 123 8 consecutive points below the central line
5.2 Creatinine – The Figure 6 gives the control charts for mean and range of time taken for testing
Creatinine. Table 3 gives the sub-sample numbers when the process goes out of control. From the above
it can be seen that there are some samples for which the time taken for delivering this service is very high
as 4 points falls above the UCL and for one sample the range is very high in comparison to others as
observed in the range chart.
Figure 6: Control Charts for Mean and Range of time taken for Creatinine
5. Application Of Statistical Quality Control Techniques For Improving The Service Quality Of…
www.ijmsi.org 27 | Page
Table 3: Rule Violations (4 points violate control rules.)
Sub-Sample No. Violations for Points
14, 48, 61, 62 Greater than +3 sigma
5.3 HIV, HbsAG, HCV – The Figure 7 gives the control charts for mean and range of time taken for testing
HIV, HbsAG, HCV. Table 4 gives the sub-sample numbers when the process goes out of control. From
the above it can be seen that there are some samples for which the time taken for delivering this service is
very high as 6 points falls above the UCL and for most of the samples the range is very high in
comparison to others and the points goes out of control limits as observed in the range chart. So, there is a
large variation in providing such service to the patients.
Figure 7: Control Charts for Mean and Range of time taken for HIV, HbsAG, HCV
Table 4: Rule Violations (6 points violate control rules.)
Sub-Sample No. Violations for Points
16,25, 64, 68, 91, 115 Greater than +3 sigma
5.4 L.F.T. with Serum Protein – The Figure 8 gives the control charts for mean and range of time taken for
testing L.F.T. with Serum Protein. Table 5 gives the sub-sample numbers when the process goes out of
control. From the above it can be seen that there are only two samples for which the time taken for
delivering this service is very high and for most of the samples the range is very high in comparison to
others and the points goes above the UCL in the range chart. So, there is a large variation in providing
such service to the patients.
Figure 8: Control Charts for Mean and Range of time taken for L.F.T. with Serum Protein
Table 5: Rule Violations (2 points violate control rules.)
Sub- Sample No. Violations for Points
8 , 32 Greater than +3 sigma
5.5 Sodium, Potassium, Chloride – The Figure 9 gives the control charts for mean and range of time taken
for testing Sodium, Potassium, Chloride. Table 6 gives the sub-sample numbers when the process goes
out of control. From the above it can be seen that there are only two samples for which the time taken for
6. Application Of Statistical Quality Control Techniques For Improving The Service Quality Of…
www.ijmsi.org 28 | Page
delivering this service is very high and for most of the samples the range is very high in comparison to
others and the points goes above the UCL in the range chart. So, there is a large variation in providing
such service to the patients. Again, it was observed that 8 consecutive points below the central line, a
CUSUM chart indicates that the process actually started going beyond control at sample number 74.
Figure 9: Control Charts for Mean and Range of time taken for Sodium, Potassium, Chloride
Table 6: Rule Violations (7 points violate control rules.)
Sub- Sample No. Violations for Points
9, 104 Greater than +3 sigma
72, 73, 74, 75, 76 8 consecutive points below the center line
5.6 Urea – The Figure 10 gives the control charts for mean and range of time taken for testing Urea. Table 7
gives the sub-sample numbers when the process goes out of control. From the above it can be seen that
there are only two samples for which the time taken for delivering this service is very high and for some
the samples the points goes above the UCL in the range chart. So, there is a large variation in providing
such service to the patients. Again, it was observed that 8 consecutive points below the central line, a
CUSUM chart indicates that the process actually started going beyond control at sample number 78.
Figure 10: Control Charts for Mean and Range of time taken for Urea
Table 7: Rule Violations (3 points violate control rules.)
Sub- Sample No. Violations for Points
63, 68 Greater than +3 sigma
78 8 consecutive points below the center line
5.7 Urine (R/M) – The Figure 11 gives the control charts for mean and range of time taken for testing Urine
(R/M). Table 8 gives the sub-sample numbers when the process goes out of control. From the above it
can be seen that there are 18 samples for which the process goes out of control and for some the samples
the points goes above the UCL in the range chart. So, there is a large variation in providing such service
to the patients. Again, it was observed that 8 consecutive points below the central line observed at 15 sub-
samples, so a CUSUM chart indicates that the process actually started going beyond control at sample
numbers 15, 27, 55 and 70.
7. Application Of Statistical Quality Control Techniques For Improving The Service Quality Of…
www.ijmsi.org 29 | Page
Figure 11: Control Charts for Mean and Range of time taken for Urine (R/M)
Table 8: Rule Violations (18 points violate control rules.)
Sub- Sample No. Violations for Points
45, 57, 76 Greater than +3 sigma
15, 16, 27, 28, 29, 30, 31, 32, 33, 55,
56, 70, 71, 72, 73
8 consecutive points below the center line
VI. CONCLUSION AND SUGGESTIONS
We identified different frequently handled paramedical services (blood and urine investigations) at IMS & SH,
Bhubaneshwar and estimated the average time for their delivery. Using SQC we identified the points at which
there was delay in the delivery processes. The control charts for mean and range of time taken for the frequently
used paramedical services indicated that in most of the cases there was a clear violation from control rules.
Further analyses of the results indicated that there was delay in the delivery of the services provided during the
study period as in most cases, the values were falling above the UCL. It is now pertinent to conclude that a
prompt delivery service is highly essential and could bring down the variations arising due to the assignable
causes. Possible remedies could be i) educating the basic concepts of „Quality‟ to the paramedics ii) advice and
health education to the patients and their attendants regarding importance of early diagnosis and treatment for
support and co-operation to the paramedic staff iii) avoiding negligence iv) infrastructural improvement v)
filling the gap in shortage of staff by appointing qualified and experienced personnel vi) decrease workload
upon the paramedic to improve the quality of services and vii) careful and periodic monitoring & supervision of
the inpatient service by the upper management. These tiny steps could help in increasing patient benefits,
improve quality of services and the productivity of the health care system.
REFERENCES
[1]. Ahmed, S., & Hassan, M. (2003). Survey and case investigations on application of quality management tools and techniques in
SMIs. International Journal of Quality & Reliability Management, 20(7), 795-826.
[2]. Amasaka, K. (2004). “Science SQC”, New Quality Control Principle (pp. 85-102). Springer Japan.
[3]. Chakravarty, A., Sahu, A., Biswas, M., Chatterjee, K., & Rath, S. (2015). A study of assessment of patient safety climate in tertiary
care hospitals.Medical Journal Armed Forces India, 71(2), 152-157.
[4]. Colton, D. (2000). Quality improvement in health care conceptual and historical foundations. Evaluation & the health
professions, 23(1), 7-42.
[5]. Gitlow, H., Oppenheim, A.J., Oppenheim, R., Levine, D.M., (2005). Quality Management, 3rd Edition, McGraw-Hill, New York,
pp. 19-23.
[6]. Juran, J. (1979). Quality Control Handbook, 3rd edition, McGraw-Hill, New York, pp. 2-9.
[7]. Ryan, T. P. (2011). Statistical methods for quality improvement. John Wiley & Sons.
[8]. Shewhart, W. A. (1931). Economic control of quality of manufactured product (Vol. 509). ASQ Quality Press